. 2022 Sep 3;11(17):2753.
doi: 10.3390/cells11172753.

Na,K-ATPase Acts as a Beta-Amyloid Receptor Triggering Src Kinase Activation

Affiliations

Na,K-ATPase Acts as a Beta-Amyloid Receptor Triggering Src Kinase Activation

Irina Yu Petrushanko et al. Cells. .

Abstract

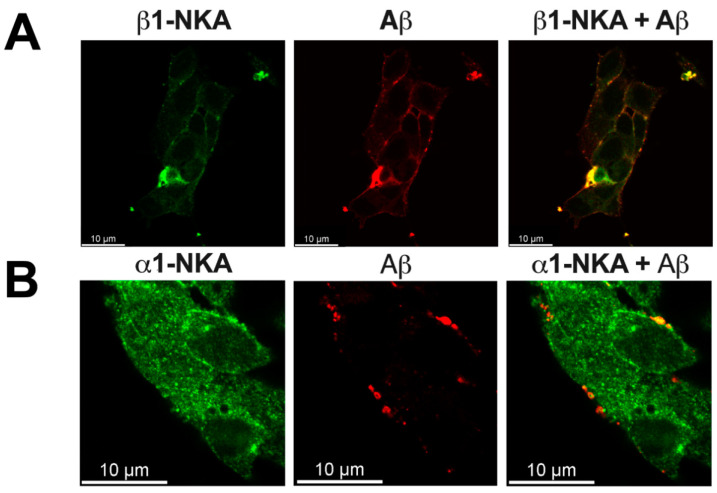
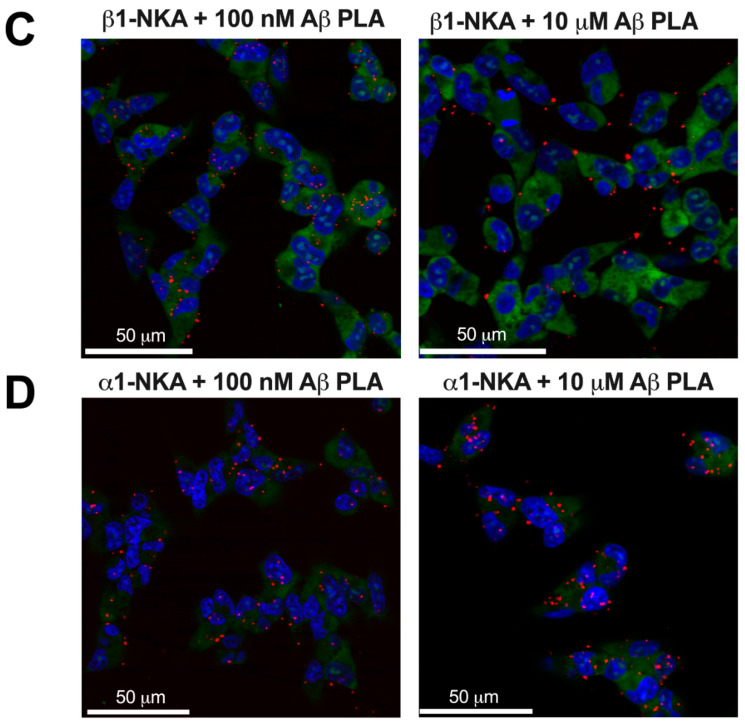
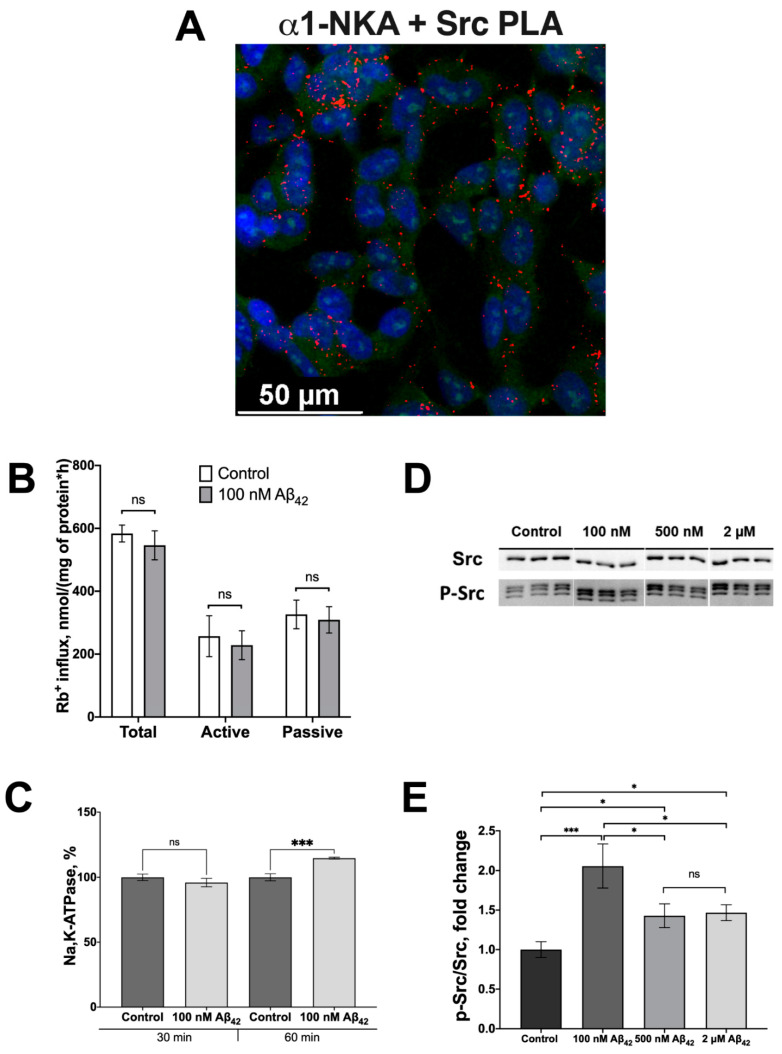
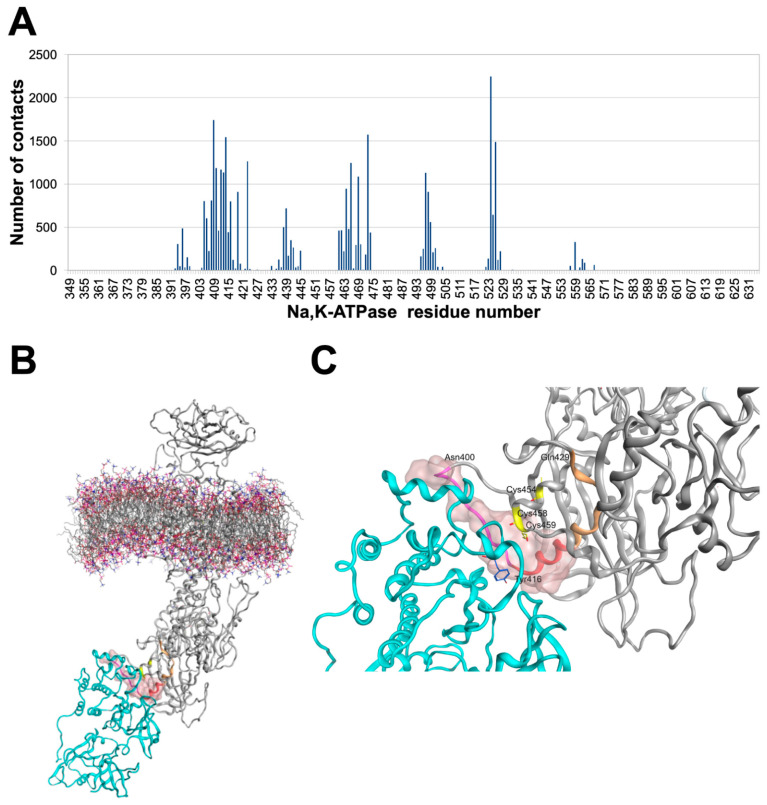
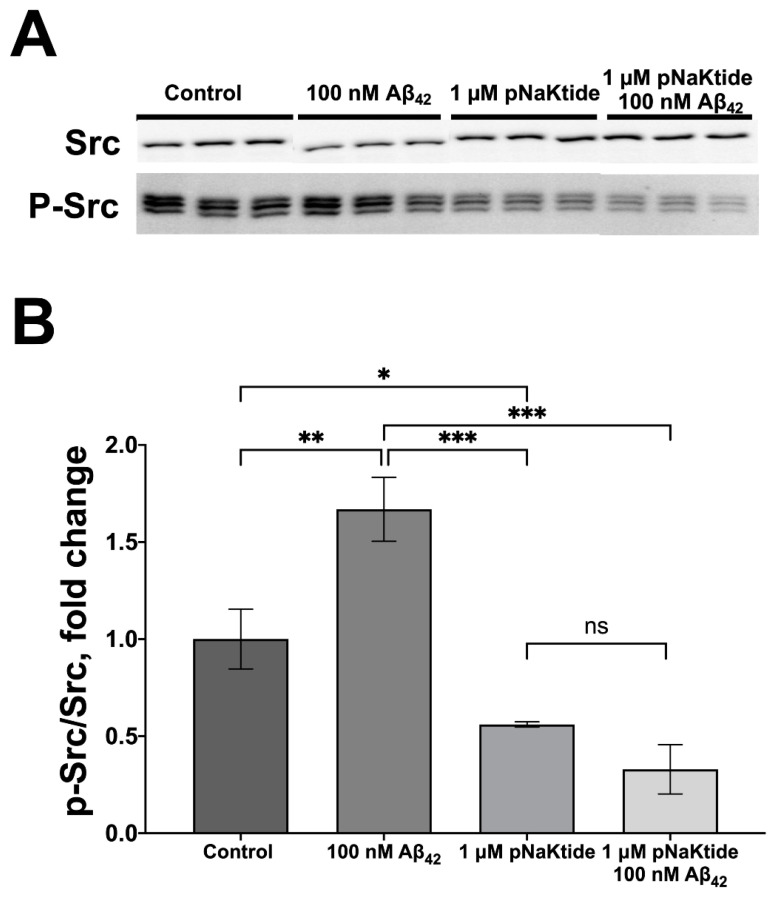
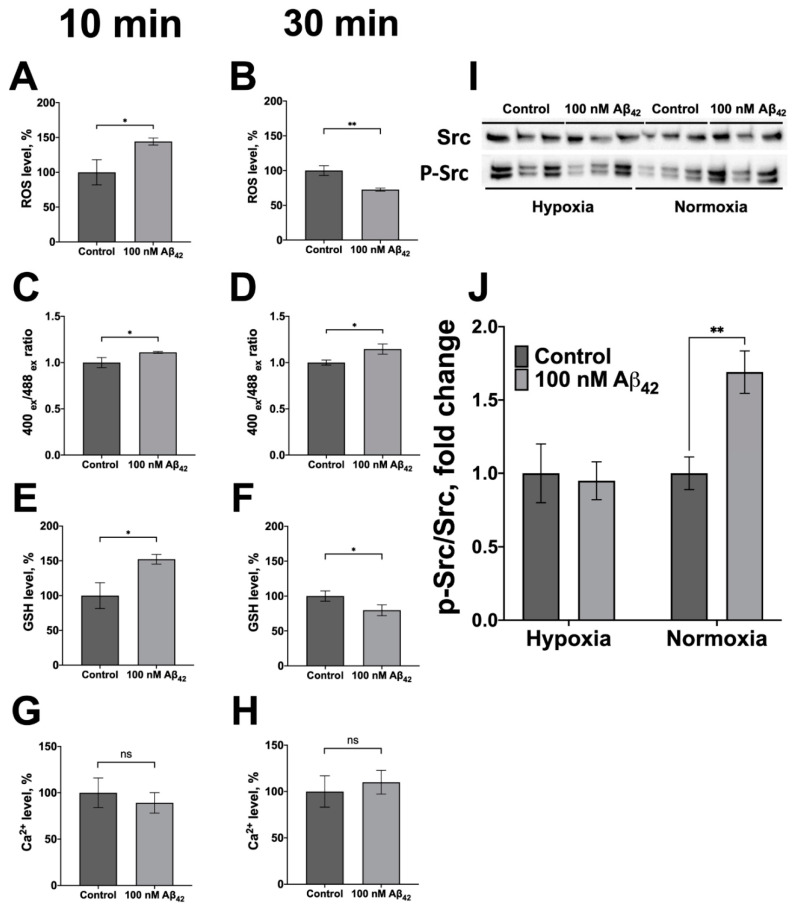
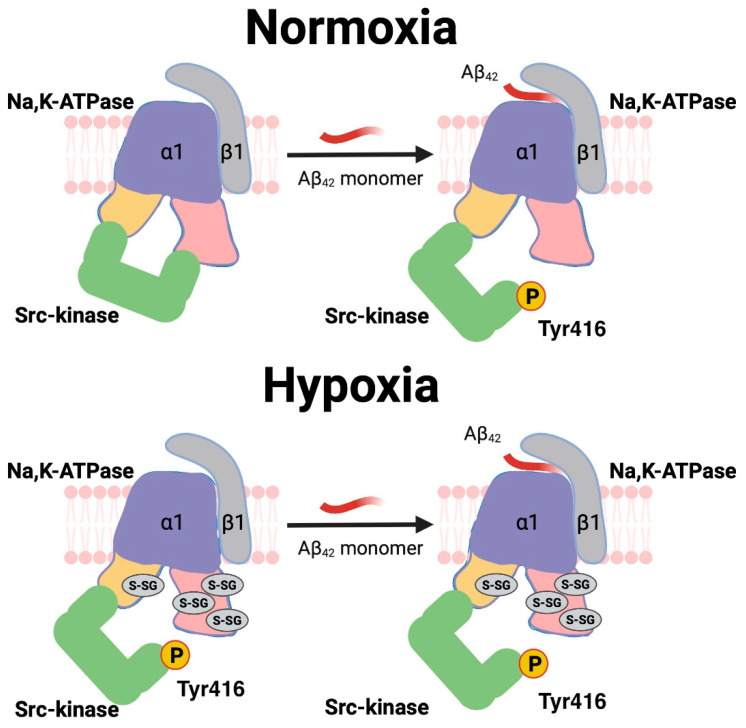
Beta-amyloid (Aβ) has a dual role, both as an important factor in the pathology of Alzheimer's disease and as a regulator in brain physiology. The inhibitory effect of Aβ42 oligomers on Na,K-ATPase contributes to neuronal dysfunction in Alzheimer's disease. Still, the physiological role of the monomeric form of Aβ42 interaction with Na,K-ATPase remains unclear. We report that Na,K-ATPase serves as a receptor for Aβ42 monomer, triggering Src kinase activation. The co-localization of Aβ42 with α1- and β1-subunits of Na,K-ATPase, and Na,K-ATPase with Src kinase in SH-SY5Y neuroblastoma cells, was observed. Treatment of cells with 100 nM Aβ42 causes Src kinase activation, but does not alter Na,K-ATPase transport activity. The interaction of Aβ42 with α1β1 Na,K-ATPase isozyme leads to activation of Src kinase associated with the enzyme. Notably, prevention of Na,K-ATPase:Src kinase interaction by a specific inhibitor pNaKtide disrupts the Aβ-induced Src kinase activation. Stimulatory effect of Aβ42 on Src kinase was lost under hypoxic conditions, which was similar to the effect of specific Na,K-ATPase ligands, the cardiotonic steroids. Our findings identify Na,K-ATPase as a Aβ42 receptor, thus opening a prospect on exploring the physiological and pathological Src kinase activation caused by Aβ42 in the nervous system.

Keywords: Na,K-ATPase; Src kinase; beta-amyloid; hypoxia; receptor function.


Conflict of interest statement

The authors declare no conflict of interest.

Figures

Figure 1
Figure 1
42 co-localizes with Na,K-ATPase. (A,B) Co-localization studies with confocal microscopy. Representative immunofluorescence images of neuroblastoma cells SH-SY5Y treated with 40 µM Aβ42 for 2 h. The distribution of (A) β1- and (B) α1-subunits of Na,K-ATPase (green fluorescence), the distribution of Aβ42 (red fluorescence), and the merged (β1/α1-subunit and Aβ42) image. Scale bar—10 µm. (C,D) Co-localization studies with Proximity Ligation Assay (PLA) in SH-SY5Y neuroblastoma cells. The close proximity sites, where the studied molecules are closer than 40 nm to each other, are visualized as red dots using the Duolink Red detection reagent. The confocal merged images of Hoechst fluorescence (blue), RNASelect (green) and Duolink Red (red) fluorescence are presented. (C) Close proximity of Aβ42 and Na,K-ATPase β1-subunit in SH-SY5Y cells treated with 100 nM and 10 µM Aβ42 for 1 h. Scale bar—50 µm. (D) Close proximity of Aβ42 and Na,K-ATPase α1-subunit in SH-SY5Y neuroblastoma cells treated with 100 nM and 10 µM Aβ42 for 1 h. Scale bar—50 µm.
Figure 1
Figure 1
42 co-localizes with Na,K-ATPase. (A,B) Co-localization studies with confocal microscopy. Representative immunofluorescence images of neuroblastoma cells SH-SY5Y treated with 40 µM Aβ42 for 2 h. The distribution of (A) β1- and (B) α1-subunits of Na,K-ATPase (green fluorescence), the distribution of Aβ42 (red fluorescence), and the merged (β1/α1-subunit and Aβ42) image. Scale bar—10 µm. (C,D) Co-localization studies with Proximity Ligation Assay (PLA) in SH-SY5Y neuroblastoma cells. The close proximity sites, where the studied molecules are closer than 40 nm to each other, are visualized as red dots using the Duolink Red detection reagent. The confocal merged images of Hoechst fluorescence (blue), RNASelect (green) and Duolink Red (red) fluorescence are presented. (C) Close proximity of Aβ42 and Na,K-ATPase β1-subunit in SH-SY5Y cells treated with 100 nM and 10 µM Aβ42 for 1 h. Scale bar—50 µm. (D) Close proximity of Aβ42 and Na,K-ATPase α1-subunit in SH-SY5Y neuroblastoma cells treated with 100 nM and 10 µM Aβ42 for 1 h. Scale bar—50 µm.
Figure 2
Figure 2
42 activates Src-kinase in nanomolar concentrations. (A) Co-localization studies with Proximity Ligation Assay. Close proximity of Na,K-ATPase α1-subunit and Src kinase in the SH-SY5Y neuroblastoma cells. The confocal merged image of Hoechst fluorescence (blue), RNASelect (green) and Duolink Red (red) fluorescence is presented. Scale bar—50 µm. (B) The effect of Aβ42 on the Na,K-ATPase transport activity in SH-SY5Y cells. K+ (Rb+) influx after 30 min treatment with 100 nM Aβ42. Total Rb+ influx into the cells was measured in the absence of ouabain (Total); “Passive” denotes ouabain-resistant component of Rb+ influx in the sample where ouabain was added. Difference between the total and the passive fluxes gives the active (Active) Rb+ influx mediated by the Na,K-ATPase. (C) The changes in Na,K-ATPase levels in SH-SY5Y neuroblastoma cells after 30 or 60 min of incubation with 100 nM Aβ42. Na,K-ATPase levels were evaluated by flow cytometry. (D,E) Dose-dependent activation of Src by Aβ42. The ratio of phospho(Tyr)-416 Src to the total Src has been calculated. The phosphorylated and total Src levels have been measured with Western blot in SH-SY5Y neuroblastoma cells treated with 100 nM, 500 nM and 2 µM of Aβ42 for 30 min and normalized for control. Mean values ± SD from at least three independent experiments are shown. *—p < 0.05, ***—p < 0.001 compared to the control, ns—nonsignificant.
Figure 3
Figure 3
42 activates Src kinase autophosphorylation via Na,K-ATPase in vitro. Recombinant human Src kinase was preincubated with Na,K-ATPase (NKA), Aβ42, reverse 42−1 peptide (CP) or Ouabain (Oub). Then, samples were incubated with ATP (15 min, 37 °C). (A) The p-Src and the total Src levels in the samples were measured with Western blot and (B) the p-Src/Src ratio was calculated and normalized for control. Mean values ± SD from at least three independent experiments are shown. *—p < 0.05, ***—p < 0.001 compared to the control are shown, all other pairwise comparisons were nonsignificant.
Figure 4
Figure 4
Modeling of Src kinase interaction with Na,K-ATPase. Interaction interface between human Na,K-ATPase and Src kinase studied by molecular modeling. (A) Contact frequency histogram of Na,K-ATPase residues according to 70 complexes of Na,K-ATPase:Src kinase obtained by targeted docking on servers PatchDock and Haddock. (B) Best rated docking complex after 100 ns of MD. (C) Interaction interface between Na,K-ATPase and Src kinase in the best rated docking complex after 100 ns of MD. Src kinase is colored cyan and Na,K-ATPase is colored gray. The interaction surface is shown with translucent pink. Na,K-ATPase residues 400–418 that interact with Src kinase are colored with magenta and red (residue 410–418 are the part of NaKtide peptide sequence). Residues 419–429 of NaKtide peptide sequence that do not participate in interaction with Src kinase are colored beige. Cysteines 454, 458 and 459 that are located inside the interaction are colored yellow. Tyrosine 416 which is located inside the interaction interface is shown.
Figure 5
Figure 5
pNaKtide prevents Aβ42-induced activation of Src kinase. SH-SY5Y cells were preincubated for 1 h with 1 µM pNaKtide and then the cells were incubated with the medium containing 100 nM Aβ42 for 30 min. (A) The cells were lysed and the phospho(Tyr416)Src kinase (p-Src) and the total Src levels were measured with Western blot. (B) The corresponding p-Src/Src ratio was calculated and normalized for control. Mean values ± SD from at least three independent experiments are shown. *—p < 0.05, **—p < 0.01, ***—p < 0.001 compared to the control, ns—nonsignificant.
Figure 6
Figure 6
42 alters cellular redox parameters and does not activate Src kinase in hypoxic conditions. (A,B) The effect of Aβ42 on the levels of reactive oxygen species (ROS). (C,D) The oxidized glutathione/reduced glutathione (GSSG/GSH) ratio. (E,F) Reduced glutathione (GSH), and (G,H) Ca2+ levels in the SH-SY5Y human neuroblastoma cells. The cells were harvested, stained with fluorescent probes: Dyhydrorhodamine 123 for ROS measurements, ThiolTracker Violet for GSH measurements, and Fluo-4 for Ca2+ levels measurements and incubated with 100 nM Aβ42 for 10 min (A,C,E,G) or for 30 min (Β,D,F,H). The GSSG/GSH ratio was determined with Grx1-roGFP genetically encoded ratiometric sensor. The change in the GSSG/GSH ratio was determined by calculating the ratio of the fluorescence intensity values at a wavelength of 535 nm, obtained with excitation at the wavelengths of 488 and 400 nm. All parameters were normalized for control. (I,J) The ratio of phospho(Tyr-416)-Src to total Src in SH-SY5Y neuroblastoma cells incubated with 100 nM of Aβ42 for 30 min under hypoxic conditions (1% O2) and standard conditions (20% O2) determined with Western blot. (I) The representative blot, and (J) the corresponding p-Src/Src ratio are presented. Mean values ± SD from at least three independent experiments are shown. *—p <0.05, **—p <0.01 compared to the control, ns—nonsignificant.
Figure 7
Figure 7
Src kinase regulation mediated by Na,K-ATPase in normoxic and hypoxic conditions. Under normixic conditions, Aβ binding leads to the release of the kinase domain of Src from the complex with the nucleotide binding domain (NBD) of Na,K-ATPase. The release induces Src kinase autophosphorylation at Tyr416 (located in the interaction interface), leading to an increase in the activity. In hypoxia, glutathionylation of the cysteine residues of the Na,K-ATPase NBD domain [73] from the interaction interface (Figure 5) was demonstrated and led to disruption of the interaction between Src kinase and Na,K-ATPase [47]. As a result, the binding of Aβ under hypoxic conditions does not lead to the activation of Src kinase.

References

    1. Meyer-Luehmann M., Coomaraswamy J., Bolmont T., Kaeser S., Schaefer C., Kilger E., Neuenschwander A., Abramowski D., Frey P., Jaton A.L., et al. Exogenous induction of cerebral beta-amyloidogenesis is governed by agent and host. Science. 2006;313:1781–1784. doi: 10.1126/science.1131864. - DOI - PubMed
    1. Prusiner S.B. Cell biology. A unifying role for prions in neurodegenerative diseases. Science. 2012;336:1511–1513. doi: 10.1126/science.1222951. - DOI - PMC - PubMed
    1. Jucker M., Walker L.C. Self-propagation of pathogenic protein aggregates in neurodegenerative diseases. Nature. 2013;501:45–51. doi: 10.1038/nature12481. - DOI - PMC - PubMed
    1. Brothers H.M., Gosztyla M.L., Robinson S.R. The Physiological Roles of Amyloid-β Peptide Hint at New Ways to Treat Alzheimer’s Disease. Front. Aging Neurosci. 2018;10:118. doi: 10.3389/fnagi.2018.00118. - DOI - PMC - PubMed
    1. Morley J.E., Farr S.A., Nguyen A.D., Xu F. What is the Physiological Function of Amyloid-Beta Protein? J. Nutr. Health Aging. 2019;23:225–226. doi: 10.1007/s12603-019-1162-5. - DOI - PubMed

Publication types

MeSH terms

LinkOut - more resources