. 2022 Aug 23;19(17):10482.
doi: 10.3390/ijerph191710482.

Fetal Exposure to Air Pollution in Late Pregnancy Significantly Increases ADHD-Risk Behavior in Early Childhood

Affiliations

Fetal Exposure to Air Pollution in Late Pregnancy Significantly Increases ADHD-Risk Behavior in Early Childhood

Binquan Liu et al. Int J Environ Res Public Health. .

Abstract

Background: Air pollution nowadays has seriously threatened the health of the Chinese population, especially in the vulnerable groups of fetuses, infants and toddlers. In particular, the effects of air pollution on children's neurobehavioral development have attracted widespread attention. Moreover, the early detection of a sensitive period is very important for the precise intervention of the disease. However, such studies focusing on hyperactive behaviors and susceptible window identification are currently lacking in China.

Objectives: The study aims to explore the correlation between air pollution exposure and hyperactive behaviors during the early life stage and attempt to identify whether a susceptible exposure window exists that is crucial for further precise intervention.

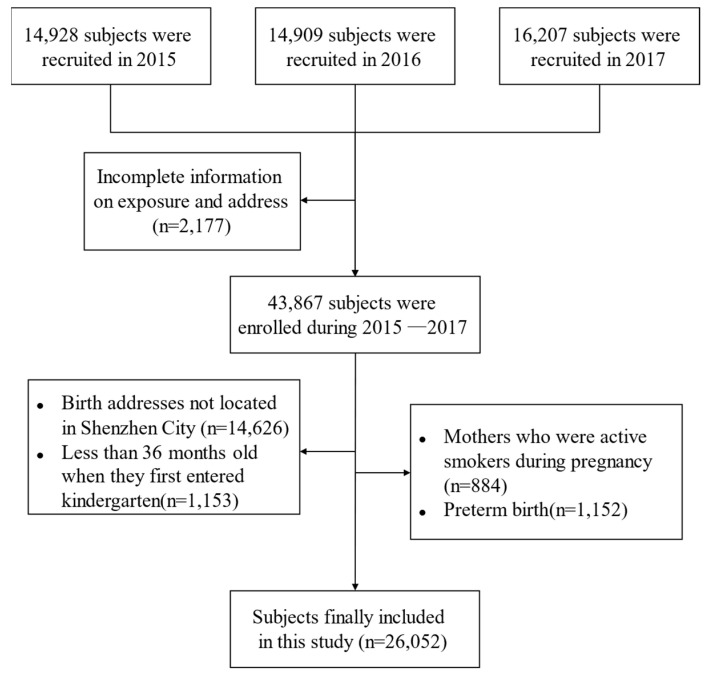
Methods: Based on the Longhua Child Cohort Study, we collected the basic information and hyperactivity index of 26,052 children using a questionnaire conducted from 2015 to 2017, and the Conners' Parent Rating Scale-revised (CPRS-48) was used to assess hyperactive behaviors. Moreover, the data of air pollution concentration (PM10, PM2.5, NO2, CO, O3 and SO2) were collected from the monitoring station between 2011 to 2017, and a land-use random forest model was used to evaluate the exposure level of each subject. Furthermore, Distributed lag non-linear models (DLNMs) were applied for statistic analysis.

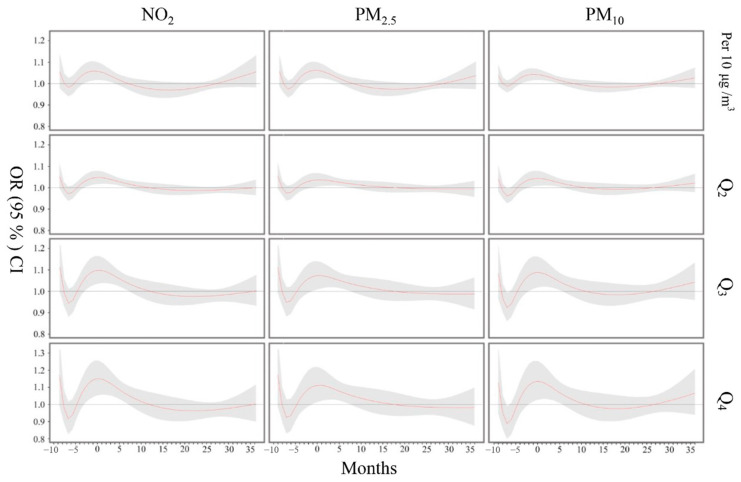
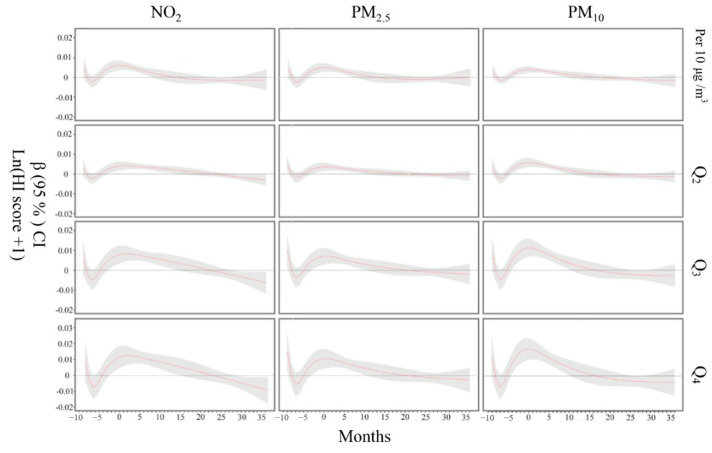
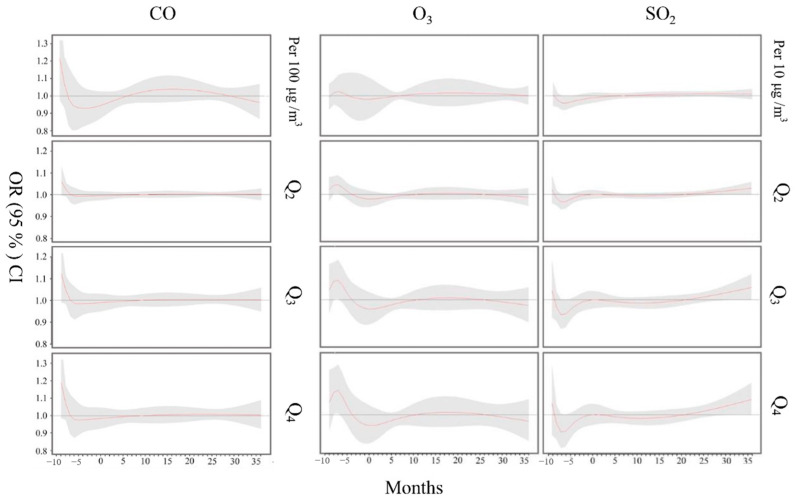
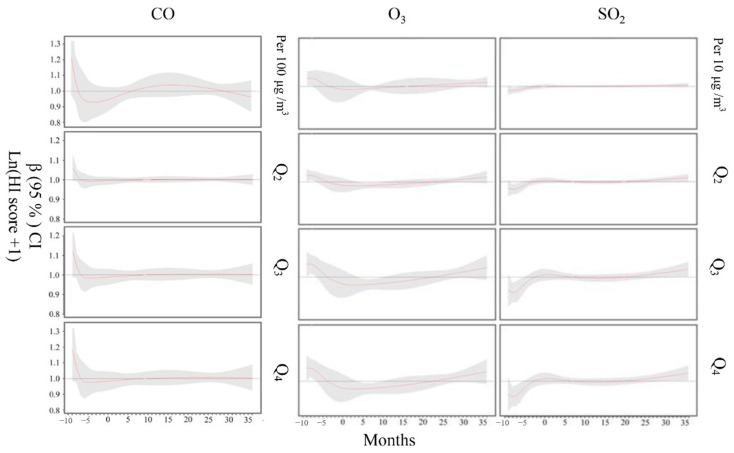
Results: The risk of child hyperactivity was found to be positively associated with early life exposure to PM10, PM2.5 and NO2. In particular, for an increase of per 10 µg/m3 in PM10, PM2.5 and NO2 exposure concentration during early life, the risk of child hyperactivity increased significantly during the seventh month of pregnancy to the fourth month after birth, with the strongest association in the ninth month of pregnancy (PM10: OR = 1.043, 95% CI: 1.016-1.071; PM2.5: OR = 1.062, 95% CI: 1.024-1.102; NO2: OR = 1.043, 95% CI: 1.016-1.071). However, no significant associations among early life exposure to CO, O3 and SO2 and child hyperactive behaviors were observed.

Conclusions: Early life exposure to PM10, PM2.5 and NO2 is associated with an increased risk of child ADHD-like behaviors at the age around 3 years, and the late-prenatal and early postnatal periods might be the susceptible exposure windows.

Keywords: ADHD-like behavior; air pollution; fetal exposure.


Conflict of interest statement

The authors declare no conflict of interest.

Figures

Figure 1
Figure 1
Flowchart of the study population inclusion.
Figure 2
Figure 2
Odds ratio of child hyperactivity with monthly PM2.5, PM10 and NO2 exposure from fetal period to the first 3 years of life. Note: ORs (95% CI) in the three uppermost charts indicate the risks of PM2.5, PM10 and NO2 for each 10 μg/m3 increment in monthly PM2.5, PM10 and NO2 concentrations during pregnancy. ORs (95% CI) in the other charts indicate the risks of PM2.5, PM10 and NO2 for the second (Q2), third (Q3) and fourth quartiles (Q4) of monthly PM2.5, PM10 and NO2 concentrations from the fetal period to the first 3 years of life compared with the first quartile (Q1) as the reference. Zero in the x-axis scale indicates the time of birth, minus numbers indicate the weeks prior to birth and plus numbers indicate the postnatal months. All models were adjusted for monthly mean ambient temperature, household air pollution conditions, child sex and age, maternal and paternal ages at birth, maternal and paternal education, family income, marital status, parity, multivitamin supplementation during pregnancy, gestational diseases, passive smoking during pregnancy, gestation alcohol consumption, feeding pattern, average daily sleep duration for children and frequencies of parent–child interactive activities at 0–1 and 1–3 years old.
Figure 3
Figure 3
Changes in child ln (HI score + 1) at around 3 years old associated with monthly PM2.5, PM10 and NO2 exposure from fetal period to the first 3 years of life. Note: β (95% CI) in the three uppermost charts indicate the risks of PM2.5, PM10 and NO2 for each 10 μg/m3 increment in monthly PM2.5, PM10 and NO2 concentrations during pregnancy. β (95% CI) in the other charts indicate the risks of PM2.5, PM10 and NO2 for the second (Q2), third (Q3) and fourth quartiles (Q4) of monthly PM2.5, PM10 and NO2 concentrations from fetal period to the first 3 years of life compared with the first quartile (Q1) as the reference. Zero in the x-axis scale indicates the time of birth, minus numbers indicate the weeks prior to birth and plus numbers indicate the postnatal months. All models were adjusted for monthly mean ambient temperature, household air pollution conditions, child sex and age, maternal and paternal ages at birth, maternal and paternal education, family income, marital status, parity, multivitamin supplementation during pregnancy, gestational diseases, passive smoking during pregnancy, gestation alcohol consumption, feeding pattern, average daily sleep duration for children and frequencies of parent–child interactive activities at 0–1 and 1–3 years old.
Figure 4
Figure 4
Odds ratio of child hyperactivity with monthly CO, O3 and SO2 exposure from fetal period to the first 3 years of life. Note: ORs (95% CI) in the three uppermost charts indicate the risks of CO, O3 and SO2 for each 10 μg/m3 increment in monthly CO, O3 and SO2 concentrations during pregnancy. ORs (95% CI) in the other charts indicate the risks of CO, O3 and SO2 for the second (Q2), third (Q3) and fourth quartiles (Q4) of monthly PM2.5, PM10 and NO2 concentrations from fetal period to the first 3 years of life compared with the first quartile (Q1) as the reference. Zero in the x-axis scale indicates the time of birth, minus numbers indicate the weeks prior to birth and plus numbers indicate the postnatal months. All models were adjusted for monthly mean ambient temperature, household air pollution conditions, child sex and age, maternal and paternal ages at birth, maternal and paternal education, family income, marital status, parity, multivitamin supplementation during pregnancy, gestational diseases, passive smoking during pregnancy, gestation alcohol consumption, feeding pattern, average daily sleep duration for children and frequencies of parent–child interactive activities at 0–1 and 1–3 years old.
Figure 5
Figure 5
Changes in child ln (HI score +1) around 3 years old associated with monthly CO, O3 and SO2 exposure from fetal period to the first 3 years of life. Note: β (95% CI) in the three uppermost charts indicate the risks of CO, O3 and SO2 for each 10 μg/m3 increment in monthly CO, O3 and SO2 concentrations during pregnancy. β (95% CI) in the other charts indicate the risks of CO, O3 and SO2 for the second (Q2), third (Q3) and fourth quartiles (Q4) of monthly PM2.5, PM10 and NO2 concentrations from fetal period to the first 3 years of life compared with the first quartile (Q1) as the reference. Zero in the x-axis scale indicates the time of birth, minus numbers indicate the weeks prior to birth and plus numbers indicate the postnatal months. All models were adjusted for monthly mean ambient temperature, household air pollution conditions, child sex and age, maternal and paternal ages at birth, maternal and paternal education, family income, marital status, parity, multivitamins supplementation during pregnancy, gestational diseases, passive smoking during pregnancy, gestation alcohol consumption, feeding pattern, average daily sleep duration for children and frequencies of parent–child interactive activities at 0–1 and 1–3 years old.

References

    1. Di Q., Wang Y., Zanobetti A., Wang Y., Koutrakis P., Choirat C., Dominici F., Schwartz J.D. Air Pollution and Mortality in the Medicare Population. N. Engl. J. Med. 2017;376:2513–2522. doi: 10.1056/NEJMoa1702747. - DOI - PMC - PubMed
    1. Zare Sakhvidi M.J., Lequy E., Goldberg M., Jacquemin B. Air pollution exposure and bladder, kidney and urinary tract cancer risk: A systematic review. Environ. Pollut. 2020;267:115328. doi: 10.1016/j.envpol.2020.115328. - DOI - PubMed
    1. Zhang Z., Wang J., Kwong J.C., Burnett R.T., van Donkelaar A., Hystad P., Martin R.V., Bai L., McLaughlin J., Chen H. Long-term exposure to air pollution and mortality in a prospective cohort: The Ontario Health Study. Environ. Int. 2021;154:106570. doi: 10.1016/j.envint.2021.106570. - DOI - PubMed
    1. Attademo L., Bernardini F. Air Pollution as Risk Factor for Mental Disorders: In Search for a Possible Link with Alzheimer’s Disease and Schizophrenia. J. Alzheimers Dis. 2020;76:825–830. doi: 10.3233/JAD-200289. - DOI - PubMed
    1. Perera F.P., Wang S., Rauh V., Zhou H., Stigter L., Camann D., Jedrychowski W., Mroz E., Majewska R. Prenatal exposure to air pollution, maternal psychological distress, and child behavior. Pediatrics. 2013;132:e1284–e1294. doi: 10.1542/peds.2012-3844. - DOI - PMC - PubMed

Publication types