Review
. 2022 Aug 31;11(17):5139.
doi: 10.3390/jcm11175139.

Advances in Optical Coherence Tomography Imaging Technology and Techniques for Choroidal and Retinal Disorders

Affiliations
Review

Advances in Optical Coherence Tomography Imaging Technology and Techniques for Choroidal and Retinal Disorders

Joshua Ong et al. J Clin Med. .

Abstract

Optical coherence tomography (OCT) imaging has played a pivotal role in the field of retina. This light-based, non-invasive imaging modality provides high-quality, cross-sectional analysis of the retina and has revolutionized the diagnosis and management of retinal and choroidal diseases. Since its introduction in the early 1990s, OCT technology has continued to advance to provide quicker acquisition times and higher resolution. In this manuscript, we discuss some of the most recent advances in OCT technology and techniques for choroidal and retinal diseases. The emerging innovations discussed include wide-field OCT, adaptive optics OCT, polarization sensitive OCT, full-field OCT, hand-held OCT, intraoperative OCT, at-home OCT, and more. The applications of these rising OCT systems and techniques will allow for a closer monitoring of chorioretinal diseases and treatment response, more robust analysis in basic science research, and further insights into surgical management. In addition, these innovations to optimize visualization of the choroid and retina offer a promising future for advancing our understanding of the pathophysiology of chorioretinal diseases.

Keywords: advances; choroid; optical coherence tomography; retina; technology.


Conflict of interest statement

The authors declare no conflict of interest.

Figures

Figure 1
Figure 1
Visible light OCT (vis-OCT) imaging. Side-by-side comparison of vis-OCT (A) and commercial NIR-based OCT (B). (C) Magnified vis-OCT that shows outer retinal bands 1–4, with segmented hyperreflective bands and hyporeflective zones in outer retinal band 4, compared to magnified commercial NIR-based OCT (D). (E,F) Vis-OCT (linear scale). Reprinted with permission from Zhang et al. [18]. Visible Light Optical Coherence Tomography (OCT) Quantifies Subcellular Contributions to Outer Retinal Band 4. Transl. Vis Sci. Technol. 2021; 10(3): 30. with license permissions obtained from Creative Commons; Creative Commons Attribution 4.0 International License (CC BY 4.0, https://creativecommons.org/licenses/by/4.0/legalcode accessed on 1 August 2022).
Figure 2
Figure 2
Adaptive optics technology system with Shack–Harmann wavefront sensor (SHWS) and deformable mirror schematic. SHWS utilizes a small lenslet array and samples a wavefront; displacements due to aberrations can drive a corrector (e.g., deformable mirror). This technology can help to visualize individual cells in the human retina [42,45]. Reprinted with permission from Jonnal et al. [45]. A Review of Adaptive Optics Optical Coherence Tomography: Technical Advances, Scientific Applications, and the Future. Invest Ophthalmol. Vis Sci. 2016; 57(9): OCT51-68 with license permissions obtained from Creative Commons; Creative Commons Attribution-Non-Commercial-No Derivatives 4.0 International (CC BY-NC-ND 4.0, https://creativecommons.org/licenses/by-nc-nd/4.0/legalcode (accessed on 1 August 2022)).
Figure 3
Figure 3
Adaptive optics (AO) OCT showcasing cellular structures of the retina. Yellow 1.5 × 1.5 box in (A) (Spectralis scanning laser ophthalmoscope) showcases location imaged by AO-OCT. (B) 3D AO-OCT with layers and green dotted line showcases the cross-section of the retina in (C) with yellow arrow highlighting ganglion cell layer soma. (DG) Different layers of the retina (internal limiting membrane, nerve fiber layer, ganglion cell layer, and inner plexiform layer). (D) Red arrow shows astrocyte/microglial cells. (E) Blue arrow shows nerve fiber webs. (F) Red arrow shows large soma, yellow arrow shows ganglion cell layer soma, blue and white arrows show edges of vessel walls. (G) Synaptic connections in the internal plexiform layer. Reprinted with permission from Liu et al. [50]. Imaging and quantifying ganglion cells and other transparent neurons in the living human retina. Proc. Natl. Acad. Sci. USA 2017; 114(48): 12803-8 with license permissions obtained from Creative Commons; Creative Commons Attribution-Non-Commercial-No Derivatives 4.0 International (CC BY-NC-ND 4.0, https://creativecommons.org/licenses/by-nc-nd/4.0/legalcode (accessed on 1 August 2022)).
Figure 4
Figure 4
Polarization-sensitive optical coherence tomography (PS-OCT). (A) Three-figure panel showcases a comparison of PS-OCT (top middle) and SD-OCT (top right) where both modalities are able to identify retinal pigment epithelium atrophy. (B) Three-figure panel showcases a comparison of PS-OCT (bottom middle) and SD-OCT (bottom right) where PS-OCT can more clearly identify the retinal pigment epithelium atrophy. Reprinted with permission from Schütze, C et al. Polarisation-sensitive OCT is useful for evaluating retinal pigment epithelial lesions in patients with neovascular AMD. British Journal of Ophthalmology 2016; 100: 371–377 with license permissions obtained from Creative Commons; Attribution-NonCommercial 4.0 International (CC BY-NC 4.0, https://creativecommons.org/licenses/by-nc/4.0/legalcode (accessed on 1 August 2022)).
Figure 5
Figure 5
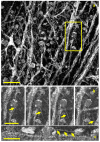
Full-field optical coherence tomography (FF-OCT) imaging the human retina. (a) The en face view of the human nerve fiber layer (scale bar is 500 μm). (b) A four-panel image of a 2 μm thick axon (yellow arrow) moving away from a ganglion cell soma. (c) A cross-section the same cell in (b) along the length of the axon (scale bar is 50 μm). Reprinted with permission from Grieve et al. [25]. Appearance of the Retina With Full-Field Optical Coherence Tomography. Invest. Ophthalmol. Vis. Sci. 2016; 57(9): OCT96–OCT104 with license permissions obtained from Creative Commons; Creative Commons Attribution-NonCommercial-NoDerivatives 4.0 International (CC BY-NC-ND 4.0, https://creativecommons.org/licenses/by-nc-nd/4.0/legalcode (accessed on 1 August 2022)).
Figure 6
Figure 6
Ultrawide-field optical coherence tomography (UWF-OCT) Image. (A) Horizonal scan image (23 mm in length). (B) showcases vertical scan (20 mm in length). Reprinted with permission from Takahashi et al. [28]. Ultra-Widefield Optical Coherence Tomographic Imaging of Posterior Vitreous in Eyes With High Myopia. Am J Ophthalmol. 2019; 206: 102-12. with license permissions obtained from Elsevier and Copyright Clearance Center.
Figure 7
Figure 7
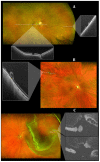
Integrated scanning laser ophthalmoscope and ultra-widefield imaging for peripheral optical coherence tomography with Optos’ Silverstone swept-source optical coherence tomography (Optos PLC, Dunfermline, UK). (A) A peripheral atrophic retinal hole (right rectangle) and macular hole (lower rectangle). (B) A cystic retinal tuft in the peripheral retina. (C) A retinal detachment in the peripheral retina. Reprinted with permission from Sodhi et al. [96]. Feasibility of peripheral OCT imaging using a novel integrated SLO ultra-widefield imaging swept-source OCT device. Int Ophthalmol 2021; 41(8): 2805-15 with license permissions obtained from Creative Commons; Creative Commons Attribution 4.0 International License (CC BY 4.0, https://creativecommons.org/licenses/by/4.0/legalcode (accessed on 1 August 2022)).
Figure 8
Figure 8
Intraoperative OCT with portable mounted microscope (circled) by Ehlers et al. [115]. Reprinted with permission from Ehlers et al. The Prospective Intraoperative and Perioperative Ophthalmic ImagiNg with Optical CoherEncE TomogRaphy (PIONEER) Study: 2-year results. Am J Ophthalmol. 2014 Nov; 158(5): 999–1007 with license permissions obtained from Elsevier and Copyright Clearance Center.
Figure 9
Figure 9
Retinal detachment visualized by intraoperative OCT. Dashed arrow shows hyperreflective retina and perfluorocarbon liquid interface, arrowhead shows outer retinal corrugations, and solid arrow shows persistent subretinal fluid. Reprinted with permission from Ehlers et al. [115]. The Prospective Intraoperative and Perioperative Ophthalmic ImagiNg with Optical CoherEncE TomogRaphy (PIONEER) Study: 2-year results. Am J Ophthalmol. 2014 Nov; 158(5): 999–1007 with license permissions obtained from Elsevier and Copyright Clearance Center.

References

    1. Huang D., Swanson E.A., Lin C.P., Schuman J.S., Stinson W.G., Chang W., Hee M.R., Flotte T., Gregory K., Puliafito C.A., et al. Optical coherence tomography. Science. 1991;254:1178–1181. doi: 10.1126/science.1957169. - DOI - PMC - PubMed
    1. Stahl A. The Diagnosis and Treatment of Age-Related Macular Degeneration. Dtsch Arztebl Int. 2020;117:513–520. doi: 10.3238/arztebl.2020.0513. - DOI - PMC - PubMed
    1. Semeraro F., Morescalchi F., Russo A., Gambicorti E., Pilotto A., Parmeggiani F., Bartollino S., Costagliola C. Central Serous Chorioretinopathy: Pathogenesis and Management. Clin. Ophthalmol. 2019;13:2341–2352. doi: 10.2147/OPTH.S220845. - DOI - PMC - PubMed
    1. Boned-Murillo A., Albertos-Arranz H., Diaz-Barreda M.D., Orduna-Hospital E., Sánchez-Cano A., Ferreras A., Cuenca N., Pinilla I. Optical Coherence Tomography Angiography in Diabetic Patients: A Systematic Review. Biomedicines. 2021;10:88. doi: 10.3390/biomedicines10010088. - DOI - PMC - PubMed
    1. Majumdar S., Tripathy K. StatPearls. StatPearls; Treasure Island, FL, USA: 2022. Macular Hole. - PubMed

LinkOut - more resources