Review
. 2022 Sep 1;11(17):5185.
doi: 10.3390/jcm11175185.

Systematic Review of Risk Factors Assessed in Predictive Scoring Tools for Drug-Related Problems in Inpatients

Affiliations
Review

Systematic Review of Risk Factors Assessed in Predictive Scoring Tools for Drug-Related Problems in Inpatients

Lea Jung-Poppe et al. J Clin Med. .

Abstract

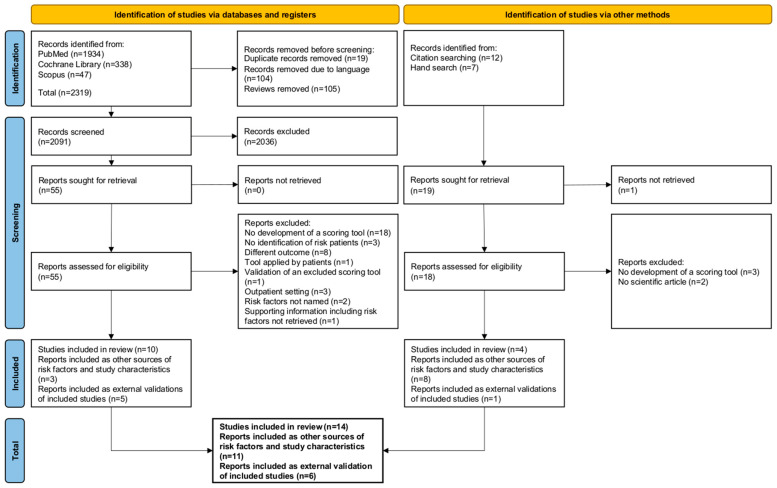
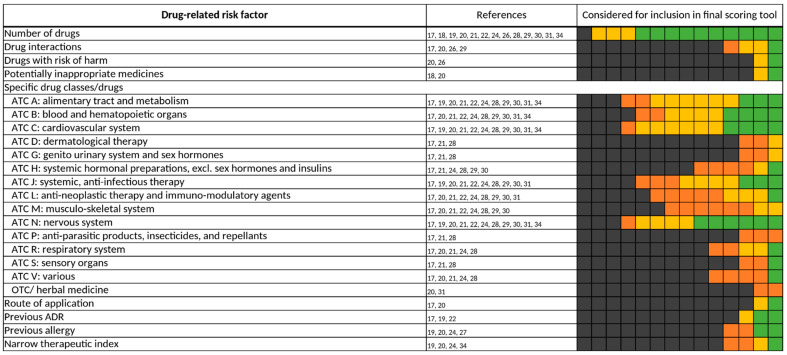
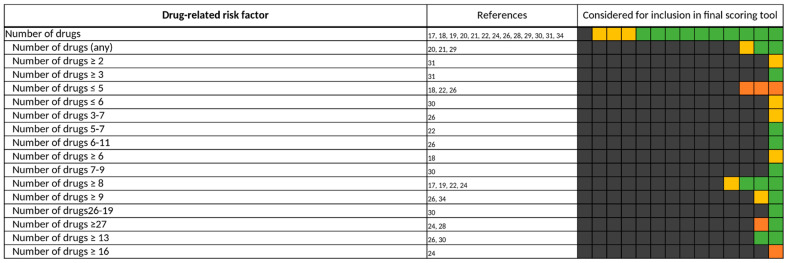
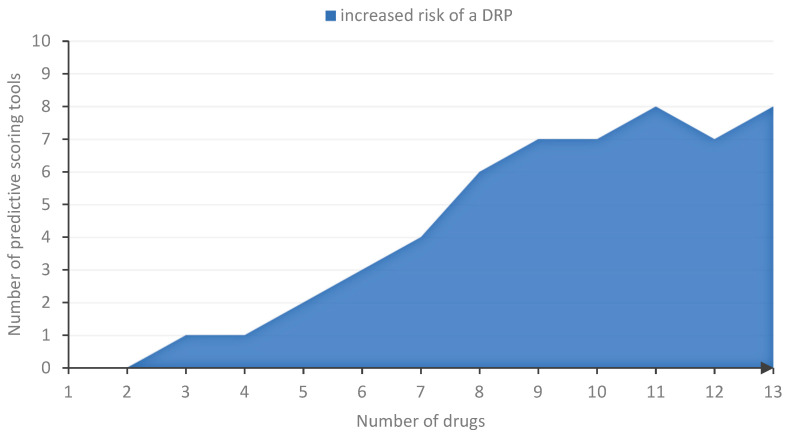
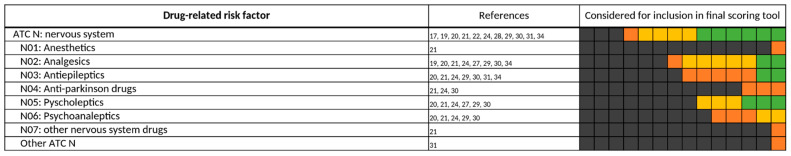
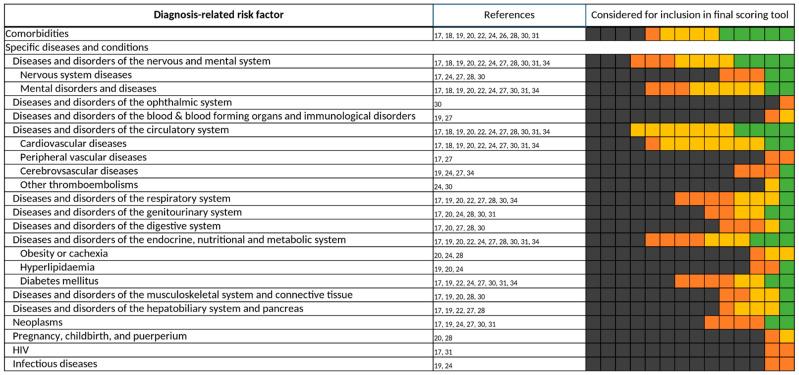
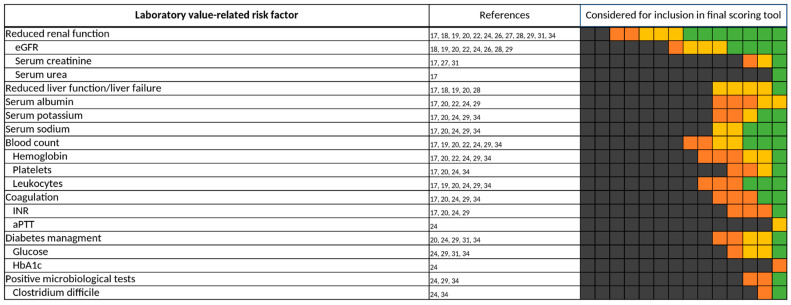
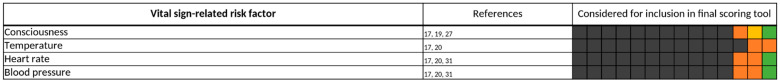
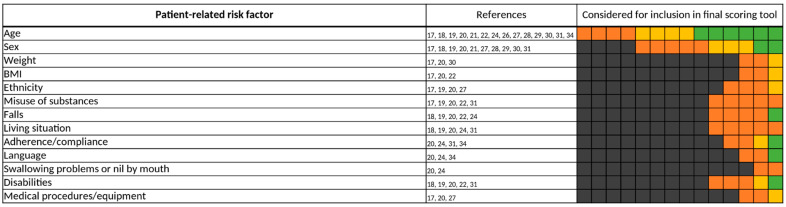
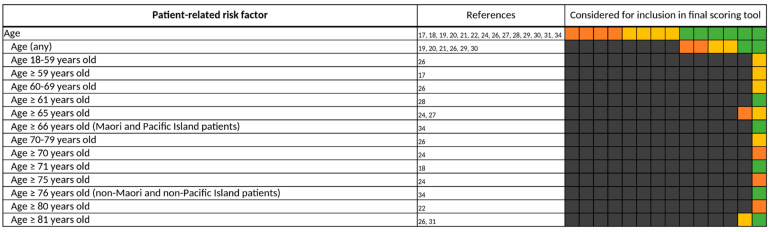
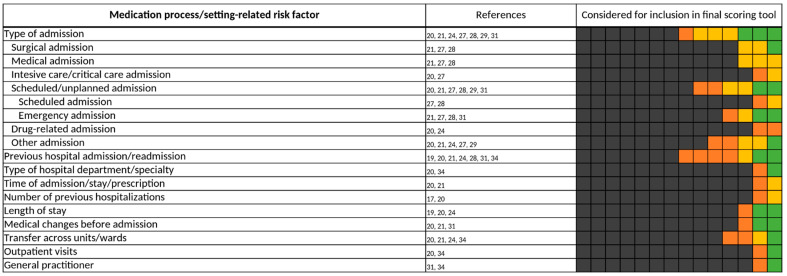
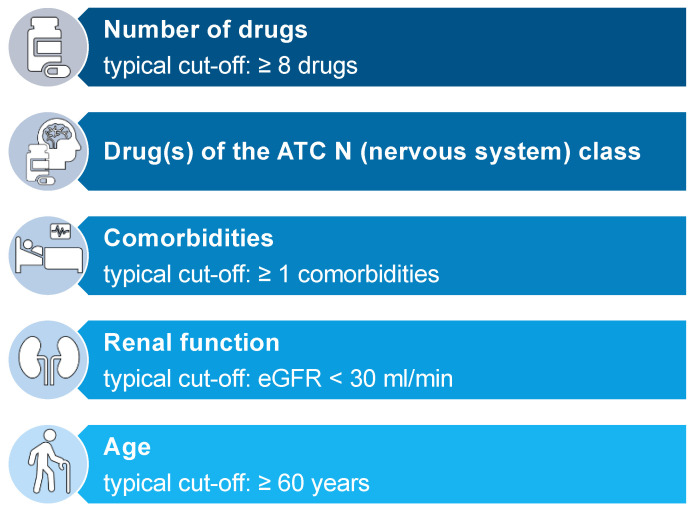
Drug-related problems (DRP, defined as adverse drug events/reactions and medication errors) are a common threat for patient safety. With the aim to aid improved allocation of specialist resources and to improve detection and prevention of DRP, numerous predictive scoring tools have been proposed. The external validation and evidence for the transferability of these tools still faces limitations. However, the proposed scoring tools include partly overlapping sets of similar factors, which may allow a new approach to estimate the external usability and validity of individual risk factors. Therefore, we conducted this systematic review and analysis. We identified 14 key studies that assessed 844 candidate risk factors for inclusion into predictive scoring tools. After consolidation to account for overlapping terminology and variable definitions, we assessed each risk factor in the number of studies it was assessed, and, if it was found to be a significant predictor of DRP, whether it was included in a final scoring tool. The latter included intake of ≥ 8 drugs, drugs of the Anatomical Therapeutic Chemical (ATC) class N, ≥1 comorbidity, an estimated glomerular filtration rate (eGFR) <30 mL/min and age ≥60 years. The methodological approach and the individual risk factors presented in this review may provide a new starting point for improved risk assessment.

Keywords: adverse drug events; adverse drug reactions; clinical pharmacology; clinical pharmacy; drug-related problems; medication errors; predictive scoring tool; risk assessment; risk factors; risk score.


Conflict of interest statement

The authors declare no conflict of interest. The funders had no role in the design of the study, the data collection, the analyses, the interpretation of data, the writing of the manuscript and the decision to publish the results.

Figures

Figure 1
Figure 1
Schematic presentation of risk factors in the form of a color-coded table. Each of the 14 boxes represents one of the included studies. The color of the boxes portrays whether a risk factor was not investigated in a study (gray), was investigated (orange), was significant in a first statistical analysis or based on expert consensus and therefore tested for inclusion in a final scoring tool (yellow), or whether a risk factor was included in a final scoring tool (green). The “citations”-column lists each study that at least investigated the respective risk factor.
Figure 2
Figure 2
Study selection process displayed as a PRISMA flow diagram.
Figure 3
Figure 3
Drug-related risk factors. Specific drugs and drug classes were assigned according to their respective Anatomical Therapeutic Chemical (ATC) Classification System codes. ADR, adverse drug reaction; OTC, over-the-counter. Each of the 14 boxes represents one of the included studies. The color of the boxes portrays whether a risk factor was not investigated in a study (gray), was investigated (orange), was significant in a first statistical analysis or based on expert consensus and therefore tested for inclusion in a final scoring tool (yellow), or whether a risk factor was included in a final scoring tool (green). The “citations”-column lists each study that at least investigated the respective risk factor.
Figure 4
Figure 4
All different thresholds investigated by the authors of the included studies for “number of drugs”. Each of the 14 boxes represents one of the included studies. The color of the boxes portrays whether a risk factor was not investigated in a study (gray), was investigated (orange), was significant in a first statistical analysis or based on expert consensus and therefore tested for inclusion in a final scoring tool (yellow), or whether a risk factor was included in a final scoring tool (green). The “citations”-column lists each study that at least investigated the respective risk factor.
Figure 5
Figure 5
Thresholds associated with an increased risk of DRP based on number of drugs. For every number of drugs, we determined the number of final scoring tools that covered that number by their included threshold for “number of drugs”.
Figure 6
Figure 6
Drug classes of the ATC N (nervous system) class. Each of the 14 boxes represents one of the included studies. The color of the boxes portrays whether a risk factor was not investigated in a study (gray), was investigated (orange), was significant in a first statistical analysis or based on expert consensus and therefore tested for inclusion in a final scoring tool (yellow), or whether a risk factor was included in a final scoring tool (green). The “citations”-column lists each study that at least investigated the respective risk factor.
Figure 7
Figure 7
Diagnosis-related risk factors. Specific diseases and conditions were assigned according to their respective Major Diagnostic Categories (MDC). Each of the 14 boxes represents one of the included studies. The color of the boxes portrays whether a risk factor was not investigated in a study (gray), was investigated (orange), was significant in a first statistical analysis or based on expert consensus and therefore tested for inclusion in a final scoring tool (yellow), or whether a risk factor was included in a final scoring tool (green). The “citations”-column lists each study that at least investigated the respective risk factor.
Figure 8
Figure 8
Laboratory value-related risk factors. Each of the 14 boxes represents one of the included studies. The color of the boxes portrays whether a risk factor was not investigated in a study (gray), was investigated (orange), was significant in a first statistical analysis or based on expert consensus and therefore tested for inclusion in a final scoring tool (yellow), or whether a risk factor was included in a final scoring tool (green). The “citations”-column lists each study that at least investigated the respective risk factor.
Figure 9
Figure 9
Vital sign-related risk factors. Each of the 14 boxes represents one of the included studies. The color of the boxes portrays whether a risk factor was not investigated in a study (gray), was investigated (orange), was significant in a first statistical analysis or based on expert consensus and therefore tested for inclusion in a final scoring tool (yellow), or whether a risk factor was included in a final scoring tool (green). The “citations”-column lists each study that at least investigated the respective risk factor.
Figure 10
Figure 10
Patient-related risk factors. Each of the 14 boxes represents one of the included studies. The color of the boxes portrays whether a risk factor was not investigated in a study (gray), was investigated (orange), was significant in a first statistical analysis or based on expert consensus and therefore tested for inclusion in a final scoring tool (yellow), or whether a risk factor was included in a final scoring tool (green). The “citations”-column lists each study that at least investigated the respective risk factor.
Figure 11
Figure 11
All different thresholds investigated by the authors of the included studies for “age”. Each of the 14 boxes represents one of the included studies. The color of the boxes portrays whether a risk factor was not investigated in a study (gray), was investigated (orange), was significant in a first statistical analysis or based on expert consensus and therefore tested for inclusion in a final scoring tool (yellow), or whether a risk factor was included in a final scoring tool (green). The “citations”-column lists each study that at least investigated the respective risk factor.
Figure 12
Figure 12
Medication process/setting-related risk factors. Each of the 14 boxes represents one of the included studies. The color of the boxes portrays whether a risk factor was not investigated in a study (gray), was investigated (orange), was significant in a first statistical analysis or based on expert consensus and therefore tested for inclusion in a final scoring tool (yellow), or whether a risk factor was included in a final scoring tool (green). The “citations”-column lists each study that at least investigated the respective risk factor.
Figure 13
Figure 13
Five most frequently investigated risk factors and their respective typical cut-off values.

Similar articles

Cited by

References

    1. Schurig A.M., Böhme M., Just K.S., Scholl C., Dormann H., Plank-Kiegele B., Seufferlein T., Gräff I., Schwab M., Stingl J.C. Adverse Drug Reactions (ADR) and Emergencies. Dtsch. Ärzteblatt Int. 2018;115:251–258. doi: 10.3238/arztebl.2018.0251. - DOI - PMC - PubMed
    1. Classen D.C., Pestotnik S.L., Evans R.S., Lloyd J.F., Burke J.P. Adverse drug events in hospitalized patients. Excess length of stay, extra costs, and attributable mortality. JAMA. 1997;277:301–306. doi: 10.1001/jama.1997.03540280039031. - DOI - PubMed
    1. Meier F., Maas R., Sonst A., Patapovas A., Müller F., Plank-Kiegele B., Pfistermeister B., Schöffski O., Bürkle T., Dormann H. Adverse drug events in patients admitted to an emergency department: An analysis of direct costs. Pharmacoepidemiol. Drug Saf. 2015;24:176–186. doi: 10.1002/pds.3663. - DOI - PubMed
    1. Krähenbühl-Melcher A., Schlienger R., Lampert M., Haschke M., Drewe J.R., Krähenbühl S. Drug-related problems in hospitals: A review of the recent literature. Drug Saf. 2007;30:379–407. doi: 10.2165/00002018-200730050-00003. - DOI - PubMed
    1. Van Den Bemt P.M.L.A., Egberts T.C.G., De Jong-Van Den Berg L.T.W., Brouwers J.R.B.J. Drug-Related Problems in Hospitalised Patients. Drug Saf. 2000;22:321–333. doi: 10.2165/00002018-200022040-00005. - DOI - PubMed