. 2022 Aug 24;15(17):5843.
doi: 10.3390/ma15175843.

Reduced Graphene Oxide Modulates the FAK-Dependent Signaling Pathway in Glioblastoma Multiforme Cells In Vitro

Affiliations

Reduced Graphene Oxide Modulates the FAK-Dependent Signaling Pathway in Glioblastoma Multiforme Cells In Vitro

Jaroslaw Szczepaniak et al. Materials (Basel). .

Abstract

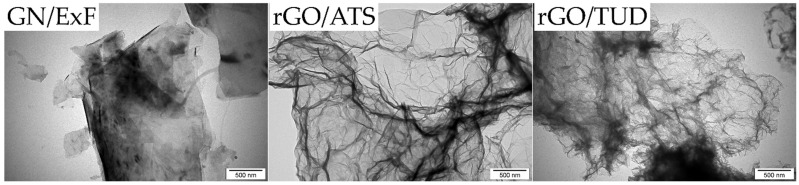
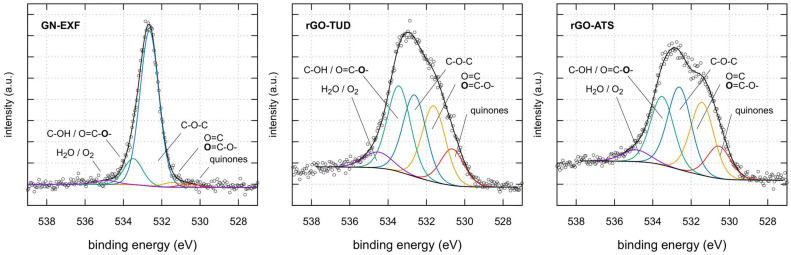
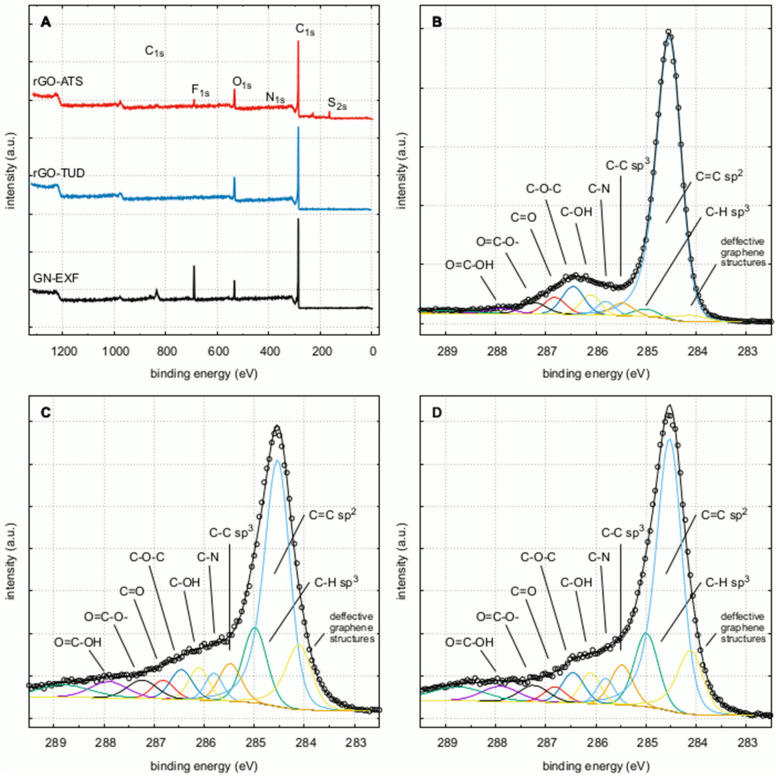
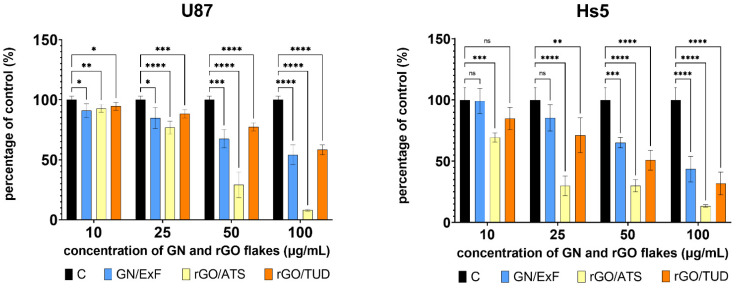
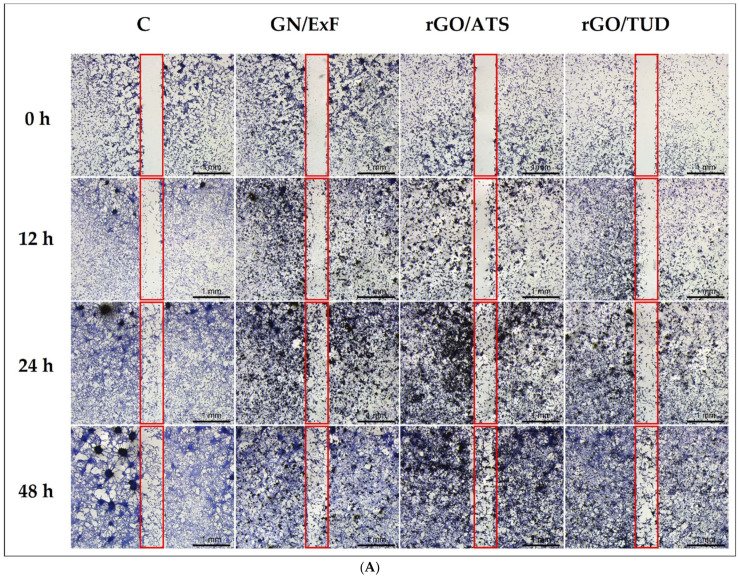
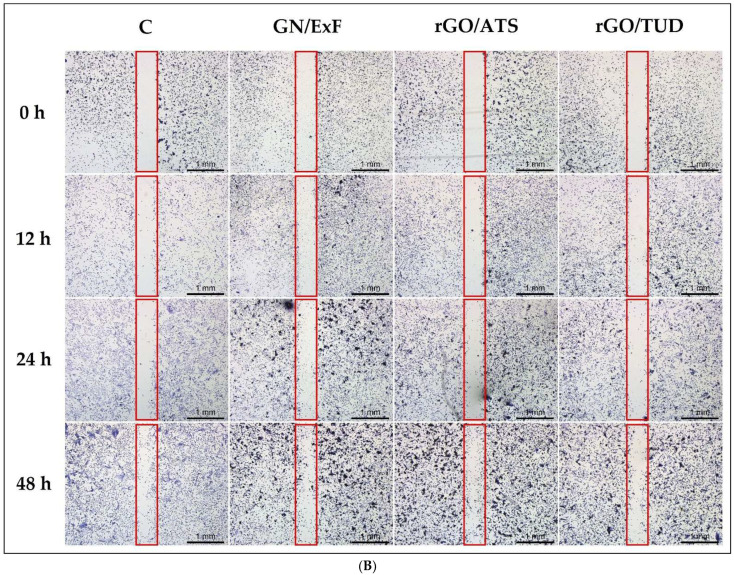
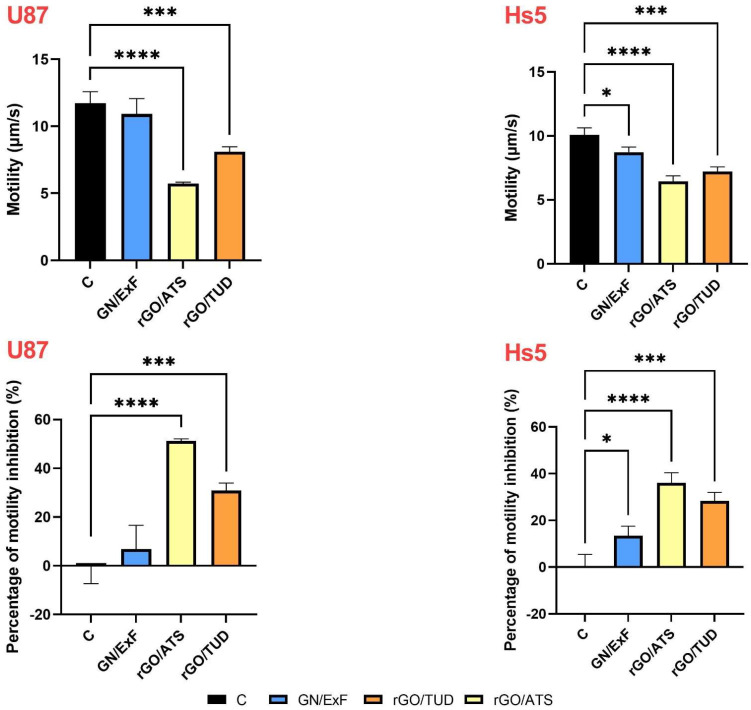
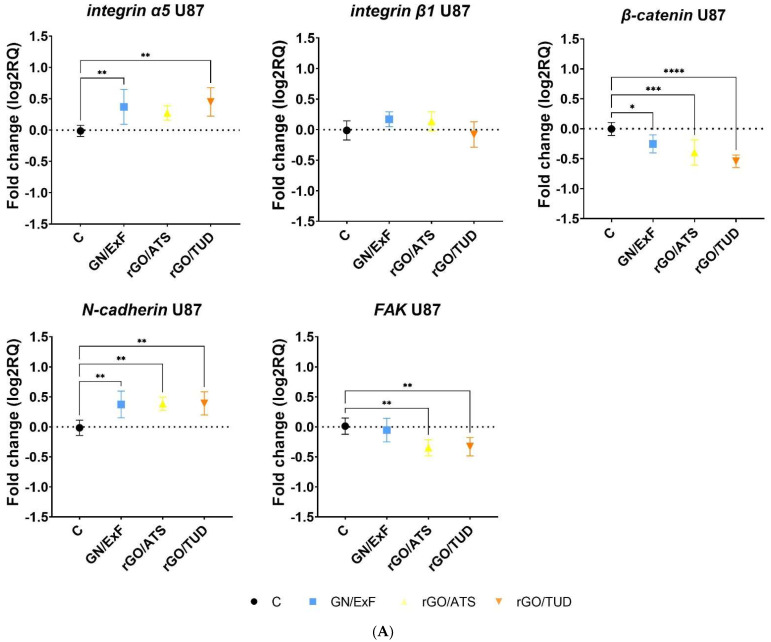
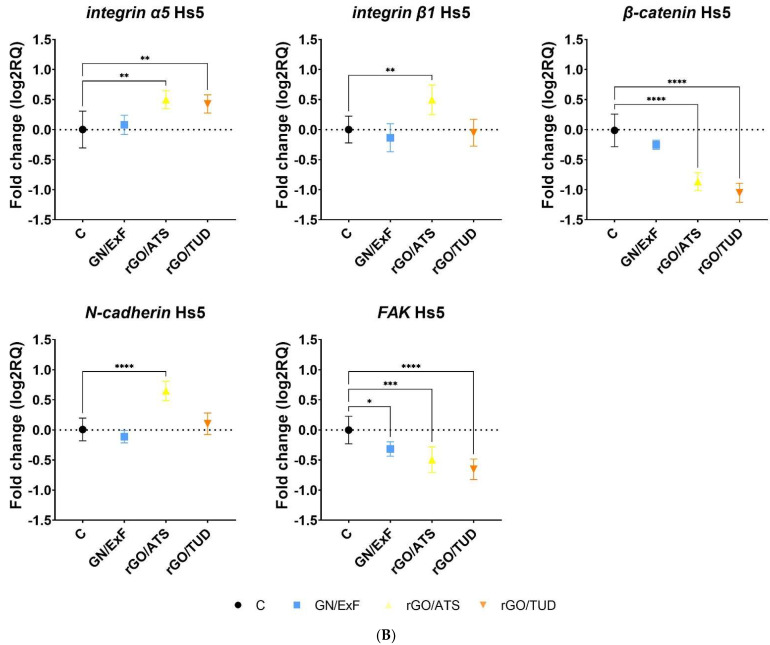
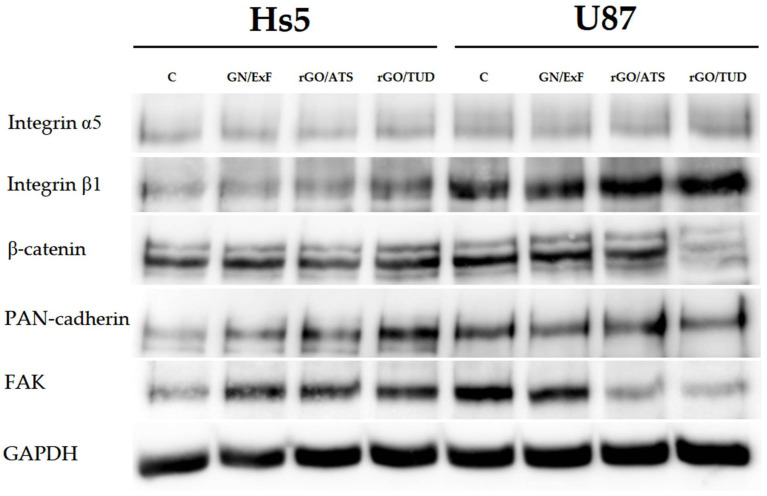
Aggressive invasiveness is a common feature of malignant gliomas, despite their high level of tumor heterogeneity and possible diverse cell origins. Therefore, it is important to explore new therapeutic methods. In this study, we evaluated and compared the effects of graphene (GN) and reduced graphene oxides (rGOs) on a highly invasive and neoplastic cell line, U87. The surface functional groups of the GN and rGO flakes were characterized by X-ray photoelectron spectroscopy. The antitumor activity of these flakes was obtained by using the neutral red assay and their anti-migratory activity was determined using the wound healing assay. Further, we investigated the mRNA and protein expression levels of important cell adhesion molecules involved in migration and invasiveness. The rGO flakes, particularly rGO/ATS and rGO/TUD, were found highly toxic. The migration potential of both U87 and Hs5 cells decreased, especially after rGO/TUD treatment. A post-treatment decrease in mobility and FAK expression was observed in U87 cells treated with rGO/ATS and rGO/TUD flakes. The rGO/TUD treatment also reduced β-catenin expression in U87 cells. Our results suggest that rGO flakes reduce the migration and invasiveness of U87 tumor cells and can, thus, be used as potential antitumor agents.

Keywords: FAK; U87 cell line; cell membrane receptors; cell mobility; glioblastoma; graphene; invasiveness; migration; reduced graphene oxide; β-catenin.


Conflict of interest statement

The authors declare no conflict of interest.

Figures

Figure A1
Figure A1
Transmission electron microscopy (TEM) images. Images of GN/ExF flakes and two types of rGO (rGO/ATS, and rGO/TUD). Abbreviations: rGO, reduced graphene oxide; GN, graphene. Notes: All necessary analyses regarding the characteristics of graphene and reduced graphene oxides (including TEM, SEM, FTIR, Raman, etc.) can be found in the works of Szczepaniak et al. 2018, 2021 [29,49].
Figure A2
Figure A2
XPS results: O1s high resolution spectra of GN/ExF, rGO/TUD and rGO/ATS.
Figure 1
Figure 1
X-ray photoelectron spectroscopy (XPS) results: survey spectra of GN/ExF, rGO/TUD, and rGO/ATS (A), C1s high-resolution spectra (HR) of GN-EXF (B), rGO-TUD (C), and rGO-ATS (D). Abbreviations: rGO, reduced graphene oxide; GN, graphene; C, control group (untreated group); ExF, exfoliation; ATS, ammonium thiosulphate; TUD, thiourea dioxide.
Figure 2
Figure 2
Cell viability of U87 and Hs5 cells treated and untreated with GN and rGO flakes, as evaluated by the neutral red assay. U87 and Hs5 cells were exposed to GN and rGO flakes at concentrations of 10, 25, 50, and 100 μg/mL for 24 h. Values are expressed as mean ± standard deviation. Statistical significance between the control and treated cells is indicated by an asterisk and was assessed using Bonferroni’s multiple comparison test. Differences with p < 0.05 were considered statistically significant. One asterisk (*) indicates p < 0.01, two asterisk (**) indicates p < 0.005, three asterisks (***) indicate p < 0.001, four asterisk (****) indicate p < 0.0001. Abbreviations: rGO, reduced graphene oxide; GN, graphene; C, control group (untreated group); ExF, exfoliation; ATS, ammonium thiosulphate; TUD, thiourea dioxide; ns, not significant.
Figure 3
Figure 3
Analysis of U87 (A) and Hs5 (B) cell invasion and migration after 0, 12, 24 and 48 h of cultivation. U87 and Hs5 cells were exposed to GN and rGO flakes at a concentration of 25 μg/mL. Notes: For better contrast, cells were fixed and stained with the May Grünwald–Giemsa method. The scratch area is marked with a red frame. Scale bar: 1 mm. Abbreviations: rGO, reduced graphene oxide; GN, graphene; C, control group (untreated group); ExF, exfoliation; ATS, ammonium thiosulphate; TUD, thiourea dioxide.
Figure 3
Figure 3
Analysis of U87 (A) and Hs5 (B) cell invasion and migration after 0, 12, 24 and 48 h of cultivation. U87 and Hs5 cells were exposed to GN and rGO flakes at a concentration of 25 μg/mL. Notes: For better contrast, cells were fixed and stained with the May Grünwald–Giemsa method. The scratch area is marked with a red frame. Scale bar: 1 mm. Abbreviations: rGO, reduced graphene oxide; GN, graphene; C, control group (untreated group); ExF, exfoliation; ATS, ammonium thiosulphate; TUD, thiourea dioxide.
Figure 4
Figure 4
Analysis of U87 and Hs5 cell motility (μm/s) and percentage of motility inhibition (%) in co-culture treated with graphene (GN) and reduced graphene oxide (rGO). Statistical significance between the control and treated cells is indicated by an asterisk and was assessed using Bonferroni’s multiple comparisons test. Differences with p < 0.05 were considered statistically significant. One asterisk (*) indicates p < 0.05, three asterisk (***) indicates p < 0.001 and four asterisk (****) indicate p < 0.0001. Abbreviations: rGO, reduced graphene oxide; GN, graphene; C, control group (untreated group); ExF, exfoliation; ATS, ammonium thiosulfate; TUD, thiourea dioxide. Notes: Cell mobility data were analyzed from three independent cultures. Within each co-culture, 100 cell pathways were analyzed in ImageJ using the TrackMate overlay. The average track duration and distance traveled were obtained from the 100 paths. Three independent means from 100 paths were used for statistical calculations.
Figure 5
Figure 5
Analysis of the mRNA expression levels of the integrin α5, integrin β1, β-catenin, N-cadherin, and FAK genes after GN and rGO treatment at 25 µg/mL concentration for 24 h in U87 (A) and Hs5 (B) cells. The results are calculated relative to the control values. Log2RQ (log2 relative quantitation) values for all genes are normalized to the housekeeping gene RPL13A. Statistical significance between the control and the treated cells is indicated by an asterisk and was assessed using Bonferroni’s multiple comparisons test. Differences with p < 0.05 were considered statistically significant. One asterisk (*) indicates p < 0.05, two asterisk (**) indicates p < 0.01, three asterisk (***) indicates p < 0.001 and four asterisks (****) indicate p < 0.0001. Abbreviations: rGO, reduced graphene oxide; GN, graphene; C, control group (untreated group); ExF, exfoliation; Term, thermal; ATS, ammonium thiosulfate; TUD, thiourea dioxide; rpl13a, ribosomal protein L13a; log2RQ, log2 relative quantitation.
Figure 5
Figure 5
Analysis of the mRNA expression levels of the integrin α5, integrin β1, β-catenin, N-cadherin, and FAK genes after GN and rGO treatment at 25 µg/mL concentration for 24 h in U87 (A) and Hs5 (B) cells. The results are calculated relative to the control values. Log2RQ (log2 relative quantitation) values for all genes are normalized to the housekeeping gene RPL13A. Statistical significance between the control and the treated cells is indicated by an asterisk and was assessed using Bonferroni’s multiple comparisons test. Differences with p < 0.05 were considered statistically significant. One asterisk (*) indicates p < 0.05, two asterisk (**) indicates p < 0.01, three asterisk (***) indicates p < 0.001 and four asterisks (****) indicate p < 0.0001. Abbreviations: rGO, reduced graphene oxide; GN, graphene; C, control group (untreated group); ExF, exfoliation; Term, thermal; ATS, ammonium thiosulfate; TUD, thiourea dioxide; rpl13a, ribosomal protein L13a; log2RQ, log2 relative quantitation.
Figure 6
Figure 6
Western blot analysis of integrin α5, integrin β1, β-catenin, PAN-cadherin, and FAK after GN and rGO treatment at 25 µg/mL concentration for 24 h in U87 and Hs5 cells. GAPDH was used as a loading control. Abbreviations: rGO, reduced graphene oxide; GN, graphene; C, control group (untreated group); ExF, exfoliation; term, thermal; ATS, ammonium thiosulfate; TUD, thiourea dioxide; GAPDH, glyceraldehyde 3-phosphate dehydrogenase.

Similar articles

Cited by

References

    1. Louis D.N. Molecular pathology of malignant gliomas. Annu. Rev. Pathol. Mech. Dis. 2006;1:97–117. doi: 10.1146/annurev.pathol.1.110304.100043. - DOI - PubMed
    1. Zhu Y., Parada L.F. The Molecular and Genetic Basis of Neurological Tumours. Nat. Cancer. 2002;2:616–626. doi: 10.1038/nrc866. - DOI - PubMed
    1. Stupp R., Mason W.P., van den Bent M.J., Weller M., Fisher B., Taphoorn M.J., Belanger K., Brandes A.A., Marosi C., Bogdahn U., et al. European Organisation for Research and Treatment of Cancer Brain Tumor and Radiotherapy Groups, National Cancer Institute of Canada W. Wu et al. Pharmacol. Res. 2021;171:10578017.
    1. Quail D.F., Joyce J.A. The Microenvironmental Landscape of Brain Tumors. Cancer Cell. 2017;31:326–341. doi: 10.1016/j.ccell.2017.02.009. - DOI - PMC - PubMed
    1. Verhaak R.G., Hoadley K.A., Purdom E., Wang V., Qi Y., Wilkerson M.D., Miller C.R., Ding L., Golub T., Mesirov J.P., et al. Cancer Genome Atlas Research Network. Integrated genomic analysis identifies clinically relevant subtypes of glioblastoma characterized by abnormalities in PDGFRA, IDH1, EGFR, and NF1. Cancer Cell. 2010;17:98–110. doi: 10.1016/j.ccr.2009.12.020. - DOI - PMC - PubMed

LinkOut - more resources