. 2022 Sep 3;14(17):3648.
doi: 10.3390/nu14173648.

Comparative Proteomic Analysis of Proteins in Breast Milk during Different Lactation Periods

Affiliations

Comparative Proteomic Analysis of Proteins in Breast Milk during Different Lactation Periods

Yifan Zhang et al. Nutrients. .

Abstract

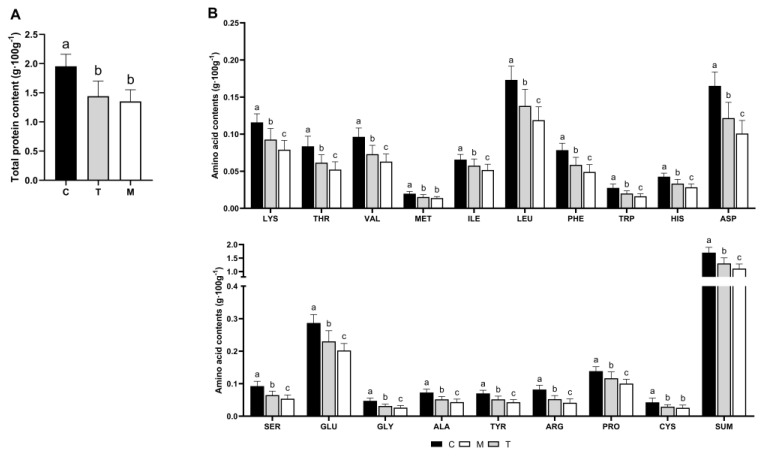
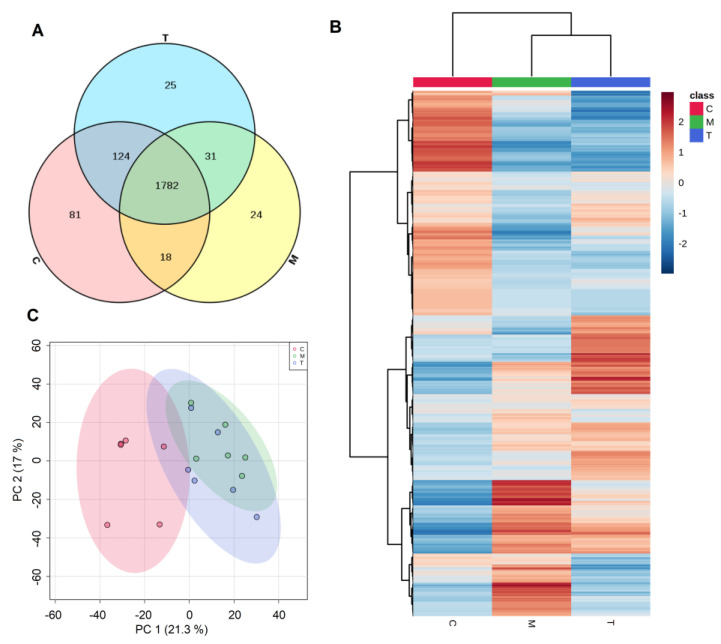
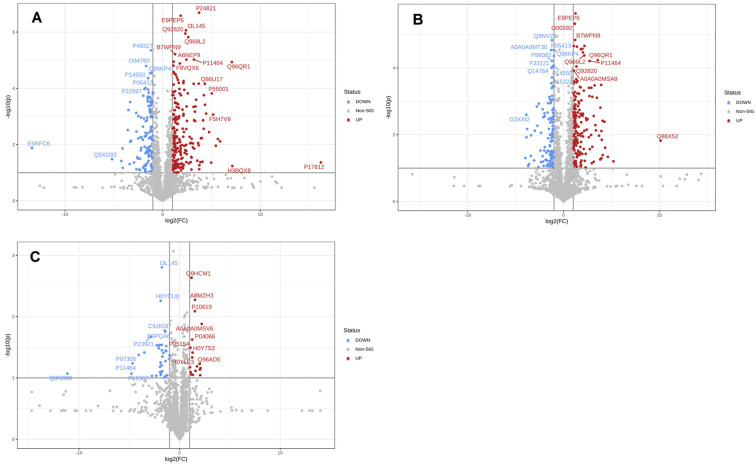
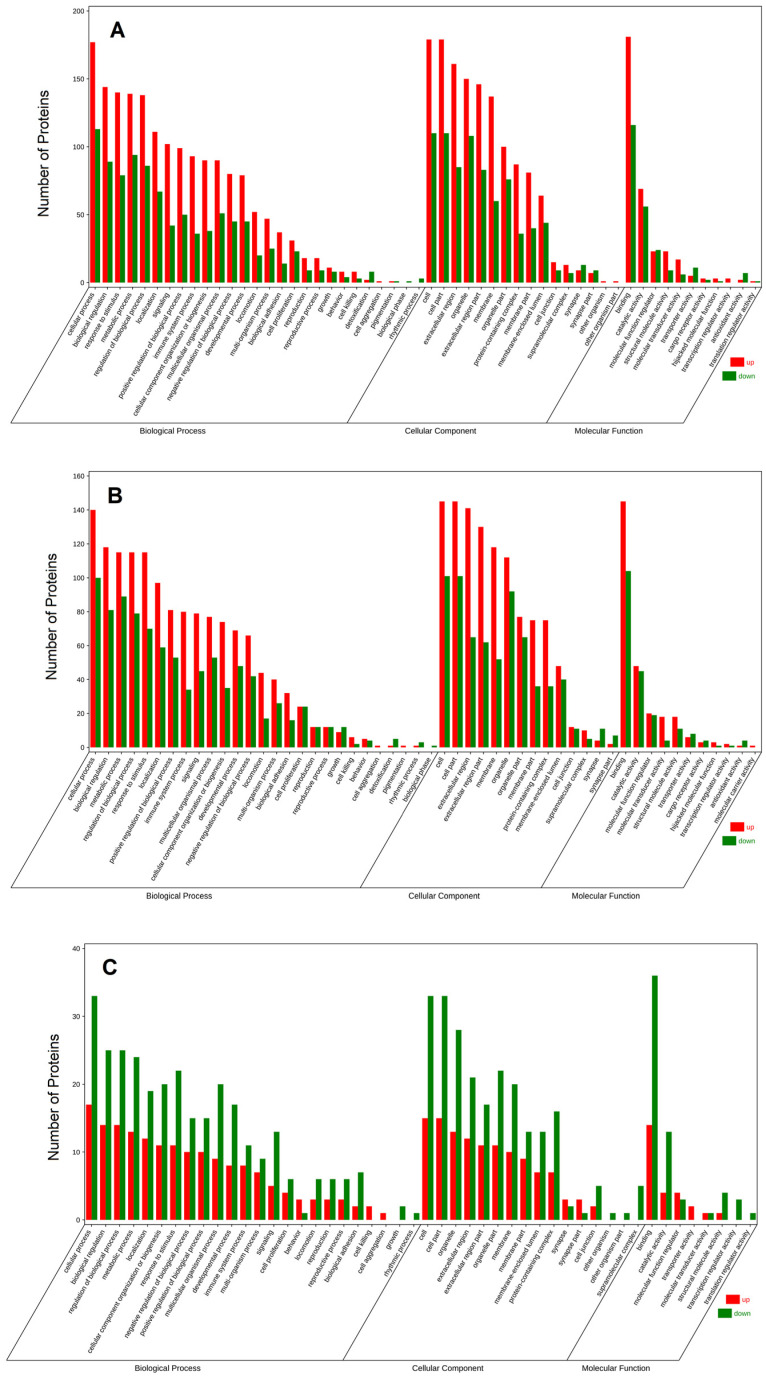
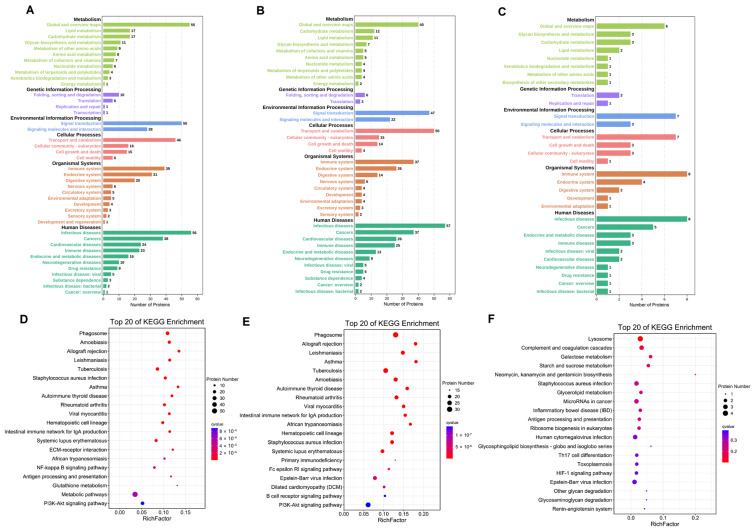
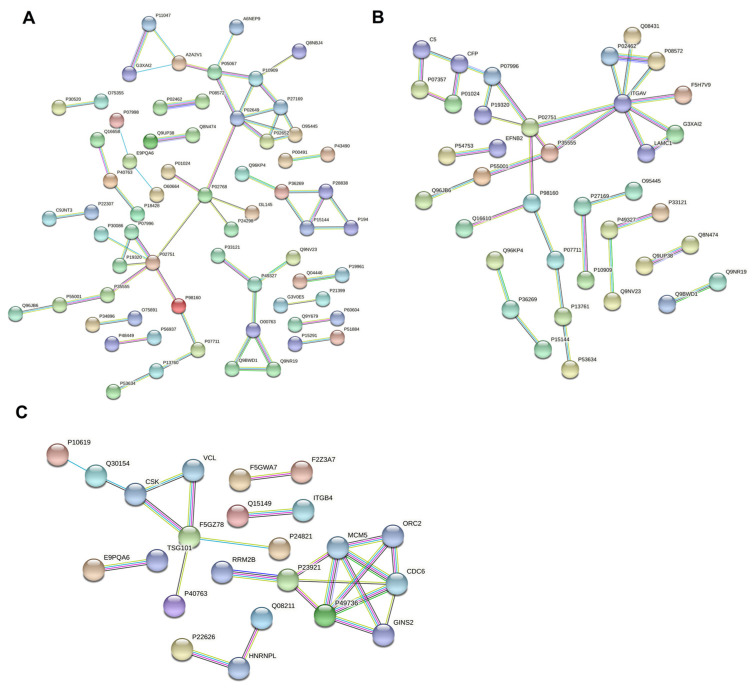
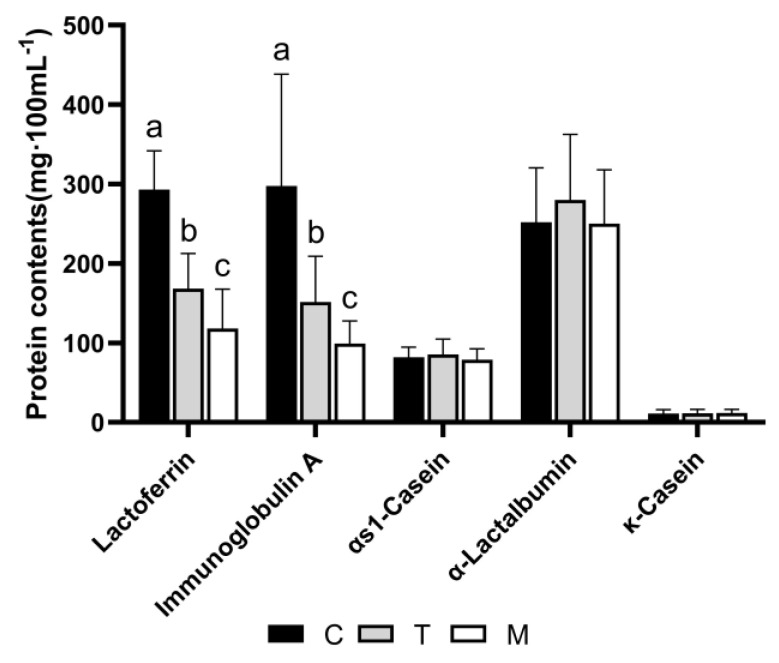
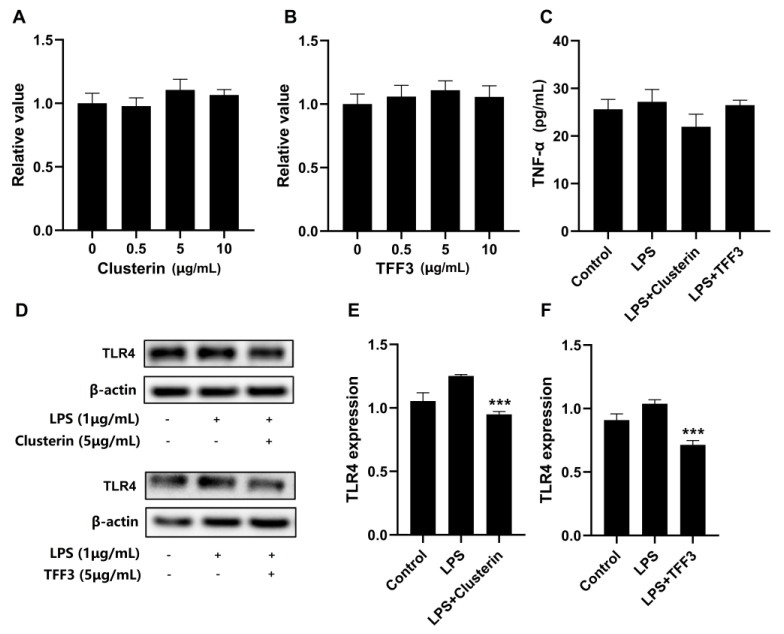
Breast milk is an unparalleled food for infants, as it can meet almost all of their nutritional needs. Breast milk in the first month is an important source of acquired immunity. However, breast milk protein may vary with the stage of lactation. Therefore, the aim of this study was to use a data-independent acquisition approach to determine the differences in the proteins of breast milk during different lactation periods. The study samples were colostrum (3-6 days), transitional milk (7-14 days), and mature milk (15-29 days). The results identified a total of 2085 different proteins, and colostrum contained the most characteristic proteins. Protein expression was affected by the lactation stage. The proteins expressed in breast milk changed greatly between day 3 and day 14 and gradually stabilized after 14 days. The expression levels of lactoferrin, immunoglobulin, and clusterin were the highest in colostrum. CTP synthase 1, C-type lectin domain family 19 member A, secretoglobin family 3A member 2, trefoil factor 3 (TFF3), and tenascin were also the highest in colostrum. This study provides further insights into the protein composition of breast milk and the necessary support for the design and production of infant formula.

Keywords: bioactive protein; breast milk; lactation periods; proteomic analysis.


Conflict of interest statement

The authors declare no conflict of interest.

Figures

Figure 1
Figure 1
Comparison of total protein contents and amino acid contents in different lactation periods. Different letters represent significant differences in total protein contents in different lactation periods (p < 0.05); C, colostrum (3–6 days); T, transitional milk (7–14 days); M, mature milk (15–29 days) (A) total protein contents. (B) total amino acid contents.
Figure 2
Figure 2
(A) Venn diagram analysis (B) hierarchical clustering; (C) Principal component analysis (PCA) score plot; C, colostrum (3–6 days); T, transitional milk (7–14 days); M, mature milk (15–29 days).
Figure 3
Figure 3
Differential expression of proteins between groups. Volcano plot showing the significance versus fold change in C vs. M (A), C vs. T (B), and M vs. T (C). Down-regulated proteins are shown in red, and up-regulated proteins are shown in blue.
Figure 4
Figure 4
GO annotation of differentially expressed proteins in C vs. M (A), C vs. T (B), and M vs. T (C).
Figure 5
Figure 5
Analysis of differentially expressed proteins in C vs. M (A), C vs. T (B), and M vs. T (C) in KEGG pathway. Top 20 of KEGG enrichment pathway in C vs. M (D), C vs. T (E), and M vs. T (F). The size of the dot represents the number of differential proteins annotated to the pathway. The color of the dot represents the size of the P value.
Figure 6
Figure 6
Protein–protein interaction network analysis of differentially expressed proteins in C vs. M (A), C vs. T (B), and M vs. T (C). Each node represents a protein, and each edge represents the interaction between proteins.
Figure 7
Figure 7
The concentrations of lactoferrin, immunoglobulin A, αs1−casein, α−Lactalbumin, and κ−casein in three different lactation periods. Different letters represent significant differences in protein contents in different lactation periods (p < 0.05).
Figure 8
Figure 8
Inhibitory effect of clusterin and TFF3 macrophage inflammation in RAW264.7 cells (A,B) RAW264.7 cells treated with clusterin or TFF3 (0, 0.5, 5, 10 μg/mL) for 8 h. The cell viability was detected using Cell−Counting−Kit−8 (C) RAW264.7 cells were pretreated with clusterin or TFF3 (5 μg/mL) for 8 h after co−incubation with LPS (1 μg/mL) for 8 h. The TNF−α level was detected using ELISA kits. (DF) RAW264.7 cells treated with clusterin or TFF3 (5 μg/mL) for 8 h after incubating with LPS (1 μg/mL) for 8 h. The expression of TLR4 was detected using Western blotting. *** p < 0.001 versus the LPS induced group.

References

    1. Martin C.R., Ling P.R., Blackburn G.L. Review of Infant Feeding: Key Features of Breast Milk and Infant Formula. Nutrients. 2016;8:279. doi: 10.3390/nu8050279. - DOI - PMC - PubMed
    1. Eidelman A.I. Breastfeeding and the Use of Human Milk: An Analysis of the American Academy of Pediatrics 2012 Breastfeeding Policy Statement. Breastfeed. Med. 2012;7:323–324. doi: 10.1089/bfm.2012.0067. - DOI - PubMed
    1. Ho N.T., Li F., Lee-Sarwar K.A., Tun H.M., Brown B.P., Pannaraj P.S., Bender J.M., Azad M.B., Thompson A.L., Weiss S.T., et al. Meta-analysis of effects of exclusive breastfeeding on infant gut microbiota across populations. Nat. Commun. 2018;9:4169. doi: 10.1038/s41467-018-06473-x. - DOI - PMC - PubMed
    1. Jackson K.M., Nazar A.M. Breastfeeding, the immune response, and long-term health. J. Am. Osteopath. Assoc. 2006;106:203–207. - PubMed
    1. Isaacs E.B., Fischl B.R., Quinn B.T., Chong W.K., Gadian D.G., Lucas A. Impact of breast milk on intelligence quotient, brain size, and white matter development. Pediatr. Res. 2010;67:357–362. doi: 10.1203/PDR.0b013e3181d026da. - DOI - PMC - PubMed

LinkOut - more resources