Review
. 2022 Aug 31;12(17):3023.
doi: 10.3390/nano12173023.

Iron-Based Hollow Nanoplatforms for Cancer Imaging and Theranostics

Affiliations
Review

Iron-Based Hollow Nanoplatforms for Cancer Imaging and Theranostics

Shun Luo et al. Nanomaterials (Basel). .

Abstract

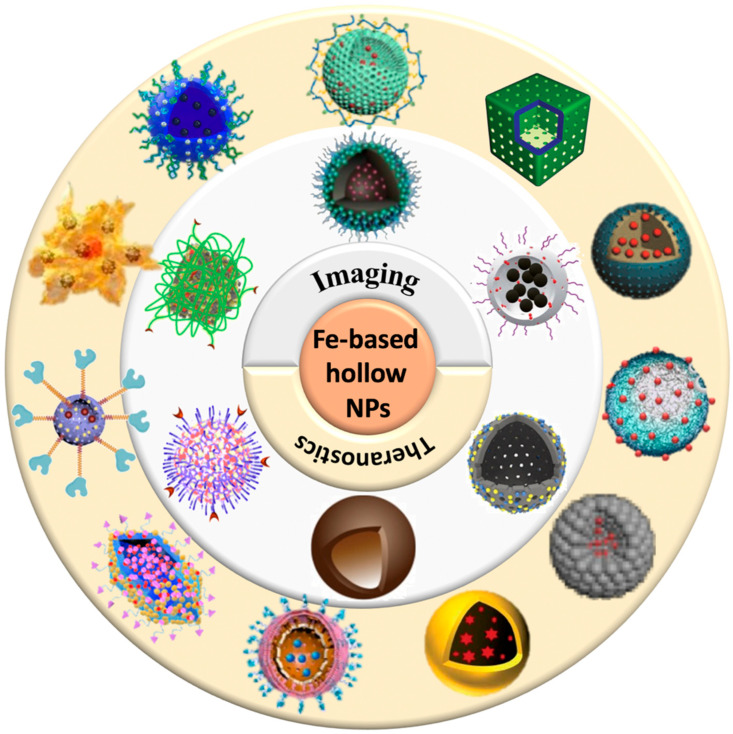
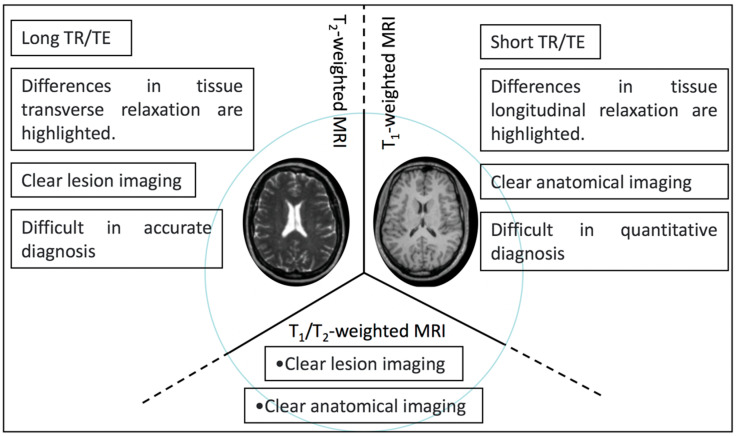
Over the past decade, iron (Fe)-based hollow nanoplatforms (Fe-HNPs) have attracted increasing attention for cancer theranostics, due to their high safety and superior diagnostic/therapeutic features. Specifically, Fe-involved components can serve as magnetic resonance imaging (MRI) contrast agents (CAs) and Fenton-like/photothermal/magnetic hyperthermia (MTH) therapy agents, while the cavities are able to load various small molecules (e.g., fluorescent dyes, chemotherapeutic drugs, photosensitizers, etc.) to allow multifunctional all-in-one theranostics. In this review, the recent advances of Fe-HNPs for cancer imaging and treatment are summarized. Firstly, the use of Fe-HNPs in single T1-weighted MRI and T2-weighted MRI, T1-/T2-weighted dual-modal MRI as well as other dual-modal imaging modalities are presented. Secondly, diverse Fe-HNPs, including hollow iron oxide (IO) nanoparticles (NPs), hollow matrix-supported IO NPs, hollow Fe-complex NPs and hollow Prussian blue (PB) NPs are described for MRI-guided therapies. Lastly, the potential clinical obstacles and implications for future research of these hollow Fe-based nanotheranostics are discussed.

Keywords: iron-based hollow nanoplatforms; magnetic resonance imaging; multifunctional; theranostics.


Conflict of interest statement

The authors declare no conflict of interest.

Figures

Scheme 1
Scheme 1
Schematic illustration of various Fe-HNPs for cancer imaging and theranostics.
Figure 1
Figure 1
(A) Transmission electron microscopy (TEM) images and high-resolution TEM (HRTEM) images (inset) of HPIOs-21 (i), HPIOs-14 (ii), and HPIOs-9 (iii). (B) Field-dependent magnetization curves (M−H) of HPIOs-21, HPIOs-14, HPIOs-9 at a magnetic field of 5 T at 300 K (insets: magnification of M−H curves from −1000 to 1000 Oe). (C) TEM images of HPIOs-14@ZDS incubated in PBS (pH 7.4) buffer for 1 (i), 2 (ii), and 4 (iii) h, respectively. Relaxation measurements of HPIOs and IOs at (D) 0.5 and (F) 1.5 T. T1-weighted phantom imaging of HPIOs-21, HPIOs-14, HPIOs-9, IO-26, IO-17, and IO-11 on (E) 0.5 T and (G) 1.5 T MRI scanners. (H) In vivo T1 MR imaging in the axial plane of rats before and at 4 and 24 h after injection of HPIOs-14 at a dose of 0.05 mmol Fe/kg body weight. Arrows and dotted circles indicate the kidneys and bladder, respectively. Reprinted with permission from Ref. [58]. Copyright 2018, American Chemical Society.
Figure 2
Figure 2
(A) Schematic illustration of the synthesis of PeA@OSNC. (B) Schematic illustration of the structural conversion process from nanoemulsion to hollow structure. (C) TEM images of PeA@OSNC. (D) Fe element mapping corresponding to panel B, displaying the distribution of Fe3O4 nanoparticles in the overall structure. (E) XRD pattern of PeA@OSNC presents the characteristic diffraction peaks of magnetite (Fe3O4) crystals including (220), (311), (400), (511), (422) and (440) lattice planes. (F) Field-dependent magnetization curve of OSNC at room temperature. Absence of hysteresis loop confirms the superparamagnetism of our prepared sample. (G) T2-weighted MR phantom images and (H) plot of inverse transverse relationship times (1/T2) versus Fe concentration for OSNC. (I) In vivo MR imaging of tumor-bearing mice before and after intratumoral injection of PeA@OSNC suspension. Arrows point to tumor tissue. Reprinted with permission from Ref. [78]. Copyright 2016, American Chemical Society.
Scheme 2
Scheme 2
Schematic illustration of the characteristics of T1-, T2-, and T1/T2-weighted dual-modal MRI.
Figure 3
Figure 3
(A) TEM images of (ac) MIO and (eg) GdIO. HRTEM images of (d) MIO and (h) GdIO. (B) Energy dispersive spectrometry mapping images of GdIO. (C) Field-dependent magnetization curve of GdIO at 3 and 300 K. (D) Transverse relaxation rate and (E) Longitudinal relaxation rate of ipGdIO-Dox measured using 3.0 T and 7.0 T MRI scanners. (F,G) T1- and T2-weighted MR images of cancer-bearing mice at coronal planes after injection of pGdIO-Dox and ipGdIO-Dox. Reprinted with permission from Ref. [81]. Copyright 2022, American Chemical Society.
Figure 4
Figure 4
(A) Illustration of MM@HMFe@BS for self-amplified chemodynamic therapy and tumor metastasis inhibition via tumor microenvironment remodeling under the monitoring of MRI. (B) Representative TEM images of MM@HMFe@BS. (C) Nitrogen adsorption−desorption curve of the HMFe. Inset shows the pore size of HMFe. (D) Time-dependent decomposition behavior of MM@ HMFe@BS. (E) In vitro release profiles of BS from MM@HMFe@BS at various pH values (5.0, 6.5, or 7.4) with or without H2O2. (F) UV−Vis absorption spectra of TMB after coincubation with DW (deionized water), solid Fe3O4, and HMFe in the presence of H2O2 (100 μM) at pH 5.0. (G) ESR spectra of detected •OH at different conditions. (H) Western blot analysis of α4 and VCAM-1 in macrophage membrane and 4T1 cells membrane, respectively. Fluorescence images of (I) BCECF-stained and (J) APF-stained 4T1 cells treated with free BS, HMFe, HMFe@BS, and MM@HMFe@BS for 12 h. (K) Relative tumor volume changes in 4T1 tumor-bearing mice with different treatments (n = 5). (L) Lung metastasis inhibition ratios on the 15th day post-treated with different formulations in contrast to control group (n = 5). (M) Linear plot of 1/T2 as a function of HMFe concentration. The inset is T2-weighted MRI images of HMFe. (N) In vivo MRI of 4T1 tumor-bearing mice before and after intravenous injection of MM@HMFe@BS. Reprinted with permission from Ref. [99]. Copyright 2022, American Chemical Society. * p < 0.05.
Figure 5
Figure 5
(A) Schematic representation of the formation of magnetic-induced HMNCs. (B) HRTEM image of single HMNCs; the lower lattice of the HMNCs is a single magnetite stripe. (C) N2 adsorption–desorption isotherm of the as-synthesized HMNCs, the inset is the pore size distribution of the HMNCs. (D) UV–Vis–NIR absorption spectra of water (control) and the HMNCs aqueous solution. (E) Temperature change in pure water (control) and HMNCs solution at different concentrations under NIR-II irradiation (1064 nm, 0.8 W cm−2) for 300 s. (F) Temperature change in HMNCs solution (200 µg mL−1) under NIR-II irradiation time (1064 nm, 0.8 W cm−2); radiation was stopped after 900 s. (G) The relationship between the linear time data obtained from the cooling time shown in Figure 4F and -lnθ. (H) UV–Vis absorption spectra of the HMNCs and the DOX-loaded HMNCs aqueous solution; the inset: (left) pure DOX solution, (middle) DOX solution mixed with the HMNCs, and (right) the supernatant after magnetic separation. (I) Responsive release of DOX from the DOX-loaded HMNCs over time at various pH values (7.4, 6.0, and 5.0) in a 37 °C solution. (J) Responsive release of DOX from the DOX-loaded HMNCs with or without NIR-II irradiation over different time points (1064 nm, 0.8 W cm−2, 5 min) in PBS solution at pH = 7.4 and 37 °C. (K) Vis–NIR absorption spectra of TMB (oxTMB) treated by the HMNCs and H2O2 at different pH values. (L) T2weighted MR images and quantitative T2 maps of the HMNCs at different concentrations. (M) Plot of 1/T2 (R2) as a function of iron concentration in the HMNCs. (N) Tumor growth curve of mice treated by different conditions (PBS, I; PBS plus NIR-II, II; HMNCs, III; DOX-loaded HMNCs, IV; HMNCs plus NIR-II, V; DOX-loaded HMNCs plus NIR-II, VI). (O) Typical photos of the tumors collected from mice with different treatments at the end of the treatment (day 20). Reprinted with permission from Ref. [106]. Copyright 2021, Wiley-VCH GmbH. ** p < 0.01, *** p < 0.001, **** p < 0.0001.
Figure 6
Figure 6
Schematic illustration of the preparation of yolk-shell Fe3O4@PDA@Pt-PEG-Ce6 and the use of the new nanoplatform for imaging and tumor phototherapy. Reprinted with permission from Ref. [107]. Copyright 2022, Elsevier Inc.
Figure 7
Figure 7
(A) Schematic representation of MoSe2 and MoSe2/Fe3O4 nanomaterials. (B) TEM image of MF-2 and HAADF−STEM image of MF-2 and the corresponding STEM−EDX elemental mapping images for Se, Mo, and Fe. (C) UV−Vis spectrum of MF-2 with different concentrations. (D) Photothermal heating curves of MF-2 dispersions with different concentrations under an 808 nm laser (1 W cm−2) irradiation. (E,F) Schematic illustration of the energy band configuration of MoSe2 and Fe3O4 and possible mechanism of the charge separation of the MoSe2/Fe3O4 system. (G) Fluorescence spectra (excitation at 495 nm) of corresponding sample supernatants (300 μg mL−1) and DCFH-DA after irradiation by a NIR laser for 10 min (808 nm, 1 W cm−2) under different conditions. (H) O2 concentration changes after the addition of O2@MF-2@PEG or O2@PFC@MF-2@PEG into deoxygenated water under without and with 808 nm laser irradiation. (I) Fluorescence images of the cells stained with ROS and hypoxia probes. (J,K) In vitro CT images and relative CT values of MF-2 solution vs. different Mo concentrations. (L) CT images of a tumor-bearing mouse before and after injection in situ. (M,N) T2-weighted MR images and corresponding relaxation rates (r2) of MF-2 recorded using a 9.4 T MR scanner. (O) MR images for in vivo mapping before and after injection of MF-2@PEG. (P) Degradation time-dependent UV−Vis spectra of MF-2 in PBS. (Q) Changes in the relative tumor volume achieved after various treatments. Reprinted with permission from Ref. [108]. Copyright 2019, American Chemical Society. *** p < 0.001.
Figure 8
Figure 8
Schematic fabrication routes of hM@ZMDF nanoplatforms based on MIL-88B(Fe) and their applications in cancer-targeted combined therapy. Reprinted with permission from Ref. [113]. Copyright 2019, American Chemical Society.
Figure 9
Figure 9
(A) Schematic illustration of the design and synthesis of HMNP-PB@Pent@DOX for NIR-guided synergetic chemo-photothermal tumor therapy with tri-modal imaging in vivo. (B) TEM image of HMNP-PB. (C) Representative UV–Vis–NIR absorption spectra of HMNP, DOX, PB, and HMNP-PB@Pent@DOX NPs in PBS. (D) Concentration-dependent thermogenesis of HMNP-PB@Pent@DOX in PBS irradiated by NIR laser (808 nm, 1.2 W cm−2, 5 min). (E) The on–off switch drug release of HMNP-PB@Pent@DOX NPs in PBS with NIR laser (808 nm, 1.2 W cm−2). (F) CLSM images of HepG2 cells incubated with HMNP-PB@Pent@DOX NPs before and after irradiation by NIR laser (808 nm, 1.2 W cm−2) for 5 min. (G) T2-MR images of tumors of (a) preinjection of PBS, (b) after injection of PBS for 12 h, (c) after injection of PBS for 7 d with NIR laser irradiation, (d) preinjection of HMNP-PB@Pent@DOX, (e) after injection of HMNP-PB@Pent@DOX for 12 h, and (f) after injection of HMNP-PB@Pent@DOX for 7 d with NIR laser irradiation. (H) Infrared thermographic images of tumor-bearing nude mice irradiated with NIR laser. (I) PAI signals in the tumors before and after injection of HMNP-PB@Pent@DOX for 2, 6, and 12 h. (J) Photographs of the solid tumors after different treatments for 16 d. (K) Relative tumor volumes of mice with different treatments. Reprinted with permission from Ref. [125]. Copyright 2017, Wiley-VCH GmbH. *** p < 0.001.

References

    1. Liao G., He F., Li Q., Zhong L., Zhao R., Che H., Gao H., Fang B. Emerging graphitic carbon nitride-based materials for biomedical applications. Prog. Mater Sci. 2020;112:100666. doi: 10.1016/j.pmatsci.2020.100666. - DOI
    1. Zhang L., Fan Y., Yang Z., Yang M., Wong C.-Y. NIR-II-driven and glutathione depletion-enhanced hypoxia-irrelevant free radical nanogenerator for combined cancer therapy. J. Nanobiotechnol. 2021;19:265. doi: 10.1186/s12951-021-01003-2. - DOI - PMC - PubMed
    1. Mousavi S.M., Behbudi G., Gholami A., Hashemi S.A., Nejad Z.M., Bahrani S., Chiang W.-H., Wei L.C., Omidifar N. Shape-controlled synthesis of zinc nanostructures mediating macromolecules for biomedical applications. Biomater. Res. 2022;26:4. doi: 10.1186/s40824-022-00252-y. - DOI - PMC - PubMed
    1. Yong T., Zhang X., Bie N., Zhang H., Zhang X., Li F., Hakeem A., Hu J., Gan L., Santos H.A. Tumor exosome-based nanoparticles are efficient drug carriers for chemotherapy. Nat. Commun. 2019;10:3838. doi: 10.1038/s41467-019-11718-4. - DOI - PMC - PubMed
    1. Pallares R.M., Abergel R.J. Nanoparticles for targeted cancer radiotherapy. Nano Res. 2020;13:2887–2897. doi: 10.1007/s12274-020-2957-8. - DOI

LinkOut - more resources