Review
. 2022 Aug 25;27(17):5429.
doi: 10.3390/molecules27175429.

Radionuclides for Targeted Therapy: Physical Properties

Affiliations
Review

Radionuclides for Targeted Therapy: Physical Properties

Caroline Stokke et al. Molecules. .

Abstract

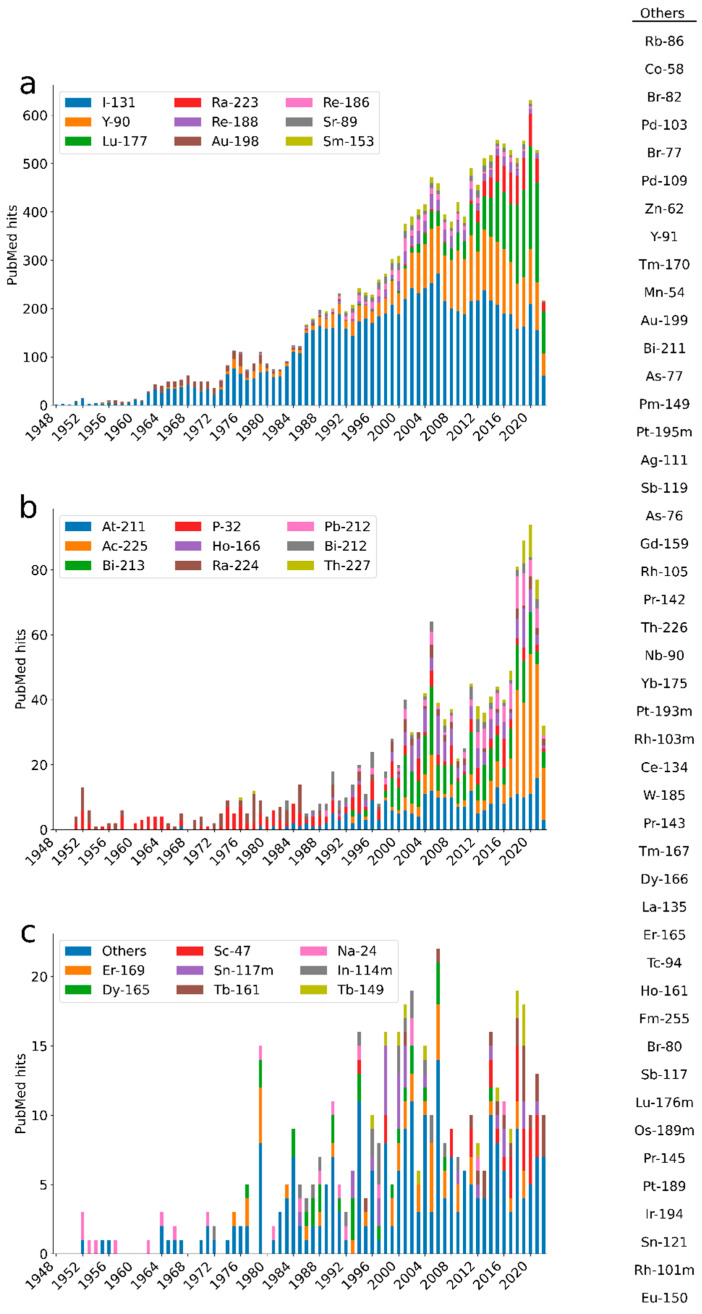
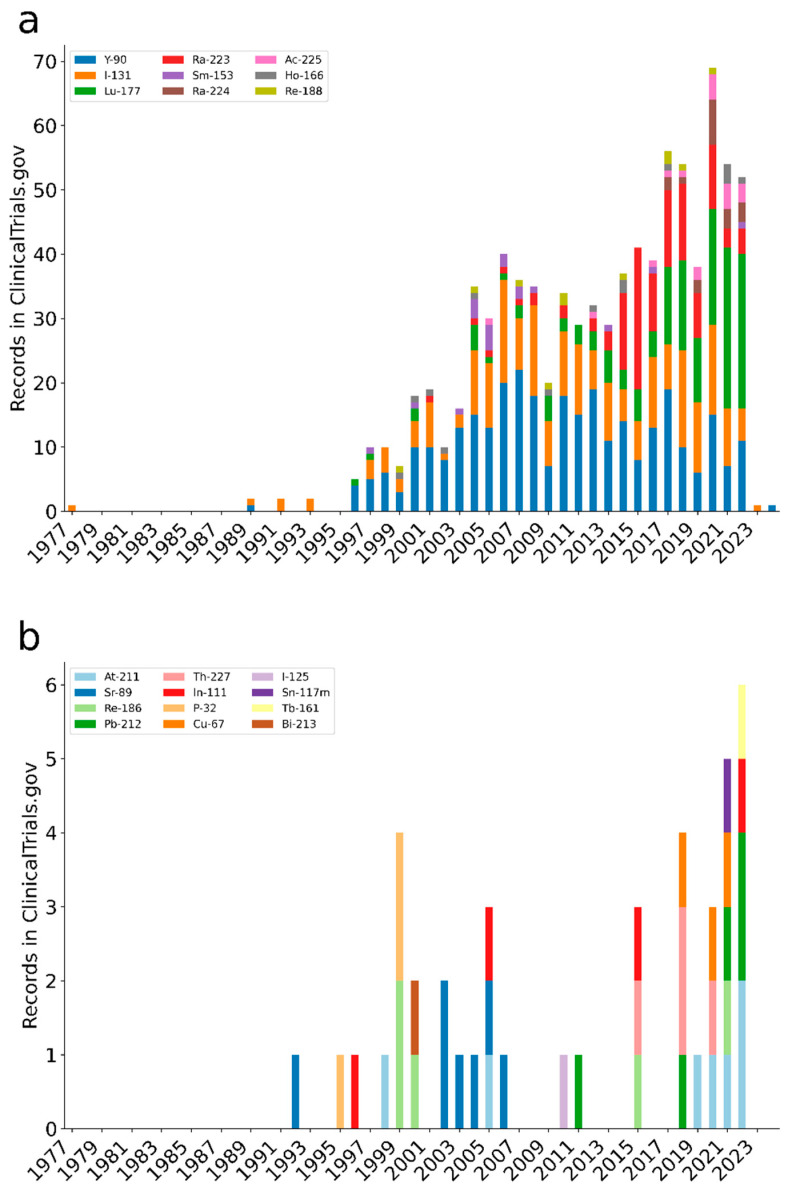
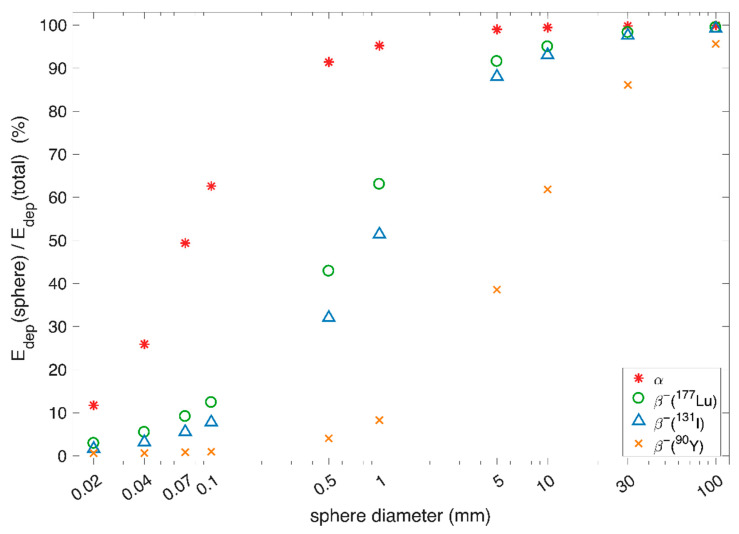
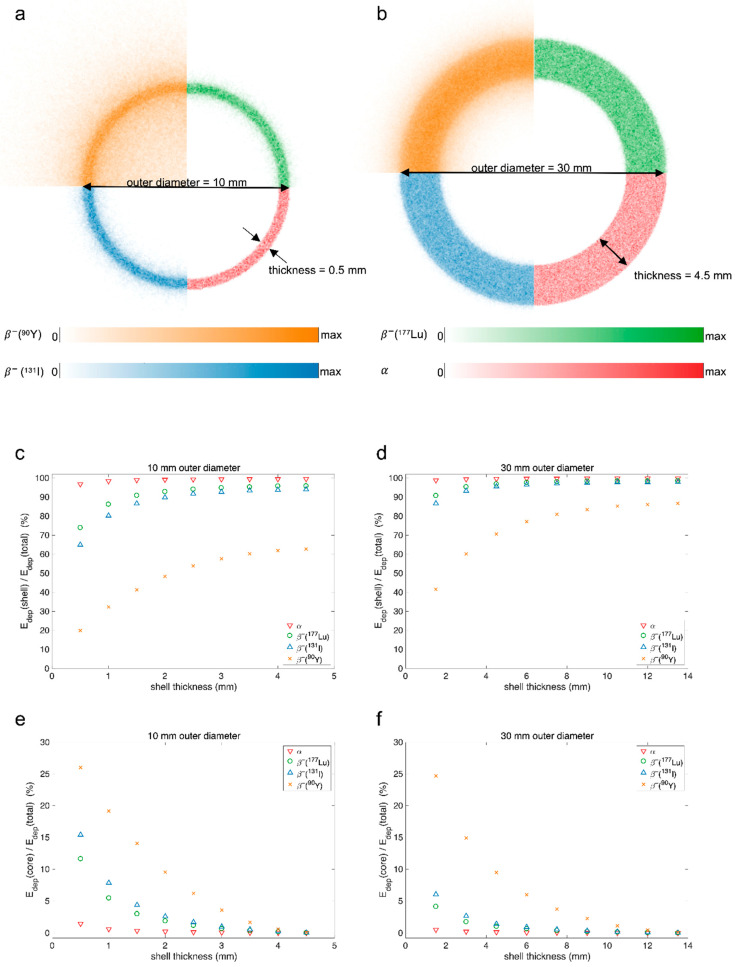
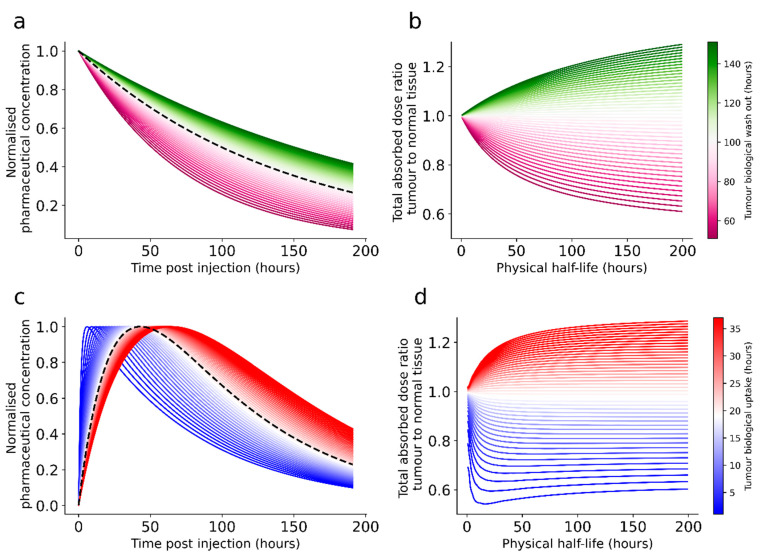
A search in PubMed revealed that 72 radionuclides have been considered for molecular or functional targeted radionuclide therapy. As radionuclide therapies increase in number and variations, it is important to understand the role of the radionuclide and the various characteristics that can render it either useful or useless. This review focuses on the physical characteristics of radionuclides that are relevant for radionuclide therapy, such as linear energy transfer, relative biological effectiveness, range, half-life, imaging properties, and radiation protection considerations. All these properties vary considerably between radionuclides and can be optimised for specific targets. Properties that are advantageous for some applications can sometimes be drawbacks for others; for instance, radionuclides that enable easy imaging can introduce more radiation protection concerns than others. Similarly, a long radiation range is beneficial in targets with heterogeneous uptake, but it also increases the radiation dose to tissues surrounding the target, and, hence, a shorter range is likely more beneficial with homogeneous uptake. While one cannot select a collection of characteristics as each radionuclide comes with an unchangeable set, all the 72 radionuclides investigated for therapy-and many more that have not yet been investigated-provide numerous sets to choose between.

Keywords: alpha; auger; beta; molecular radiotherapy; radioactivity; radionuclide; radionuclide therapy; targeted therapy.


Conflict of interest statement

The authors declare no conflict of interest.

Figures

Figure 6
Figure 6
Six decay schemes (af), including most alpha-emitters relevant for radionuclide therapy. All branching ratios larger than 0.1% are included. The beta- and alpha-particle energies given are for the highest intensity emission. Data from Ref. [96].
Figure 1
Figure 1
The number of hits in PubMed as of 30 June 2022, per radionuclide and year of publication. The radionuclides have been separated according to the aggregated numbers of publications across panels (ac). The radionuclides with fewer than 13 hits total have been aggregated into “Others” and are listed to the right in the figure. The search strategy and search strings are described in Supplementary File S1.
Figure 2
Figure 2
The number of records in the clinical trials database as of June 2022 per radionuclide and year. The results are split in panels (a,b) according to the aggregated number of records. The search strategy and search strings are described in Supplementary File S1.
Figure 3
Figure 3
The figure shows energy deposited within a spherical source (Edep(sphere)) as a percentage of the total energy emitted (Edep(total)). The sphere source diameter ranged from 0.02 mm, to approximate a single cell, to 100 mm, to approximate a large tumour. Note that the x-axis is a log scale. Four different sources are shown, three pure beta sources with beta energies following the emission spectra for 90Y, 177Lu, and 131I, and an alpha source with alpha energies of 5.5 MeV. For large spheres, most of the energy will be deposited inside the sphere regardless of type of emitter.
Figure 4
Figure 4
The figure shows energy deposited in and around a spherical shell source. This approximates a situation where there is uptake around the outer rim of a core without uptake. Panels (a,b) illustrate examples of shell thicknesses for the two outer diameters and show the central slices of images containing the energy deposition maps of the shells, where each quarter shows a different source. In panels (c,d), the ratio of energy deposited in the shell source (Edep(shell)) to total deposited energy (Edep(total)) is plotted against the shell thickness. In panels (e,f), the ratio of energy deposited in the core (Edep(core)) to total deposited energy is also plotted against shell thickness. Two different outer diameters were used: in (a,c,e), shells with an outer diameter of 10 mm are shown, and, in (b,d,f), shells with an outer diameter of 30 mm are shown. Four different sources were used, three pure beta sources with beta energies following the emission spectra for 90Y, 177Lu, and 131I, and an alpha source with alpha energies of 5.5 MeV.
Figure 5
Figure 5
The figure illustrates theoretical situations that involve biological uptake and clearance of a radiopharmaceutical in a normal organ and tumours (a,c) and the differences in absorbed dose ratios that can be expected by selecting radionuclides with various half-lives for each (b,d). Two different types of kinetics are illustrated. In both scenarios, the normal tissue kinetics (illustrated with a dashed black line) are kept fixed and the tumour kinetics are varied. In the first situation, illustrated in panel (a), with the corresponding ratios in panel (b), an instantaneous uptake and a mono-exponential elimination is assumed for both tumour and normal tissue. The initial amount of radiopharmaceutical per tissue is set identical for both normal organ and tumours. The tumour-curves have been colour-graded according to the biological half-life, where white is equal to the normal tissue elimination (here, 100 h), whereas more saturated green indicates a slower and saturated purple indicates a faster elimination compared to the normal tissue. In panel (b), the ratios between the total energy absorption between tumour and normal tissue for the different tumour eliminations have been plotted for a range of physical half-lives. In panel (c), a different situation with bi-exponential uptake and washout is illustrated. Here, the rate of wash-out is kept fixed, while the uptake phase is varied. Again, different theoretical tumours are shown in coloured whole lines, where more saturated blue is a faster uptake and more saturated red is a slower uptake, while the normal organ is represented by a black dashed line. The curves here have been normalised to the same maximum amount of radiopharmaceutical per tissue. In panel (d), the absorbed dose ratios between the tumours and the normal organ are plotted over a range of physical half-lives for this scenario.

References

    1. Silberstein E.B. Radionuclide therapy of hematologic disorders. Semin. Nucl. Med. 1979;9:100–107. doi: 10.1016/S0001-2998(79)80041-0. - DOI - PubMed
    1. Sawin C.T., Becker D.V. Radioiodine and the treatment of hyperthyroidism: The early history. Thyroid. 1997;7:163–176. doi: 10.1089/thy.1997.7.163. - DOI - PubMed
    1. Sgouros G., Bodei L., McDevitt M.R., Nedrow J.R. Radiopharmaceutical therapy in cancer: Clinical advances and challenges. Nat. Rev. Drug. Discov. 2020;19:589–608. doi: 10.1038/s41573-020-0073-9. - DOI - PMC - PubMed
    1. Eckerman K., Endo A. ICRP Publication 107. Nuclear decay data for dosimetric calculations. Ann. ICRP. 2008;38:7–96. - PubMed
    1. Willowson K.P. Production of radionuclides for clinical nuclear medicine. Eur. J. Phys. 2019;40:043001. doi: 10.1088/1361-6404/ab169b. - DOI

LinkOut - more resources