

131I-C19 Iodide Radioisotope and Synthetic I-C19 Compounds as K-Ras4B-PDE6δ Inhibitors: A Novel Approach against Colorectal Cancer-Biological Characterization, Biokinetics and Dosimetry
- PMID: 36080216
- PMCID: PMC9458062
- DOI: 10.3390/molecules27175446
131I-C19 Iodide Radioisotope and Synthetic I-C19 Compounds as K-Ras4B-PDE6δ Inhibitors: A Novel Approach against Colorectal Cancer-Biological Characterization, Biokinetics and Dosimetry
Abstract
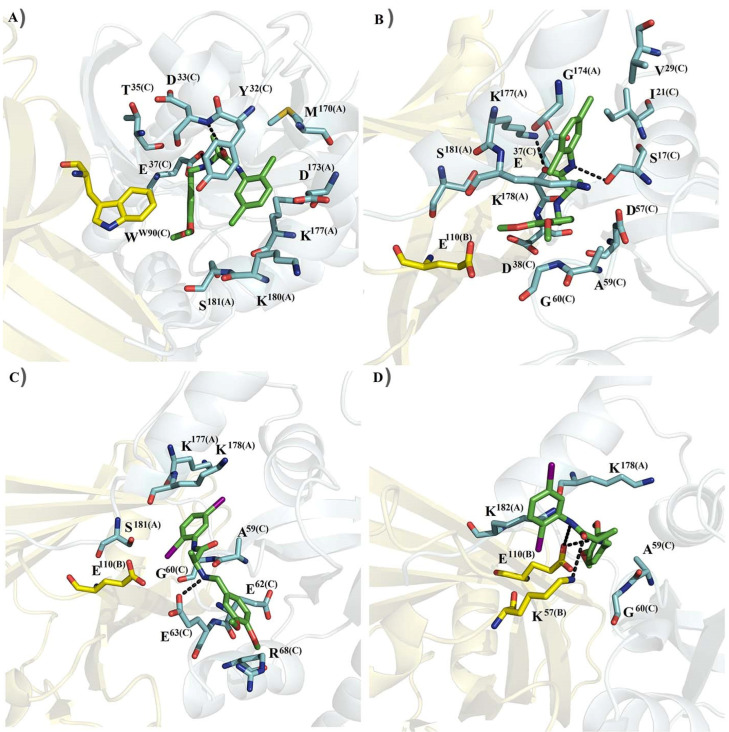
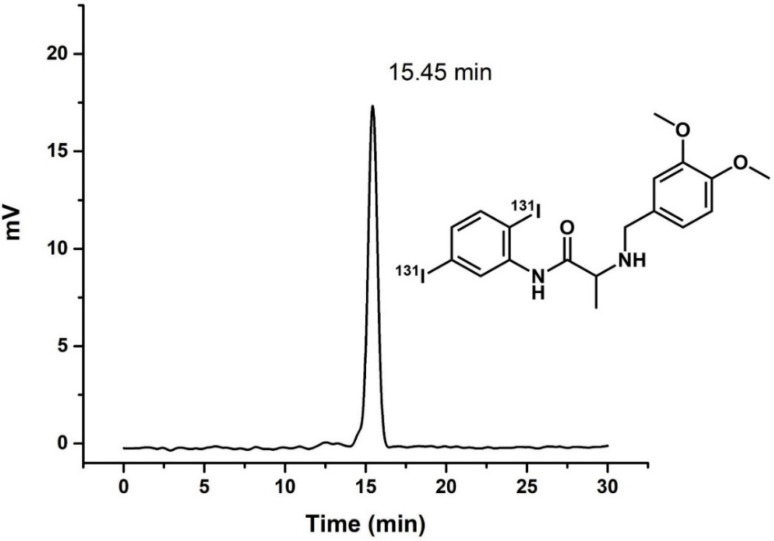
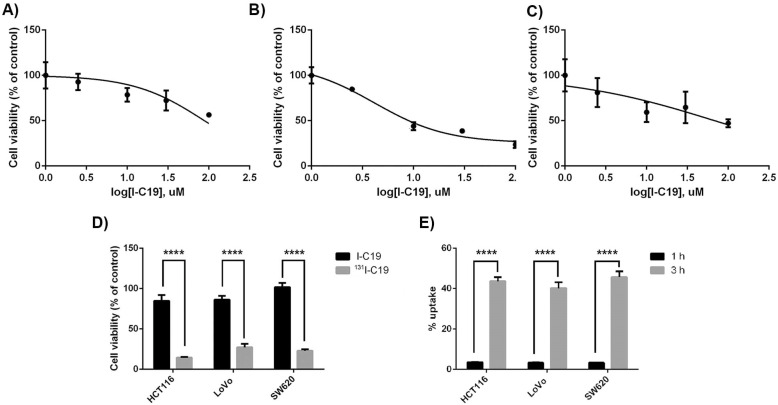
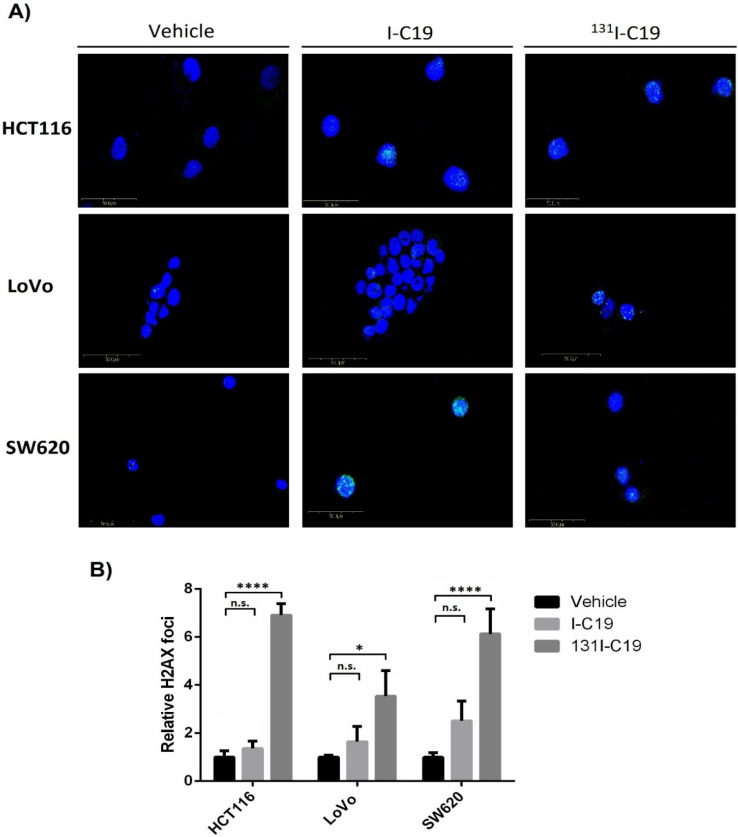
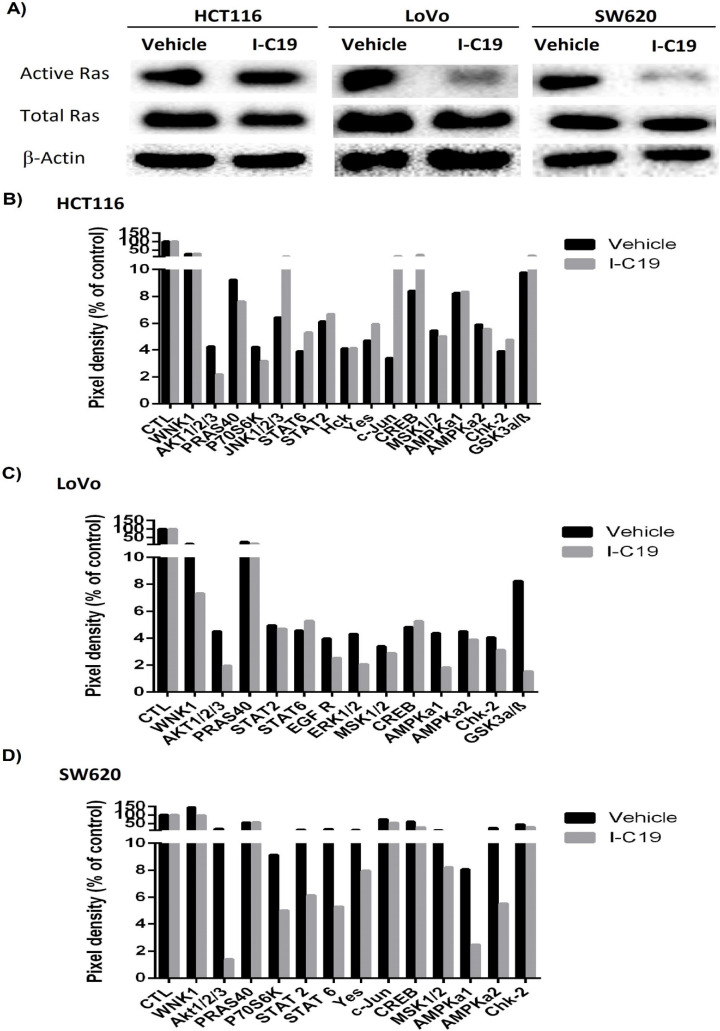
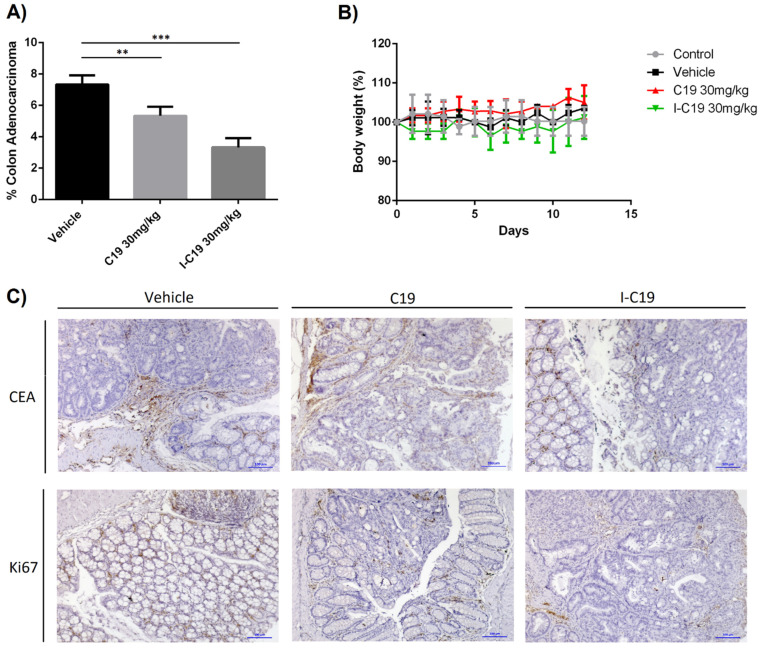
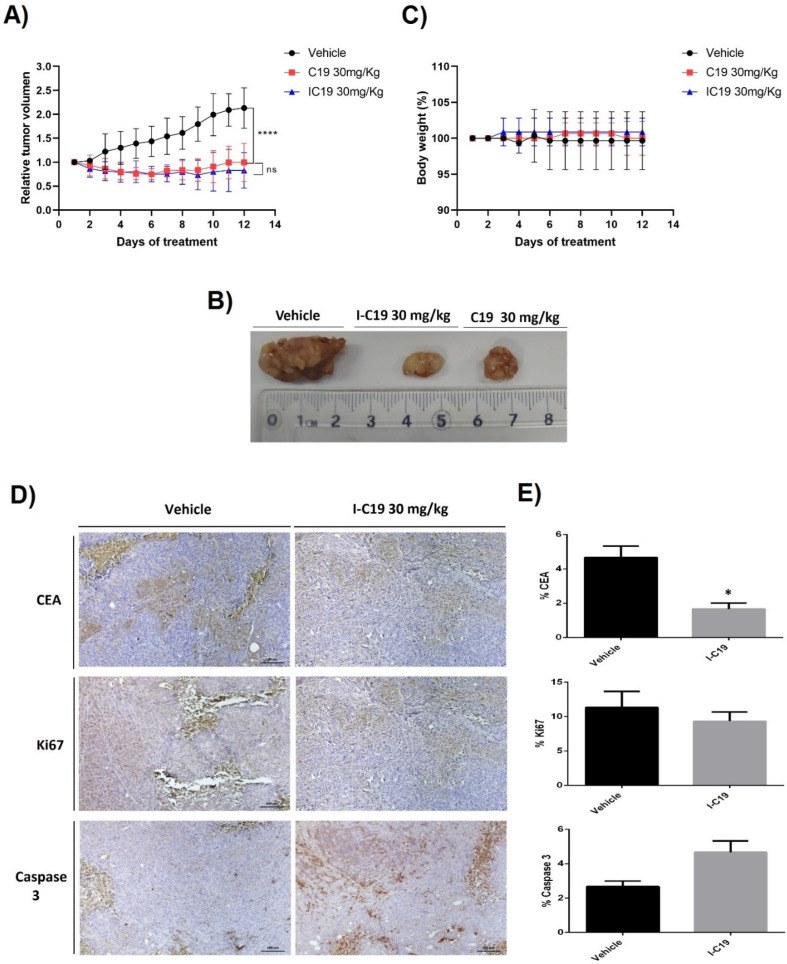
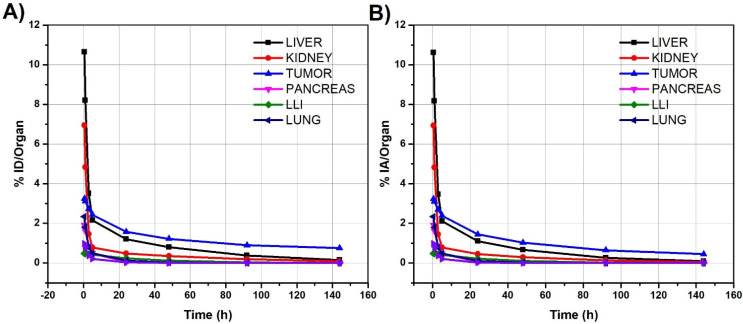
In 40-50% of colorectal cancer (CRC) cases, K-Ras gene mutations occur, which induce the expression of the K-Ras4B oncogenic isoform. K-Ras4B is transported by phosphodiesterase-6δ (PDE6δ) to the plasma membrane, where the K-Ras4B-PDE6δ complex dissociates and K-Ras4B, coupled to the plasma membrane, activates signaling pathways that favor cancer aggressiveness. Thus, the inhibition of the K-Ras4B-PDE6δ dissociation using specific small molecules could be a new strategy for the treatment of patients with CRC. This research aimed to perform a preclinical proof-of-concept and a therapeutic potential evaluation of the synthetic I-C19 and 131I-C19 compounds as inhibitors of the K-Ras4B-PDE6δ dissociation. Molecular docking and molecular dynamics simulations were performed to estimate the binding affinity and the anchorage sites of I-C19 in K-Ras4B-PDE6δ. K-Ras4B signaling pathways were assessed in HCT116, LoVo and SW620 colorectal cancer cells after I-C19 treatment. Two murine colorectal cancer models were used to evaluate the I-C19 therapeutic effect. The in vivo biokinetic profiles of I-C19 and 131I-C19 and the tumor radiation dose were also estimated. The K-Ras4B-PDE6δ stabilizer, 131I-C19, was highly selective and demonstrated a cytotoxic effect ten times greater than unlabeled I-C19. I-C19 prevented K-Ras4B activation and decreased its dependent signaling pathways. The in vivo administration of I-C19 (30 mg/kg) greatly reduced tumor growth in colorectal cancer. The biokinetic profile showed renal and hepatobiliary elimination, and the highest radiation absorbed dose was delivered to the tumor (52 Gy/74 MBq). The data support the idea that 131I-C19 is a novel K-Ras4B/PDE6δ stabilizer with two functionalities: as a K-Ras4B signaling inhibitor and as a compound with radiotherapeutic activity against colorectal tumors.
Keywords: I-C19; K-Ras4B; PDE6δ; colorectal cancer; pharmacokinetics.
Conflict of interest statement
The authors declare no conflict of interest.
Figures

Similar articles
-
The small organic molecule C19 binds and strengthens the KRAS4b-PDEδ complex and inhibits growth of colorectal cancer cells in vitro and in vivo.BMC Cancer. 2018 Nov 1;18(1):1056. doi: 10.1186/s12885-018-4968-3. BMC Cancer. 2018. PMID: 30382908 Free PMC article.
-
KRas4B-PDE6δ complex stabilization by small molecules obtained by virtual screening affects Ras signaling in pancreatic cancer.BMC Cancer. 2018 Dec 29;18(1):1299. doi: 10.1186/s12885-018-5142-7. BMC Cancer. 2018. PMID: 30594165 Free PMC article.
-
Antineoplastic effect of compounds C14 and P8 on TNBC and radioresistant TNBC cells by stabilizing the K-Ras4BG13D/PDE6δ complex.Front Oncol. 2024 Mar 20;14:1341766. doi: 10.3389/fonc.2024.1341766. eCollection 2024. Front Oncol. 2024. PMID: 38571493 Free PMC article.
-
K-Ras4B/calmodulin/PI3Kα: A promising new adenocarcinoma-specific drug target?Expert Opin Ther Targets. 2016 Jul;20(7):831-42. doi: 10.1517/14728222.2016.1135131. Epub 2016 Feb 12. Expert Opin Ther Targets. 2016. PMID: 26873344 Review.
-
The Hypervariable Region of K-Ras4B Governs Molecular Recognition and Function.Int J Mol Sci. 2019 Nov 14;20(22):5718. doi: 10.3390/ijms20225718. Int J Mol Sci. 2019. PMID: 31739603 Free PMC article. Review.
Cited by
-
Synergistic effect of antagonists to KRas4B/PDE6 molecular complex in pancreatic cancer.Life Sci Alliance. 2023 Oct 9;6(12):e202302019. doi: 10.26508/lsa.202302019. Print 2023 Dec. Life Sci Alliance. 2023. PMID: 37813486 Free PMC article.
References
-
- Haigis K.M., Kendall K.R., Wang Y., Cheung A., Haigis M.C., Glickman J.N., Niwa-Kawakita M., Sweet-Cordero A., Sebolt-Leopold J., Shannon K.M., et al. Differential effects of oncogenic K-Ras and N-Ras on proliferation, differentiation and tumor progression in the colon. Nat. Genet. 2008;40:600–608. doi: 10.1038/ng.115. - DOI - PMC - PubMed
-
- Chandra A., Grecco H.E., Pisupati V., Perera D., Cassidy L., Skoulidis F., Ismail S.A., Hedberg C., Hanzal-Bayer M., Venkitaraman A.R., et al. The GDI-like solubilizing factor PDEdelta sustains the spatial organization and signalling of Ras family proteins. Nat. Cell Biol. 2011;14:148–158. doi: 10.1038/ncb2394. - DOI - PubMed
MeSH terms
Substances
LinkOut - more resources
Full Text Sources
Medical
Miscellaneous
