. 2022 Aug 26;27(17):5483.
doi: 10.3390/molecules27175483.

Metabolomic Analysis and MRM Verification of Coarse and Fine Skin Tissues of Liaoning Cashmere Goat

Affiliations

Metabolomic Analysis and MRM Verification of Coarse and Fine Skin Tissues of Liaoning Cashmere Goat

Yanan Xu et al. Molecules. .

Abstract

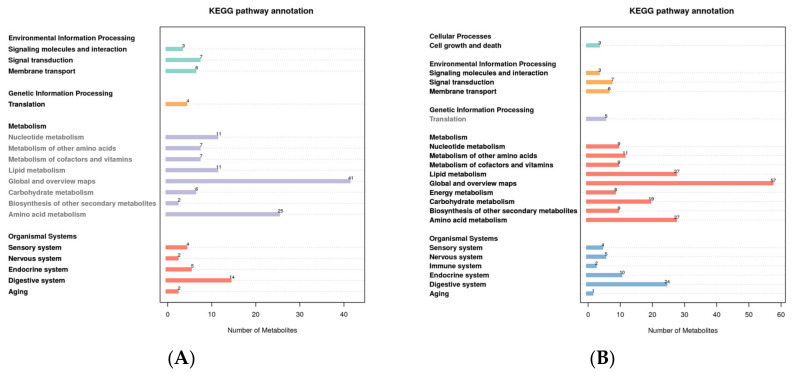
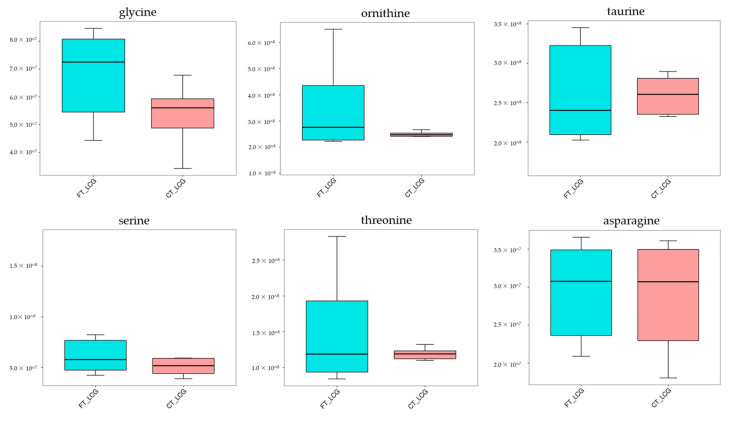
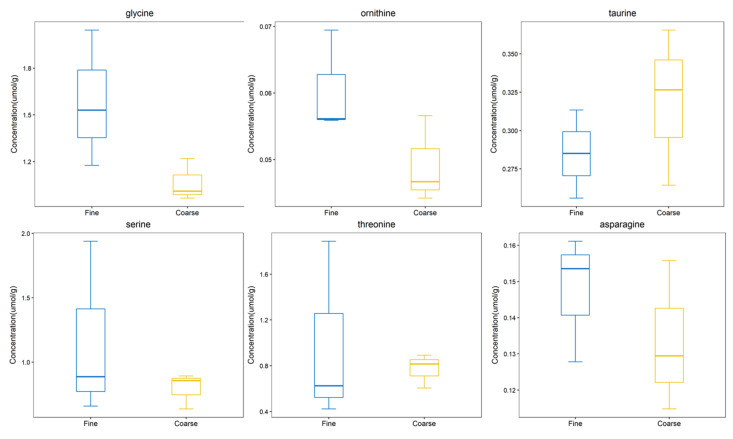
One of the critical elements in evaluating the quality of cashmere is its fineness, but we still know little about how it is regulated at the metabolic level. In this paper, we use UHPLC-MS/MS detection and analysis technology to compare the difference in metabolites between coarse cashmere (CT_LCG) and fine cashmere (FT_LCG) skin of Liaoning cashmere goats. According to the data, under positive mode four metabolites were significantly up-regulated and seven were significantly down-regulated. In negative mode, seven metabolites were significantly up-regulated and fourteen metabolites were significantly down-regulated. The two groups' most significant metabolites, Gly-Phe and taurochenodeoxycholate, may be crucial in controlling cashmere's growth, development, and fineness. In addition, we enriched six KEGG pathways, of which cholesterol metabolism, primary bile acid biosynthesis, and bile secretion were enriched in positive and negative modes. These findings offer a new research idea for further study into the critical elements influencing cashmere's fineness.

Keywords: Liaoning cashmere goat; MRM; UHPLC–MS/MS; cashmere fineness; metabolomics.


Conflict of interest statement

The authors declare no conflict of interest.

Figures

Figure 1
Figure 1
Correlation analysis of QC samples ((A): positive mode; (B): negative mode).
Figure 2
Figure 2
Total sample PCA plot ((A): positive mode; (B): negative mode). The fractions of the first and second main components are shown in the figure as the abscissa PC1 and ordinate PC2, respectively. The ellipse in the diagram represents the 95 percent confidence interval, and the scattered spots in the figure indicate of experimental samples.
Figure 3
Figure 3
KEGG pathway enrichment of all putatively annotated metabolites ((A): positive mode; (B): negative mode). The abscissa represents the number of metabolites, and the ordinate represents the KEGG pathway.
Figure 4
Figure 4
HMDB classification notes ((A): positive mode; (B): negative mode). The abscissa represents the number of metabolites, and the ordinate represents the HMDB entry annotated.
Figure 5
Figure 5
LIPID MAPS classification notes ((A): positive mode; (B): negative mode). The abscissa represents the number of metabolites, and the ordinate represents the LIPID MAPS entry annotated.
Figure 6
Figure 6
PLS-DA score scatter plots ((A): positive mode; (B): negative mode). The sample’s score on the first principal component is represented by the abscissa, while the ordinate represents the sample’s score on the second principal component. R2Y is the model’s interpretation rate, and Q2Y is used to assess the PLS-DA model’s predictive power.
Figure 7
Figure 7
PLS-DA sorting verification diagram ((A): positive mode; (B): negative mode). The scores for R2 and Q2 make up the ordinate, while the abscissa represents the correlation between the original grouping Y and the random grouping Y.
Figure 8
Figure 8
Differential metabolite volcano plots ((A): positive mode; (B): negative mode). The abscissa represents the multiple changes in expression of metabolites in different groups (log2FC), and the ordinate represents the significant level of difference (−log10 p-value). Each dot on the volcano plot stands for a different metabolite; the red dot indicates a metabolite that has been significantly up-regulated, while the green dot indicates a metabolite that has been significantly down-regulated, and the size of the dot denotes the VIP value.
Figure 9
Figure 9
Differential metabolite correlation diagram ((A): positive mode; (B): negative mode). Red denotes positive correlation, and the highest correlation is 1. Blue means negative correlation, and the lowest correlation is −1. p > 0.05 is true of the portion without color. The top 20 differential metabolites are correlated in the figure in order of p-value from minimum to maximum.
Figure 10
Figure 10
KEGG enrichment bubble diagram ((A): positive mode; (B): negative mode). The abscissa is x/y, and the value increases with the pathway’s differential metabolite enrichment level. The hypergeometric test’s p-value is represented by the color of the point, and the smaller the value, the higher the test’s reliability. The number of distinct metabolites in the associated route is indicated by the size of the point.
Figure 11
Figure 11
Trend map of relative expression of metabolites.
Figure 12
Figure 12
Trend map of metabolite expression.

Similar articles

Cited by

References

    1. Wang S., Ge W., Luo Z., Guo Y., Jiao B., Qu L., Zhang Z., Wang X. Integrated analysis of coding genes and non-coding RNAs during hair follicle cycle of cashmere goat (Capra hircus) BMC Genom. 2017;18:767. doi: 10.1186/s12864-017-4145-0. - DOI - PMC - PubMed
    1. Liu X., Jiang H.Z., Song X.C. Analysis of annual effect of cashmere performance of Liaoning cashmere goats. Anim. Husb. Vet. Med. 2020;08:55–57.
    1. Dunn W.B., Ellis D. Metabolomics: Current analytical platforms and methodologies. TrAC Trends Anal. Chem. 2005;24:285–294.
    1. Fiehn O. Metabolomics—The link between genotypes and phenotypes. Plant Mol. Biol. 2002;48:155–171. doi: 10.1023/A:1013713905833. - DOI - PubMed
    1. Delplancke T.D., De Seymour J.V., Tong C., Sulek K., Xia Y., Zhang H., Han T.L., Baker P.N. Analysis of sequential hair segments reflects changes in the metabolome across the trimesters of pregnancy. Sci. Rep. 2018;8:36. doi: 10.1038/s41598-017-18317-7. - DOI - PMC - PubMed

LinkOut - more resources