. 2022 Sep 5;27(17):5735.
doi: 10.3390/molecules27175735.

Extract of Acanthopanax senticosus and Its Components Interacting with Sulfide, Cysteine and Glutathione Increase Their Antioxidant Potencies and Inhibit Polysulfide-Induced Cleavage of Plasmid DNA

Affiliations

Extract of Acanthopanax senticosus and Its Components Interacting with Sulfide, Cysteine and Glutathione Increase Their Antioxidant Potencies and Inhibit Polysulfide-Induced Cleavage of Plasmid DNA

Anton Misak et al. Molecules. .

Abstract

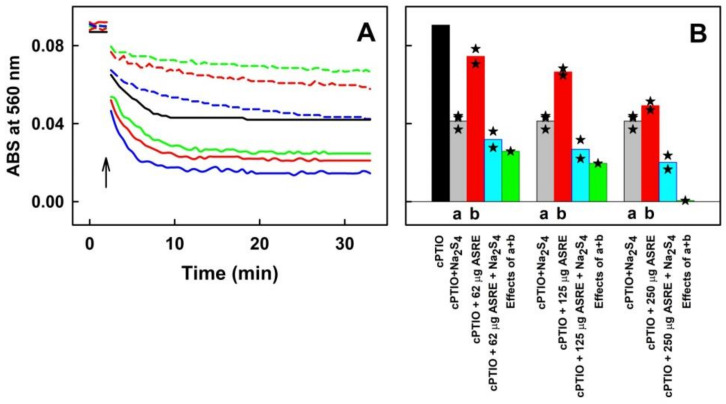
Aqueous root extract from Acanthopanax senticosus (ASRE) has a wide range of medicinal effects. The present work was aimed at studying the influence of sulfide, cysteine and glutathione on the antioxidant properties of ASRE and some of its selected phytochemical components. Reduction of the 2-(4-carboxyphenyl)-4,5-dihydro-4,4,5,5-tetramethyl-1H-imidazol-1-yloxy-3-oxide (cPTIO) stable radical and plasmid DNA (pDNA) cleavage in vitro assays were used to evaluate antioxidant and DNA-damaging properties of ASRE and its individual components. We found that the interaction of ASRE and its two components, caffeic acid and chlorogenic acid (but not protocatechuic acid and eleutheroside B or E), with H2S/HS-, cysteine or glutathione significantly increased the reduction of the cPTIO radical. In contrast, the potency of ASRE and its selected components was not affected by Na2S4, oxidized glutathione, cystine or methionine, indicating that the thiol group is a prerequisite for the promotion of the antioxidant effects. ASRE interacting with H2S/HS- or cysteine displayed a bell-shaped effect in the pDNA cleavage assay. However, ASRE and its components inhibited pDNA cleavage induced by polysulfides. In conclusion, we suggest that cysteine, glutathione and H2S/HS- increase antioxidant properties of ASRE and that changes of their concentrations and the thiol/disulfide ratio can influence the resulting biological effects of ASRE.

Keywords: Acanthopanax senticosus; DNA cleavage; H2S; antioxidant; caffeic acid; chlorogenic acid; eleutheroside; polysulfides; radical; ●cPTIO.


Conflict of interest statement

The authors declare no conflict of interests.

Figures

Figure 1
Figure 1
Representative time-resolved UV-VIS spectra (absorbance, ABS) of aqueous root extract from Acanthopanax senticosus (ASRE) without and with 2-(4-carboxyphenyl)-4,5-dihydro-4,4,5,5-tetramethyl-1H-imidazol-1-yloxy-3-oxide radical (cPTIO) and Na2S. (A) UV-VIS spectra of ASRE (75 µg mL−1) without (black) and with (red) cPTIO (100 µmol L−1) measured every 30 s for 2.5 min in 100 mmol L−1 sodium phosphate, 100 µmol L−1 diethylenetriaminepentaacetic acid (DTPA), pH 7.4 buffer at 37 °C. (B) Representative time-resolved UV-VIS spectra of 100 µmol L−1 ●cPTIO (black) and its mixture with 150 µg mL−1 of ASRE (red) after the addition of 25 µmol L−1 Na2S measured every 30 s for 30 min. The absorbance (ABS) at 358 and 560 nm decreased over time (arrows). The background ASRE spectrum was subtracted. The time-resolved spectra have this sequence: the black solid line is followed each 30 s by: long dash black, medium dash black, short dash black, dotted black, solid red line, long dash red, medium dash red, etc. Insert: Details of ABS at 420–720 nm.
Figure 2
Figure 2
The effects of the ASRE/Na2S mixture and Trolox on the reduction of cPTIO measured as a decrease of ABS at 560 nm. (A) Time dependence of ABS at 560 nm of cPTIO (100 µmol L−1) alone (black) and in the ASRE/cPTIO (150 µg mL−1/100 µmol L−1) mixture with increasing concentrations of Na2S: 0 (red), 5 (blue), 10 (green), 20 (pink), 50 (cyan) and 100 (dark yellow) µmol L−1 Na2S. (B) Time dependence of ABS at 560 nm of the Na2S/cPTIO (400/100 in µmol L−1) mixture (dash black) with increasing concentrations of ASRE: 6 (red), 12 (blue), 24 (green), 37.5 (pink), 75 (cyan), 150 (dark yellow), 225 (dark green) and 300 µg mL−1 (dark red) ASRE. Addition of ASRE to cPTIO is marked by the left arrow, and subsequent addition of Na2S by the right arrow. (C) Time dependence of ABS at 560 nm of cPTIO (100 µmol L−1) with the increasing concentration of (±)-6-hydroxy-2,5,7,8-tetramethylchromane-2-carboxylic acid (Trolox): 50 (red), 100 (blue), 200 (green), 400 (pink), 500 (cyan) and 2000 (dark yellow) µmol L−1 Trolox. The arrow marks addition of Trolox to the cPTIO solution. Buffer: 100 mmol L−1 sodium phosphate, 100 µmol L−1 DTPA, pH 7.4, measured at 37 °C.
Figure 3
Figure 3
The effect of ASRE/Cys, ASRE/GSH, ASRE/GSSG, ASRE/MET and ASRE/cystine mixtures on the reduction of the cPTIO, as measured by the decrease of ABS at 560 nm. (A) Time dependence of ABS of Cys with the cPTIO (400/100 in µmol L−1) mixture (dash black) in the presence of 37.5 (cyan), 75 (red), 150 (blue), 225 (green) and 300 (pink) µg mL−1 of ASRE. UV-VIS spectra of cPTIO were measured every 30 s for 2.5 min, followed by addition of ASRE (left arrow) and measurement for 2.5 min, then, Cys was added (right arrow) and measured every 30 s for 30 min. (B) Time dependence of ABS of cPTIO (100 µmol L−1) with 150 (dash black) or 300 µg mL−1 (black) ASRE. Time dependence of the mixture of ASRE (300 µg mL−1) with cPTIO (100 µmol L−1) in the presence of 2 (red), 10 (blue), 25 (green), 100 (cyan) and 200 (dark yellow) µmol L−1 Cys. UV-VIS spectra of cPTIO were measured every 30 s for 2.5 min, followed by addition of ASRE (left arrow) and measurement for 2.5 min, then, Cys was added (right arrow) and measured every 30 s for 30 min. (C) Time dependence of ABS of the mixture of ASRE (150 µg mL−1) with cPTIO (100 µmol L−1) (cyan) and GSH. ABS at 560 nm of the GSH/cPTIO (400/100 in µmol L−1) mixture without (black) and with 75 (red), 150 (blue), 225 (green) and 300 (pink) µg mL−1 of ASRE. The mixture of 300 µg mL−1 ASRE with GSH/cPTIO (2000/100 in µmol L−1) (dark yellow). Time dependence of ABS of the mixture of ASRE (150 µg mL−1) with cPTIO (100 µmol L−1) in the presence of 400 µmol L−1 of GSSG (long dash black), MET (short dash black) or cystine (dotted black). UV-VIS spectra of cPTIO were measured every 30 s for 2.5 min, followed by addition of ASRE (left arrow) and measured for 2.5 min, then GSH, GSSG, MET and cystine were added (right arrow) and measured every 30 s for 30 min. (D) The effect of increased concentration of ASRE without (black) and with H2S (green), Cys (red) and GSH (blue) on the reduction of cPTIO (100 µmol L−1). ABS at 560 nm was measured in the 10th min after compound addition.
Figure 4
Figure 4
The effects of the Na2S4/ASRE mixture on cPTIO reduction. (A) Representative time dependence of ABS of cPTIO (100 µmol L−1) with 62 (dash green), 125 (dash red) and 250 (dash blue) µg mL−1 of ASRE. Time dependence of ABS of Na2S4/cPTIO (20/100 in µmol L−1) at 560 nm (black) and after addition of 62 (green), 125 (red) and 250 (blue) µg mL−1 of ASRE (marked by arrow). (B) Comparison of the average ABS values at 560 nm in the tenth min of cPTIO (100 µmol L−1) (black), Na2S4/cPTIO (20/100 in µmol L−1) mixture (gray), cPTIO (100 µmol L−1) with 62, 125 and 250 µg mL−1 of ASRE (red) and Na2S4/cPTIO (20/100 in µmol L−1) with 62, 125 and 250 µg mL−1 of ASRE (cyan). Green bars represent the calculated average sum effects of Na2S4/cPTIO (20/100 in µmol L−1, gray) and cPTIO with 62, 125 and 250 µg mL−1 of ASRE (red). Stars indicate individual experiments (n = 2 or 3).
Figure 5
Figure 5
The effect of ASRE on pDNA cleavage in the presence of Na2S, polysulfides, GSH and Cys. The upper figure shows representative agarose gels indicating pDNA cleavage in the presence of an increasing concentration of ASRE and 100 μmol L−1 Na2S or Na2S4. The band at the bottom corresponds to the circular supercoiled form of pDNA, and the top band corresponds to the nicked circular form of pDNA. The letter C indicates control pDNA without any treatment. The final concentration of pDNA was 0.2 μg in 20 μL. The lower figure presents concentration-dependent effects of ASRE on Na2S-, polysulfide-, GSH- and Cys-mediated cleavage of pDNA in the 25 mmol L−1 sodium phosphate buffer (50 μmol L−1 DTPA, pH 7.4) at 37 °C. Control pDNA (triangle). Concentration-dependent effect of ASRE without (black) and with 100 μmol L−1 GSH (dark yellow), Cys (pink), Na2S (green), Na2S2 (red), Na2S3 (cyan) and Na2S4 (blue). The final concentration of pDNA was 0.2 μg in 20 μL. IR of ncDNA form represents the relative intensity of the nicked circular pDNA. Horizontal black marks indicate the means ± SD, n = 3–6. Statistical significance of the effects of ASRE alone was evaluated by one-way ANOVA (p < 0.0001) followed by Dunnett’s test with a significant difference for 0.47 (p < 0.01), 0.94 (p < 0.0001) and 1.41 (p < 0.01) mg mL−1 ASRE.
Figure 6
Figure 6
The effects of ASRE components on the reduction of cPTIO measured as a decrease of ABS at 560 nm. (A) Representative UV-VIS spectra of 75 µg mL−1 ASRE (black; peak at 322 nm), 20 µmol L−1 CGA (green; peak at 325 nm), 50 µmol L−1 CA (red; peak at 285 nm), 50 µmol L−1 PCA (pink; peak at 250 nm), 25 µmol L−1 EB (blue; peaks at 264 and 220 nm) and 50 µmol L−1 EE (cyan; peak at 270 nm). Buffer: 100 mmol L−1 sodium phosphate, 100 µmol L−1 DTPA, pH 7.4, 37 °C. (B) Time dependence of ABS at 560 nm of the Na2S/CGA/cPTIO mixture. ABS of the CGA/cPTIO (50/100 in µmol L−1) mixture without (green) and with 5 (red), 10 (blue), 20 (dash black), 25 (dark cyan), 50 (pink) and 100 (dark yellow) µmol L−1 Na2S. The addition of CGA into cPTIO is marked by the left arrow, and the subsequent addition of Na2S by the right arrow. ABS of the Na2S/cPTIO (20/100 in µmol L−1) mixture with 20 (dotted black), 50 (dash black) and 100 (black) µmol L−1 CGA. Buffer: 100 mmol L−1 sodium phosphate, 100 µmol L−1 DTPA, pH 7.4, 37 °C. (C) The ABS at 560 nm in the tenth min after 50 µmol L−1 addition of CA (red, circle), CGA (blue, triangle), PCA (green, square), EB (pink, star) and EE (cyan, open triangle) to the cPTIO (100 µmol L−1) containing increased concentration of Na2S. Buffer: 100 mmol L−1 sodium phosphate, 100 µmol L−1 DTPA, pH 7.4, 37 °C.
Figure 7
Figure 7
The effect of ASRE components CA, CGA and PCA in a mixture with Na2S4 on the reduction of cPTIO. (A) Representative time dependence of ABS at 560 nm of cPTIO (100 µmol L−1) with 25 (dash lines) and 50 (full lines) µmol L−1 of CA (red), CGA (blue), PCA (green), EB (pink) and EE (cyan). Addition of compounds is marked by arrow. (B) Representative time dependence of ABS of Na2S4/cPTIO (10/100 in µmol L−1) at 560 nm (black) and after addition of 50 µmol L−1 of CA (red), CGA (blue), PCA (green), EB (pink) and EE (cyan). Addition of Na2S4 is marked by the left arrow and addition of compounds by the right arrow. (C) Comparison of ABS values at 560 nm in the tenth minutes after application of 100 µmol L−1 ●cPTIO alone (black) and with 10 µmol L−1 Na2S4 (gray), 25 or 50 µmol L−1 ASRE components (red) and with the ASRE component/Na2S4 (25/10 or 50/10 in µmol L−1) mixture (blue). Green bars represent the calculated average sum effects of Na2S4/cPTIO (10/100 in µmol L−1, gray) and cPTIO with CA, CGA and PCA (25 or 50 µmol L−1, red).
Figure 8
Figure 8
Time dependence of ABS at 560 nm of cPTIO (100 µmol L−1) in the presence of the ASRE component with Cys or GSH. (A) ABS of the Cys/cPTIO (50/100 in µmol L−1, black) mixture with 50 µmol L−1 of CA (red, dash-dot, dotted), CGA (blue, dash-dot, dotted), PCA (green, dotted), EB (pink) and EE (cyan). (B) ABS of the GSH/cPTIO (50/100 in µmol L−1, black) mixture with 50 µmol L−1 of CA (red, dash-dot), CGA (blue, dash-dot), PCA (green, dash-dot), EB (pink) and EE (cyan); n = 2 or 3. The addition of the compound to cPTIO is marked by the left arrow, and the subsequent addition of Cys or GSH by the right arrow. Buffer: 100 mmol L−1 sodium phosphate, 100 µmol L−1 DTPA, pH 7.4, 37 °C.
Figure 9
Figure 9
The concentration-dependent effects of the ASRE components on polysulfide-induced pDNA cleavage in the 25 mmol L−1 sodium phosphate buffer, 50 μmol L−1 DTPA, pH 7.4, 37 °C. Control pDNA without any treatment (triangle). The concentration-dependent effects of CA (A), CGA (B), PCA (C) and EB (D) in the presence of 100 μmol L−1 Na2S (green), Na2S2 (red) or Na2S4 (blue). IR of ncDNA form represents the relative intensity of the nicked circular pDNA. Data represent average of 3–6 values for concentrations of 0.2, 0.8 and 1.6 mmol L−1 and 1–3 values for 0.4 and 1.2 mmol L−1 concentrations. Horizontal black marks indicate means ± SD.

Similar articles

Cited by

References

    1. Panossian A., Brendler T. The Role of Adaptogens in Prophylaxis and Treatment of Viral Respiratory Infections. Pharmaceuticals. 2020;13:236. doi: 10.3390/ph13090236. - DOI - PMC - PubMed
    1. Jia A., Zhang Y., Gao H., Zhang Z., Zhang Y., Wang Z., Zhang J., Deng B., Qiu Z., Fu C. A review of Acanthopanax senticosus (Rupr and Maxim.) harms: From ethnopharmacological use to modern application. J. Ethnopharmacol. 2021;268:113586. doi: 10.1016/j.jep.2020.113586. - DOI - PubMed
    1. Li X., Chen C., Leng A., Qu J. Advances in the Extraction, Purification, Structural Characteristics and Biological Activities of Eleutherococcus senticosus Polysaccharides: A Promising Medicinal and Edible Resource with Development Value. Front. Pharmacol. 2021;12:753007. doi: 10.3389/fphar.2021.753007. - DOI - PMC - PubMed
    1. Vaško L., Vašková J., Fejerčáková A., Mojžišová G., Poráčová J. Comparison of some antioxidant properties of plant extracts from Origanum vulgare, Salvia officinalis, Eleutherococcus senticosus and Stevia rebaudiana. Vitr. Cell. Dev. Biol. Anim. 2014;50:614–622. doi: 10.1007/s11626-014-9751-4. - DOI - PubMed
    1. Kim Y.H., Cho M.L., Kim D.B., Shin G.H., Lee J.H., Lee J.S., Park S.O., Lee S.J., Shin H.M., Lee O.H. The antioxidant activity and their major antioxidant compounds from Acanthopanax senticosus and A. koreanum. Molecules. 2015;20:13281–13295. doi: 10.3390/molecules200713281. - DOI - PMC - PubMed

LinkOut - more resources