. 2022 Aug 30;22(17):6528.
doi: 10.3390/s22176528.

How Reliable Are Ultra-Short-Term HRV Measurements during Cognitively Demanding Tasks?

Affiliations

How Reliable Are Ultra-Short-Term HRV Measurements during Cognitively Demanding Tasks?

André Bernardes et al. Sensors (Basel). .

Abstract

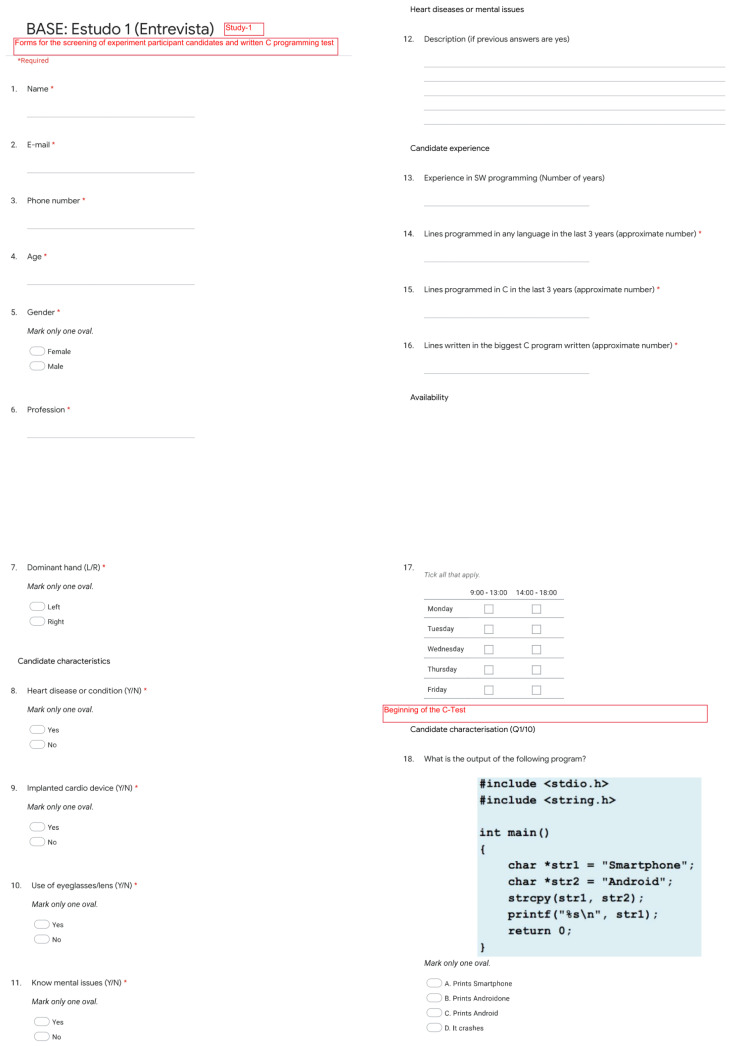
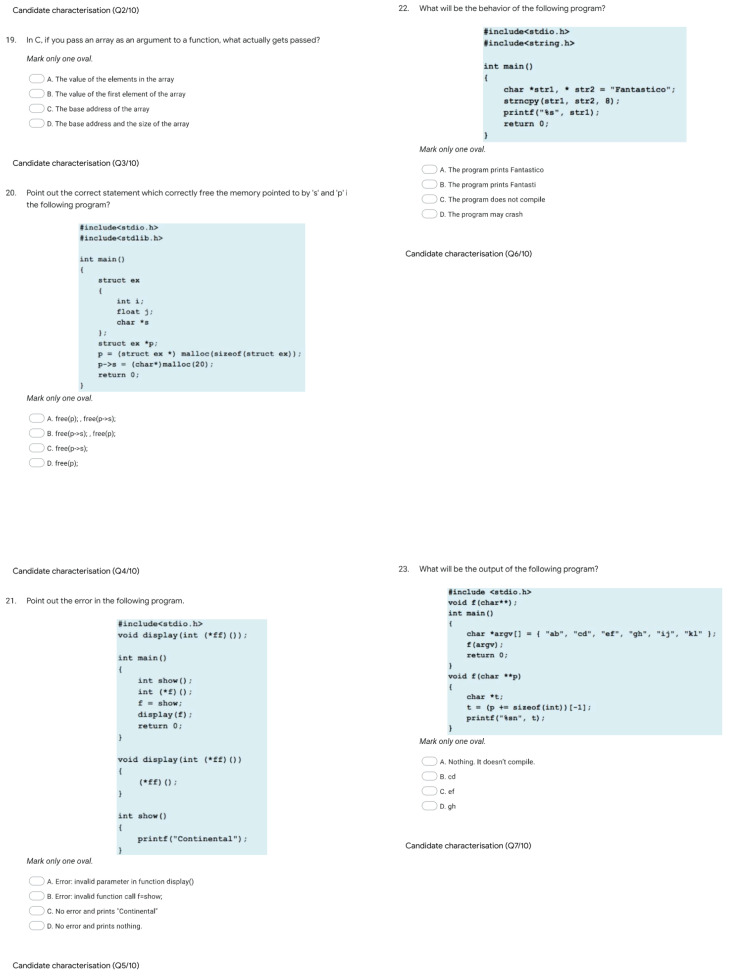
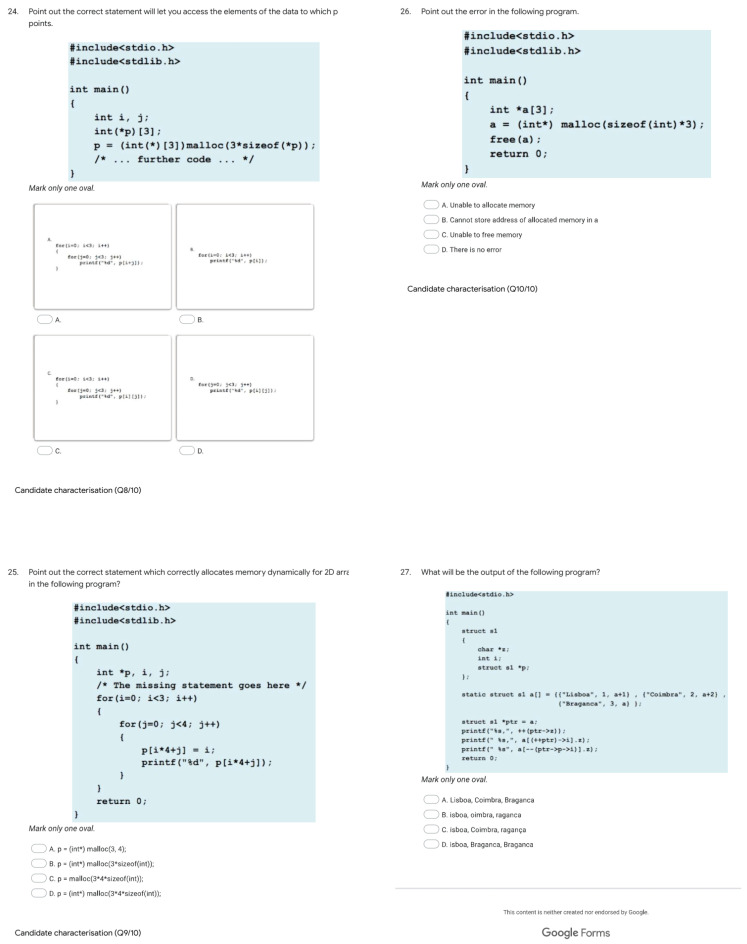
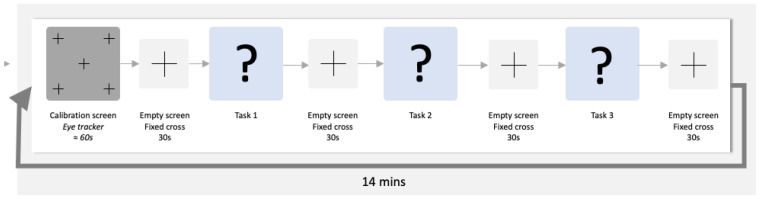
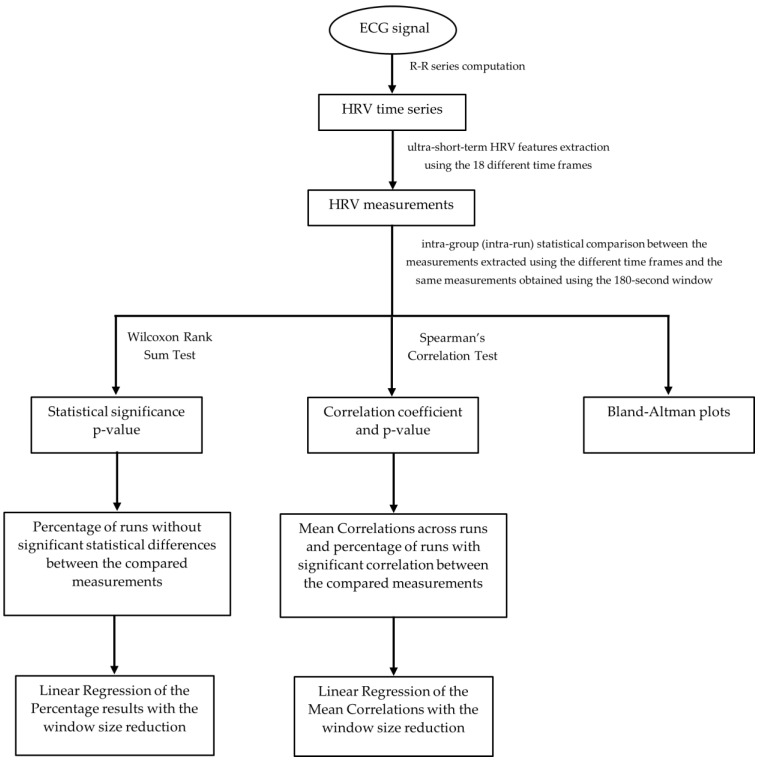
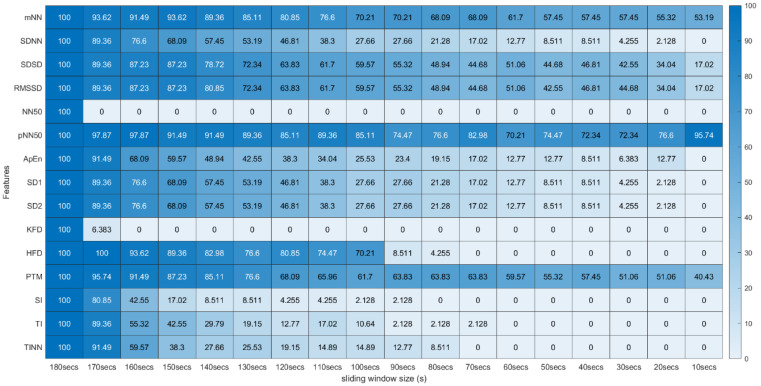
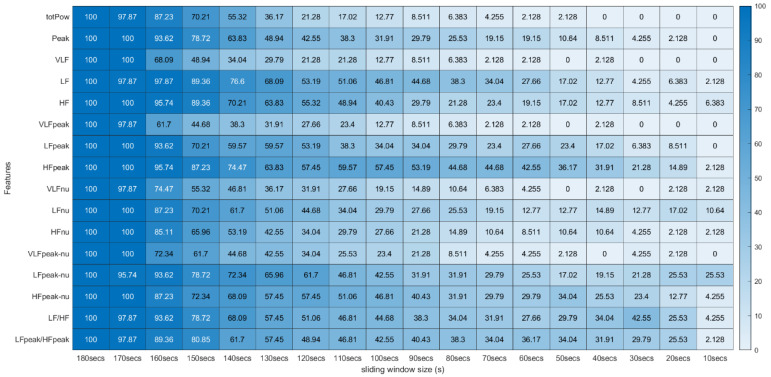
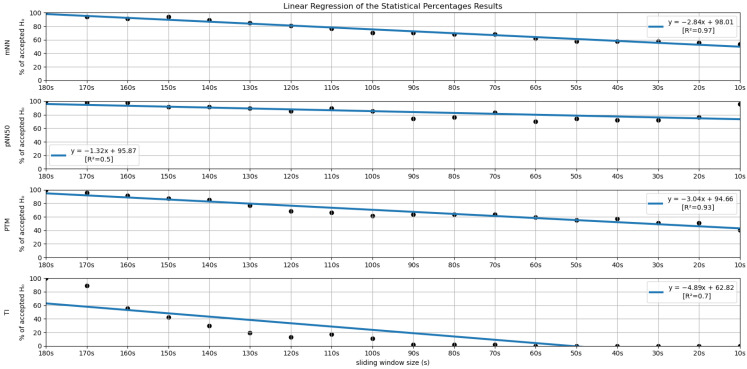
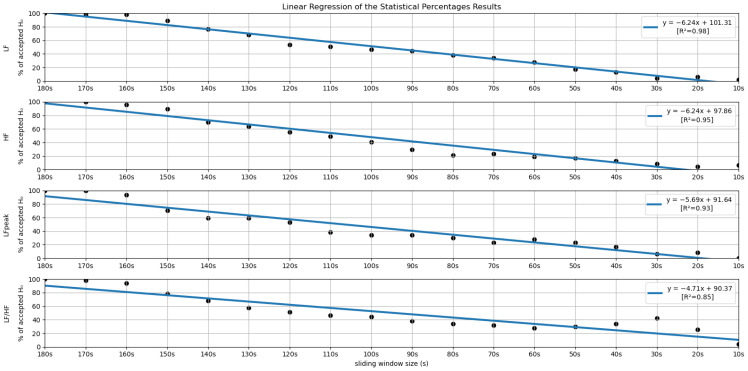
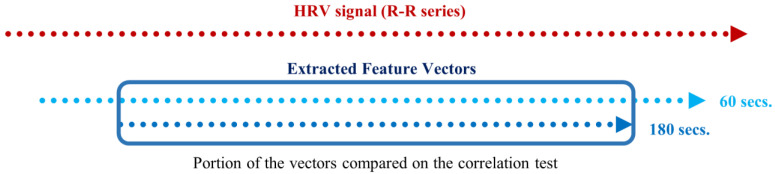
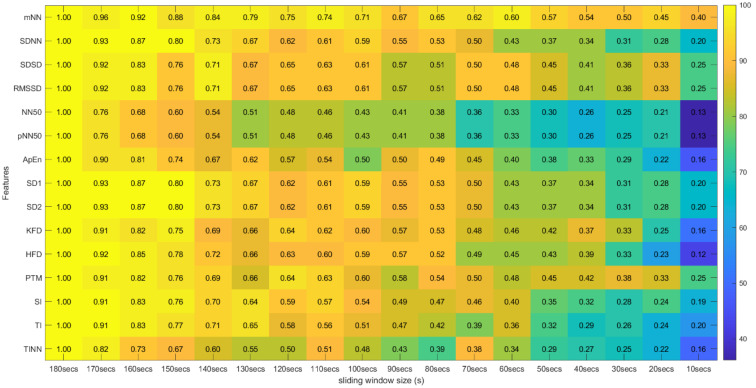
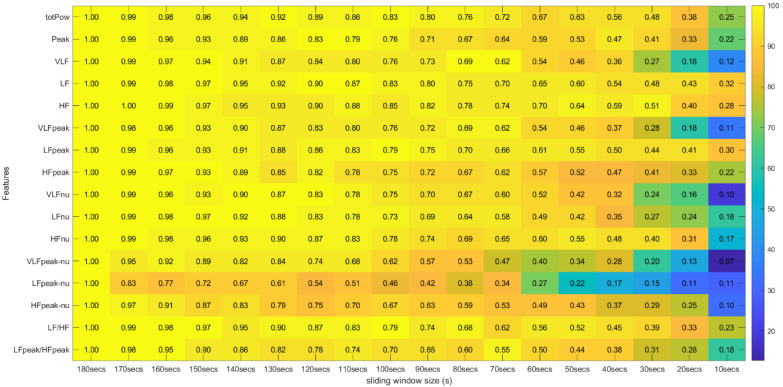
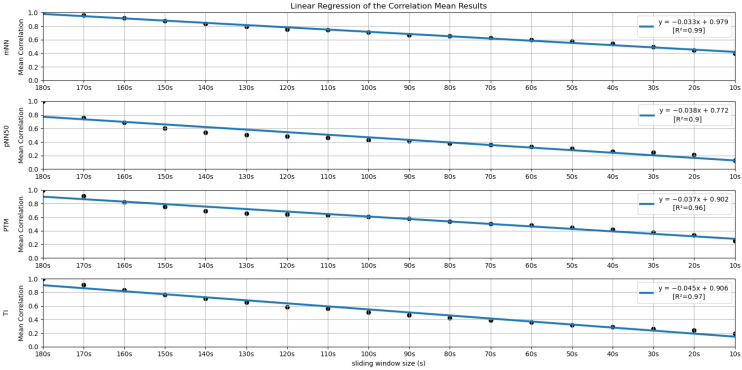
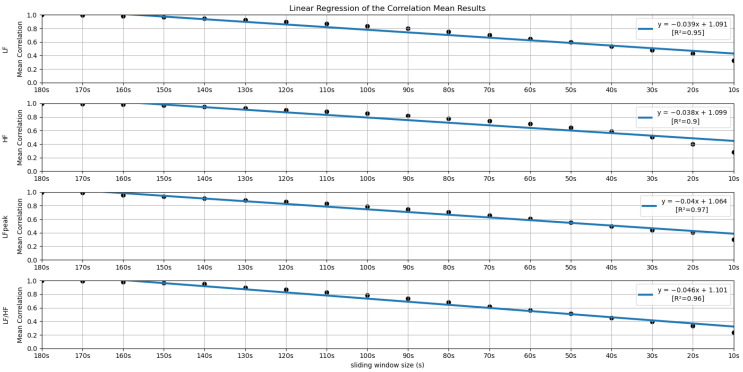
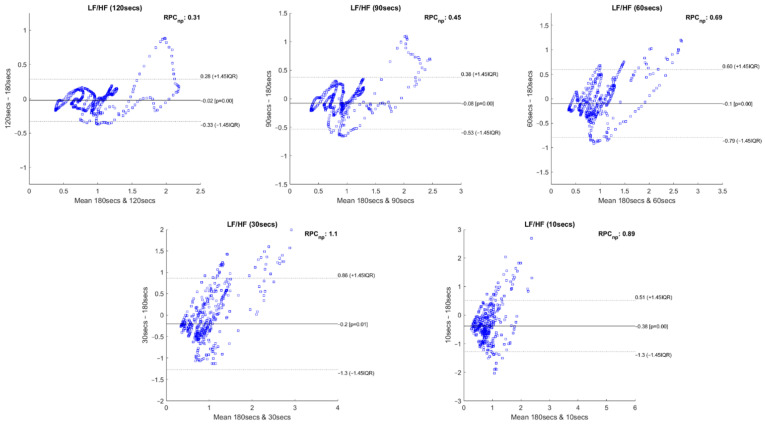
Ultra-short-term HRV features assess minor autonomous nervous system variations such as variations resulting from cognitive stress peaks during demanding tasks. Several studies compare ultra-short-term and short-term HRV measurements to investigate their reliability. However, existing experiments are conducted in low cognitively demanding environments. In this paper, we propose to evaluate these measurements' reliability under cognitively demanding tasks using a near real-life setting. For this purpose, we selected 31 HRV features, extracted from data collected from 21 programmers performing code comprehension, and compared them across 18 different time frames, ranging from 3 min to 10 s. Statistical significance and correlation tests were performed between the features extracted using the larger window (3 min) and the same features extracted with the other 17 time frames. We paired these analyses with Bland-Altman plots to inspect how the extraction window size affects the HRV features. The main results show 13 features that presented at least 50% correlation when using 60-second windows. The HF and mNN features achieved around 50% correlation using a 30-second window. The 30-second window was the smallest time frame considered to have reliable measurements. Furthermore, the mNN feature proved to be quite robust to the shortening of the time resolution.

Keywords: code comprehension; cognitively demanding tasks; correlation; statistical significance; ultra-short-term HRV features.


Conflict of interest statement

All the authors of this paper declare no conflict of interest. The funders did not take part in the study design, collection and analyses of data or in the writing of the manuscript. The decision to publish the results was made by the authors without the interference of the funders.

Figures

Figure A1
Figure A1
Programming experience questionnaire (questions 1 to 17) and technical questionnaire subpart (question 18).
Figure A2
Figure A2
Technical questionnaire subpart (question 19 to 23).
Figure A3
Figure A3
Technical questionnaire subpart (question 24 to 27).
Figure 1
Figure 1
Schematic representation of an experiment run.
Figure 2
Figure 2
Equipment set-up used in the experiment.
Figure 3
Figure 3
Schematic representation of the extraction of a feature using one of the sliding windows. In the end, we obtained a total of 558 feature vectors, corresponding to the 31 features times 18 window sizes for each experiment run.
Figure 4
Figure 4
General Flow Chart of the experimental steps followed to evaluate the ultra-short-term HRV measurements’ reliability.
Figure 5
Figure 5
Wilcoxon Rank Sum Test (Time, Non-Linear and Geometrical Domain) * Percentage of runs where the feature (line) extracted with a respective window size (column) did not present significant statistical differences compared to the same feature extracted using the 180-second window.
Figure 6
Figure 6
Wilcoxon Rank Sum Test (Frequency Domain) *. * Percentage of runs where the feature (line) extracted with a respective window size (column) did not present significant statistical differences compared to the same feature extracted using the 180-second window.
Figure 7
Figure 7
Linear Regressions of the Statistical Percentages obtained for the features mNN, pNN50, PTM and TI.
Figure 8
Figure 8
Linear Regressions of the Statistical Percentages obtained for the features LF, HF, LFpeak and LF/HF.
Figure 9
Figure 9
Schematic of the portion of two feature vectors compared in the correlation test, extracted using 180- and 60-second sliding windows with 1-second steps.
Figure 10
Figure 10
Spearman’s Correlation Test (Time, Non-Linear and Geometrical Domains) ** Heatmap Colors: Percentage of runs where there exists significant correlation between the feature (row) extracted using the respective window size (column) and the same feature obtained using the 180-second sliding window. Cell Values: Means, across the different runs, of the correlation coefficients between the feature (row) extracted using the respective window size (column) and the same feature obtained using the 180-second sliding window.
Figure 11
Figure 11
Spearman’s Correlation Test (Frequency Domain) ** Heatmap Colors: Percentage of runs where there exists significant correlation between the feature (row) extracted using the respective window size (column) and the same feature obtained using the 180-second sliding window. Cell Values: Means, across the different runs, of the correlation coefficients between the feature (row) extracted using the respective window size (column) and the same feature obtained using the 180-second sliding window.
Figure 12
Figure 12
Linear Regressions of the Mean Correlations across runs obtained for the features mNN, pNN50, PTM and TI.
Figure 13
Figure 13
Linear Regressions of the Mean Correlations across runs obtained for the features LF, HF, LFpeak and LF/HF.
Figure 14
Figure 14
Bland–Altman plots of the LF/HF feature extracted with 120-, 90-, 60-, 30- and 10-second time frames compared to the LF/HF extracted with 180-second time frame, regarding a single experimental run of an individual subject.

References

    1. Shaffer F., Ginsberg J.P. Ginsberg. An overview of heart rate variability metrics and norms. Front. Public Health. 2017;5:258. doi: 10.3389/fpubh.2017.00258. - DOI - PMC - PubMed
    1. Pecchia L., Castaldo R., Montesinos L., Melillo P. Are ultra-short heart rate variability features good surrogates of short-term ones? State-of-the-art review and recommendations. Healthc. Technol. Lett. 2018;5:94–100. doi: 10.1049/htl.2017.0090. - DOI - PMC - PubMed
    1. Forte G., Favieri F., Casagrande M. Heart rate variability and cognitive function: A systematic review. Front. Neurosci. 2019;13:710. doi: 10.3389/fnins.2019.00710. - DOI - PMC - PubMed
    1. Boardman A., Schlindwein F.S., Rocha A.P., Leite A. A study on the optimum order of autoregressive models for heart rate variability. Physiol. Meas. 2002;23:325. doi: 10.1088/0967-3334/23/2/308. - DOI - PubMed
    1. Shaffer F., Meehan Z.M., Zerr C.L. A critical review of ultra-short-term heart rate variability norms research. Front. Neurosci. 2020;14:594880. doi: 10.3389/fnins.2020.594880. - DOI - PMC - PubMed

MeSH terms