

Acoustic Limescale Layer and Temperature Measurement in Ultrasonic Flow Meters
- PMID: 36081105
- PMCID: PMC9460453
- DOI: 10.3390/s22176648
Acoustic Limescale Layer and Temperature Measurement in Ultrasonic Flow Meters
Abstract
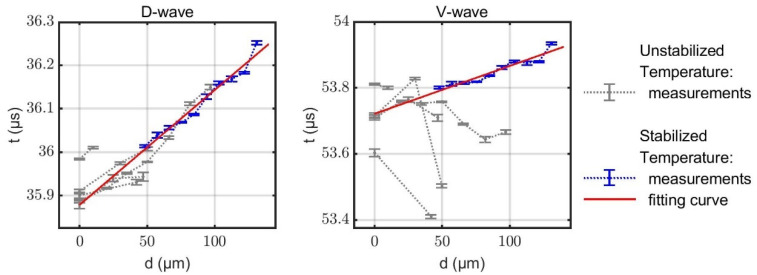
Guided acoustic waves are commonly used in domestic water meters to measure the flow rate. The accuracy of this measurement method is affected by factors such as variations in temperature and limescale deposition inside of the pipe. In this work, a new approach using signals from different sound propagation paths is used to determine these quantities and allow for subsequent compensation. This method evaluates the different propagation times of guided Lamb waves in flow measurement applications. A finite element method-based model is used to identify the calibration curves for the device under test. The simulated dependencies on temperature and layer thickness are validated by experimental data. Finally, a test on simulated data with varying temperatures and limescale depositions proves that this method can be used to separate both effects. Based on these values, a flow measurement correction scheme can be derived that provides an improved resolution of guided acoustic wave-based flow meters.
Keywords: FEM simulation; Lamb waves; flow metering; guided acoustic waves; limescale layers; predictive maintenance; product lifetime extension; temperature compensation; ultrasound.
Conflict of interest statement
The publication resulted from the cooperation between Diehl Metering and the Institute for Sensor and Actuator Technology from Coburg University of Applied Sciences and Arts. The research was financed by Diehl Metering.
Figures


References
-
- Chen T., Wang Q. Water-Formed Deposits. Elsevier; Amsterdam, The Netherlands: 2000. Mineral scale deposits—Analysis and interpretation; pp. 783–794. - DOI
-
- Nayfeh A.H., Nagy P.B. Excess attenuation of leaky Lamb waves due to viscous fluid loading. J. Acoust. Soc. Am. 1997;101:2649–2658. doi: 10.1121/1.418506. - DOI
-
- Kocsis D. Modeling and vibration analysis of limescale deposition in geothermal pipes. Environ. Eng. Manag. J. 2014;13:2817–2824. doi: 10.30638/eemj.2014.315. - DOI
-
- Sohaili J., Shi H.S., Lavania-Baloo, Zardari N.H., Ahmad N., Muniyandi S.K. Removal of scale deposition on pipe walls by using magnetic field treatment and the effects of magnetic strength. J. Clean. Prod. 2016;139:1393–1399. doi: 10.1016/j.jclepro.2016.09.028. - DOI
MeSH terms
LinkOut - more resources
Full Text Sources
