. 2022 Aug 23:13:978715.
doi: 10.3389/fimmu.2022.978715. eCollection 2022.

Analysis of immune status in gastric adenocarcinoma with different infiltrating patterns and origin sites

Affiliations

Analysis of immune status in gastric adenocarcinoma with different infiltrating patterns and origin sites

Nana Zhang et al. Front Immunol. .

Abstract

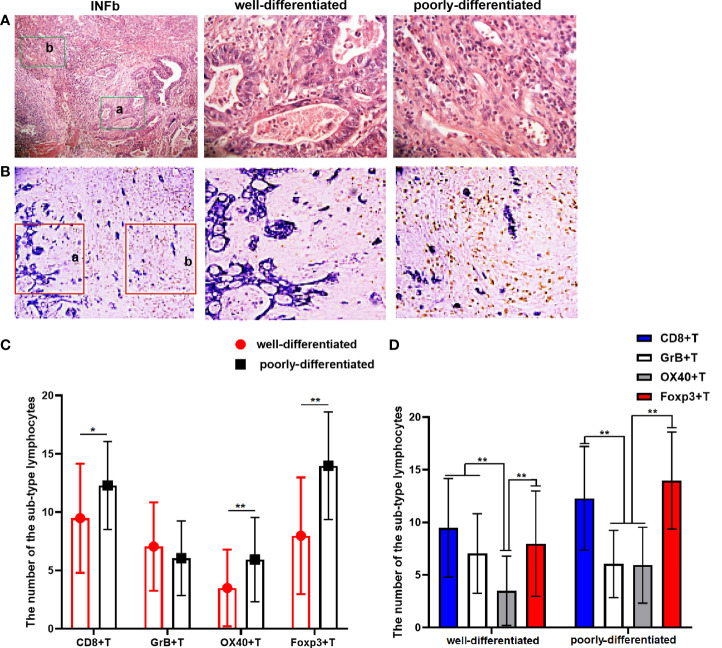
Tumor infiltration pattern (INF) and tumor origin site were reported to significantly affect the prognosis of gastric cancer (GC), while the immune status under these contexts is not clear. In this study, we correlated the density and phenotype of tumor-infiltrating lymphocytes (TILs) with INF and the tumor origin site to reflect the biological behavior of tumors from a new perspective and also determined their effects on overall survival (OS) and other related clinicopathological features in archival samples of 147 gastric cancers with 10-year follow-up data. We found that the INFc growth pattern (an invasive growth without a distinct border) of GC lacked immune cell infiltration, particularly the cytotoxic T cells and their activated form. It is also significantly associated with an unfavorable prognosis (P < 0.001) and proximal site (P = 0.001), positive lymph node metastasis (P = 0.002), and later tumor-node-metastasis stage (P < 0.001). Moreover, the density and sub-type of TILs infiltration were significantly different in disparate differentiated areas for the tumor tissue with INFb. Compared with distal gastric cancer, proximal gastric cancers were prone to grow in an INFc pattern (P = 0.001) and infiltrated with fewer TILs, experiencing a shorter survival time (P = 0.013). Multivariate analysis showed that only the INF and the density of TILs were demonstrated to be the independent prognostic factors of OS for the GC. We concluded that GC with an aggressive growth pattern arising from proximal sites always had a weak immune response and resulted in a poor prognosis. The interaction between them and their synergistic or antagonistic effects in the development of tumors need to be further studied. This study opens up a new perspective for research on the biological behavior of the tumor.

Keywords: gastric adenocarcinoma; immune status; tumor infiltration pattern; tumor origin site; tumor-infiltrating lymphocytes.


Conflict of interest statement

The authors declare that the research was conducted in the absence of any commercial or financial relationships that could be construed as a potential conflict of interest.

Figures

Figure 1
Figure 1
(A) Representative patterns of the three types of tumor infiltrating growth (INF) pattern of INFa, INFb, and INFc (×100) in the H&E staining slides. (B, C) Corresponding Kaplan–Meier survival curves for proximal gastric cancer (PGC) and distal gastric cancer as well as the different types of INF, respectively. The tumor from the PGC (P = 0.013) and infiltrating with INFc (P < 0.001) suffered a shorter overall survival. The degree of difference is expressed by the asterisk symbols: **P < 0.001 and *P < 0.05.
Figure 2
Figure 2
(A, B) Graphs showing the four sub-types of tumor-infiltrating lymphocytes (TILs) distribution in proximal gastric cancer (PGC) and distal gastric cancer (DGC). The total number of TILs (P = 0.033) and the GrB+T (P = 0.003) cell infiltrates were significantly attenuated in PGC (A). The CD8+T cells possess a numerical advantage in DGC (P < 0.001) as for the investigated sub-type of immune cells. The number of Foxp3+T cells was also quantitatively superior to OX40+T (P < 0.001) and GrB+T (P < 0.001) cells in DGC and PGC (B).The functional Treg cell (OX40+/FOXP3+) percentage was significantly higher in the PGC compared with that in DGC (P = 0.009) (C). The degree of difference is expressed by the asterisk symbols: **P < 0.001 and *P < 0.05.
Figure 3
Figure 3
(A, C) Graphs showing the four sub-types of tumor-infiltrating lymphocyte distribution in cancer tissues with different types of tumor infiltration pattern (INF). The number of total immune cell infiltrates was less in INFc than that in INFa (P < 0.001) or INFb (P = 0.001) (A). The number of CD8+T cells occupied a quantitatively dominant position (P = 0.001) in the INFa cases (C). Representative double-immunohistochemistry staining for the tumor cells (purple–blue) and CD8+T cells (brown, yellow arrow) in gastric cancer tissue with different types of INF, and the lower pictures (×400) are the corresponding enlargement of the local area (red, rectangular) for the upper pictures (×100) (B). The relative percentage of activated immune cell populations for CD8+ (GrB+/CD8+) is significantly higher in the INFb group compared with that in INFc (P = 0.02) (D). The degree of difference is expressed by the asterisk symbols: **P < 0.001 and *P < 0.05.
Figure 4
Figure 4
(A) The H&E staining result shows that there are significant differentiation differences regions in gastric cancer (GC) tissue with INFb growth pattern. The latter two pictures (×400) are local magnifications of the a and b (green rectangular) regions in the first picture (×100). (B) Double-immunohistochemistry staining representative image for CD8+T cells’ (brown) distribution in GC tissue with INFb. The latter two pictures (×200) are their corresponding enlargement of the local area (red rectangular) for the first pictures (×100) and represent the well and poorly differentiated region, respectively. (C, D) Graphs showing the four sub-types of tumor-infiltrating lymphocyte distributed differently according to the cancer cell differentiation in GC tissues with INFb. The degree of difference is expressed by the asterisk symbols: **P < 0.001 and *P < 0.05.

References

    1. Sung H, Ferlay J, Siegel RL, Laversanne M, Soerjomataram I, Jemal A, et al. . Global cancer statistics 2020: globocan estimates of incidence and mortality worldwide for 36 cancers in 185 countries. CA Cancer J Clin (2021) 71(3):209–49. doi: 10.3322/caac.21660 - DOI - PubMed
    1. Smyth EC, Nilsson M, Grabsch HI, van Grieken NC, Lordick F. Gastric cancer. Lancet (2020) 396:635–48. doi: 10.1016/S0140-6736(20)31288-5 - DOI - PubMed
    1. Pernot S, Terme M, Radosevic-Robin N, Castan F, Badoual C, Marcheteau E, et al. . Infiltrating and peripheral immune cell analysis in advanced gastric cancer according to the lauren classification and its prognostic significance. Gastric Cancer (2020) 23:73–81. doi: 10.1007/s10120-019-00983-3 - DOI - PubMed
    1. The Cancer Genome Atlas Research Network. Comprehensive molecular characterization of gastric adenocarcinoma. Nature (2014) 513:202–9. doi: 10.1038/nature13480 - DOI - PMC - PubMed
    1. Xue J, Yang H, Huang S, Zhou T, Zhang X, Zu G. Comparison of the overall survival of proximal and distal gastric cancer after gastrectomy: a systematic review and meta-analysis. World J Surg Oncol (2021) 19:17. doi: 10.1186/s12957-021-02126-4 - DOI - PMC - PubMed

Publication types