. 2022 Aug 23:13:926926.
doi: 10.3389/fmicb.2022.926926. eCollection 2022.

Composition and diversity of gut microbiota in diabetic retinopathy

Affiliations

Composition and diversity of gut microbiota in diabetic retinopathy

Jianhao Bai et al. Front Microbiol. .

Abstract

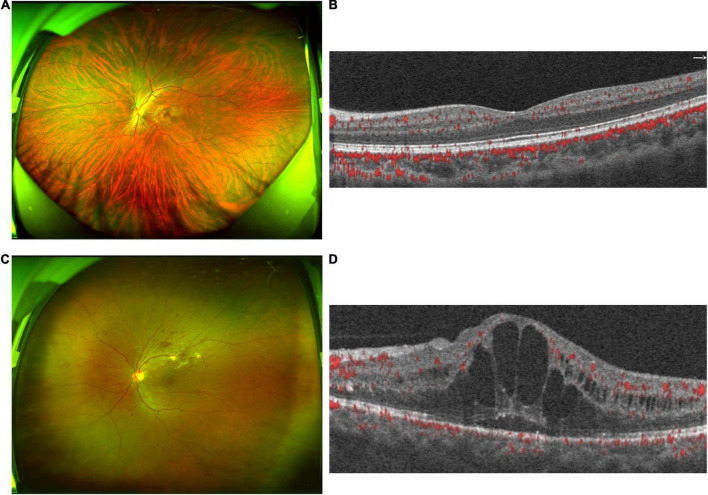
Objective: Diabetic retinopathy (DR) is one of the most common complications of type 2 diabetes mellitus. The current study investigates the composition, structure, and function of gut microbiota in DR patients and explores the correlation between gut microbiota and clinical characteristics of DR.

Methods: A total of 50 stool samples were collected from 50 participants, including 25 DR patients and 25 healthy controls (HCs). 16S ribosomal RNA gene sequencing was used to analyze the gut microbial composition in these two groups. DNA was extracted from the fecal samples using the MiSeq platform.

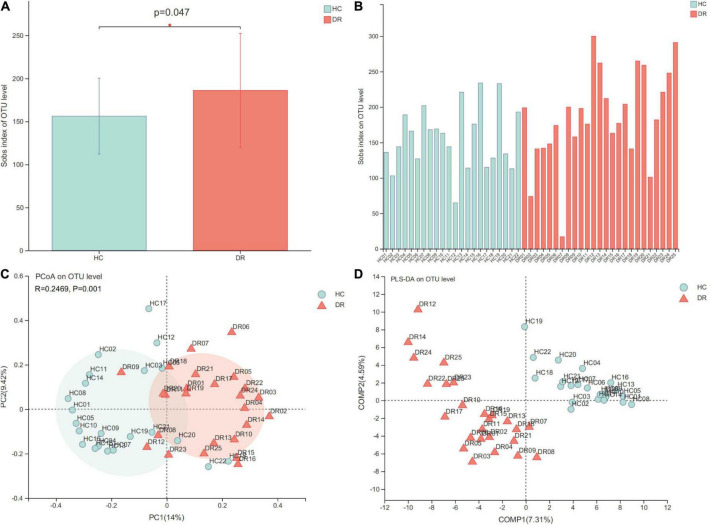
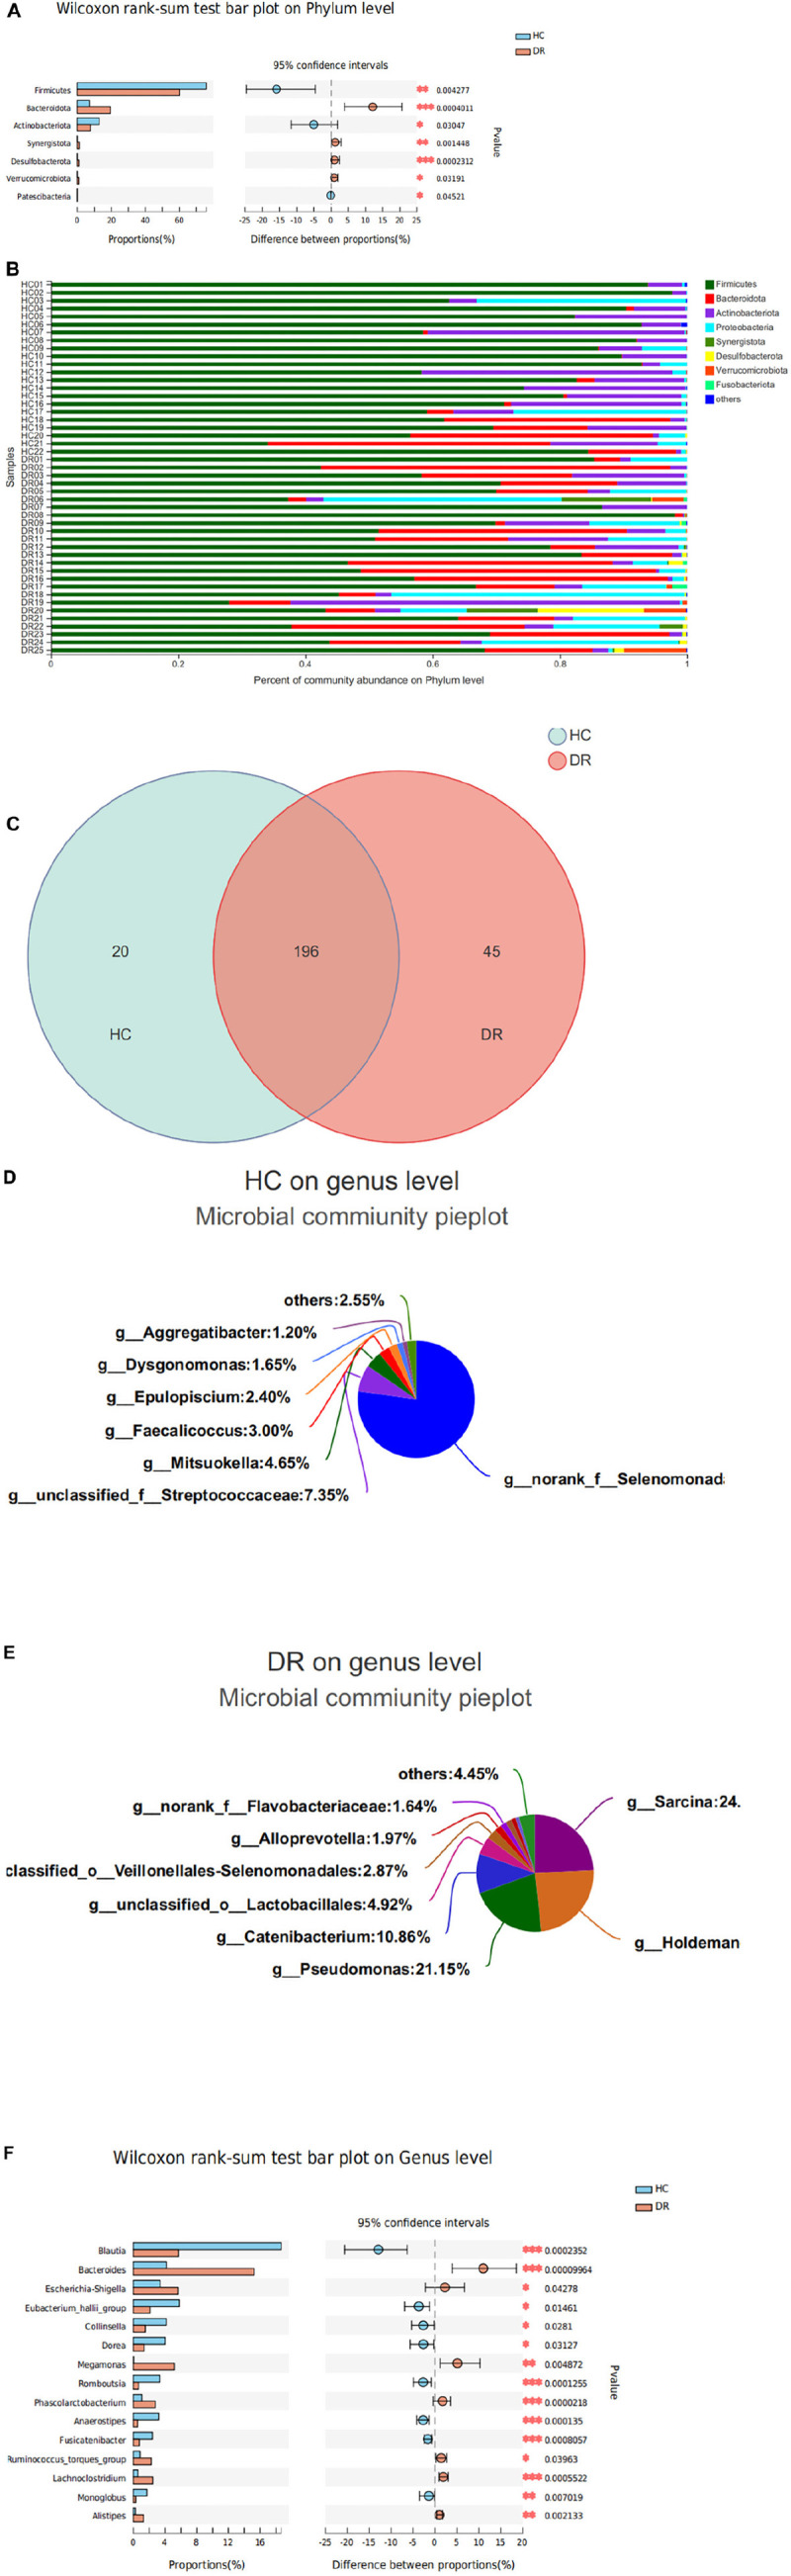
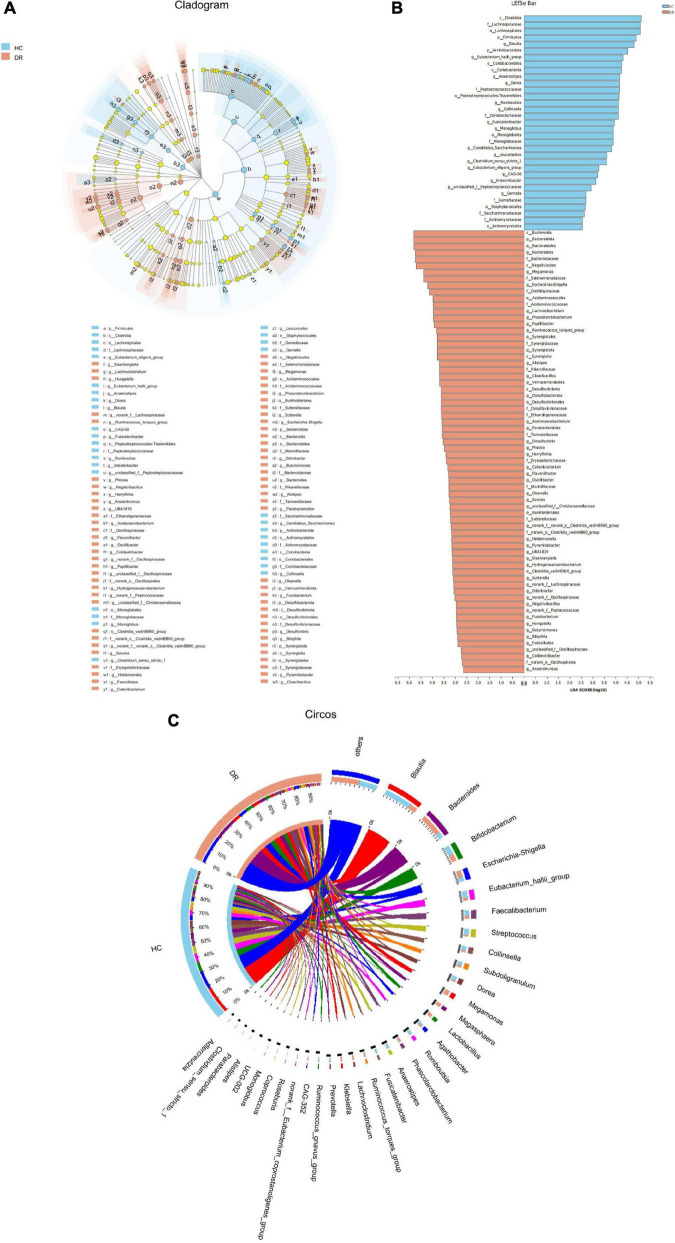
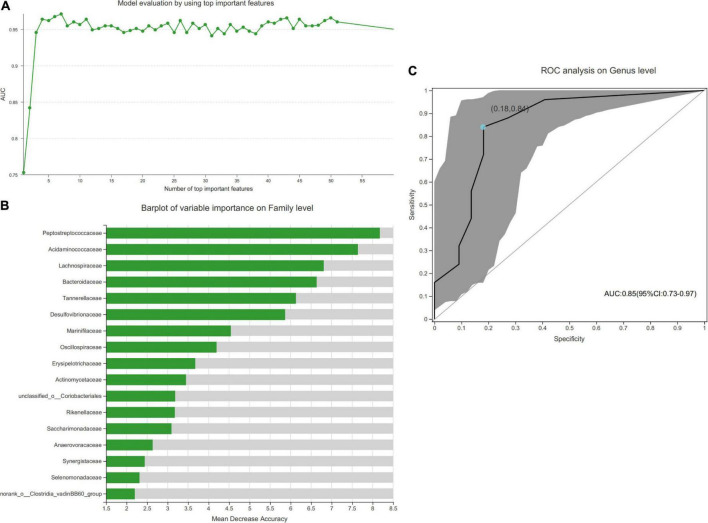
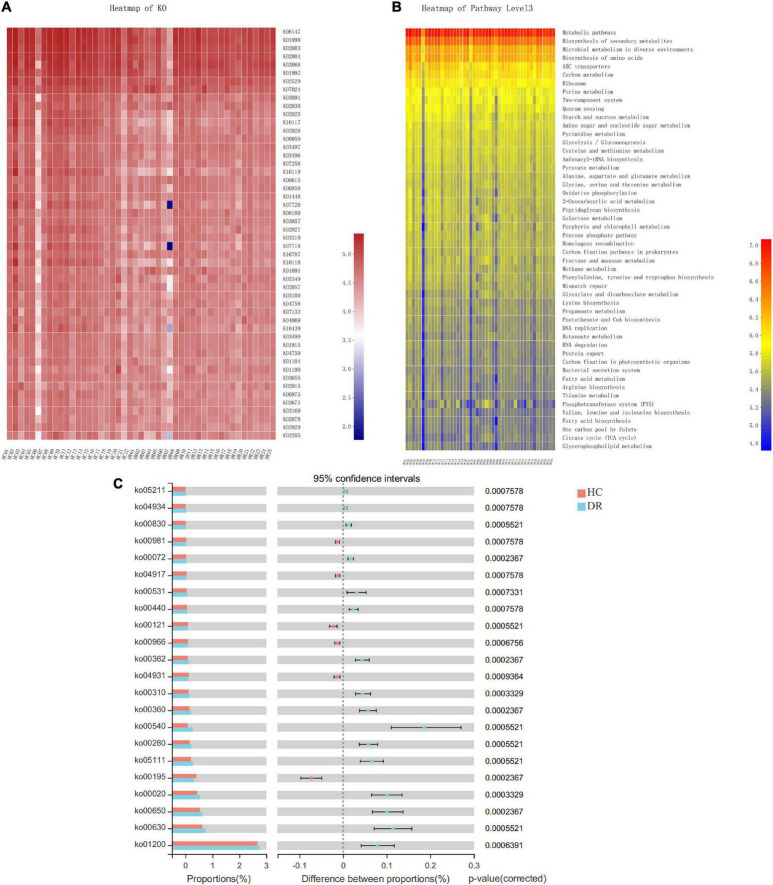
Results: The microbial structure and composition of DR patients were different from that of HCs. The microbial richness of gut microbiota in DR was higher than that of normal individuals. The alterations of microbiome of DR patients were associated with disrupted Firmicutes, Bacteroidetes, Synergistota, and Desulfobacterota phyla. In addition, increased levels of Bacteroides, Megamonas, Ruminococcus_torques_group, Lachnoclostridium, and Alistipes, and decreased levels of Blautia, Eubacterium_ hallii_group, Collinsella, Dorea, Romboutsia, Anaerostipes, and Fusicatenibacter genera were observed in the DR groups. Additionally, a stochastic forest model was developed to identify a set of biomarkers with seven bacterial genera that can differentiate patients with DR from those HC. The microbial communities exhibited varied functions in these two groups because of the alterations of the above-mentioned bacterial genera.

Conclusion: The altered composition and function of gut microbiota in DR patients indicated that gut microbiome could be used as non-invasive biomarkers, improve clinical diagnostic methods, and identify putative therapeutic targets for DR.

Keywords: 16S rRNA gene amplicon sequencing; biomarker; diabetic retinopathy; gut microbiota; human.


Conflict of interest statement

The authors declare that the research was conducted in the absence of any commercial or financial relationships that could be construed as a potential conflict of interest.

Figures

FIGURE 1
FIGURE 1
Clinical features of diabetic retinopathy (DR) patients and healthy controls (HC). (A) The ultra-wide-field fundus of HCs showed a normal structure of fundus. (B) The optical coherence tomography angiography (OCTA) images of HCs showed a normal structure of fundus. (C) The ultra-wide-field fundus ophthalmoscopy in the DR group showed retinal vascular lesions, including microaneurysms, hemorrhages, cotton wool spots, and lipid exudates. (D) OCTA images in the DR group show macular edema and retinal thickening. OCTA, optical coherence tomography angiography.
FIGURE 2
FIGURE 2
Comparison of alpha diversity and beta diversity in patients with diabetic retinopathy (DR) and healthy controls (HCs). (A) Sobs alpha diversity index is significantly increased in DR compared to HC individuals (P = 0.047 Wilcoxon rank-sum test). (B) Sobs alpha diversity index of each fecal sample. (C) Principal coordinate analysis (PCoA) plot at the operational taxonomic unit (OTU) level. (D) Partial least squares discriminant analysis (PLS-DA) showed an obvious distinction at the OTU level between the microbiota composition of the two groups. *P < 0.05.
FIGURE 3
FIGURE 3
Variations in fecal microbiota composition at the phyla and genus level in patients with diabetic retinopathy (DR) and healthy controls (HCs). (A) Three phyla were enriched in the HC group; four families were enriched in the DR group. (B) Column chart showed the same dominant species of different samples at the phylum level, but the relative abundance is different. (C) The pie chart showed the overlapped and unique genera in the two groups. Most of the genera (196) overlapped and were observed in all groups. (D) A total of 20 genera detected only in the HC group. (E) A total of 45 genera detected only in the DR group. (F) Variations in fecal microbiota composition at the genus level. *P < 0.05, **P < 0.01, ***P < 0.001.
FIGURE 4
FIGURE 4
Relative abundance of the bacterial community in patients with diabetic retinopathy (DR) and healthy controls (HCs). (A) LEfSe analysis of the fecal microbiota composition from the phylum to the genus level in the two groups. The cladogram displayed the correlations between taxa at different taxonomic levels. Each circle represents a hierarchy, followed by phylum, class, order, family, and genus. Different phyla were marked with different colors. The size of the nodes represents the taxon abundance. (B) LEfSe analysis showed the relative abundance of genera in the DR and control groups. A total of 101 bacterial taxa showed significant differences in relative abundance, with 33 and 68 distinct microbial taxa in the HC and DR groups, respectively (LDA score >2.5, P < 0.05, Kruskal–Wallis test). (C) Circos sample and species diagram reflected the correlation between samples and species. LEfSe, linear discriminant analysis effect size; LDA, linear discriminant analysis.
FIGURE 5
FIGURE 5
Disease classification based on gut microbial biomarkers. (A) The AUC-RF algorithm is used to determine a stochastic forest optimal model to maximize the area under the curve (AUC) value of the receiver operating characteristic (ROC) curve, and the number of species selected for the importance ranking is 7 when the highest AUC value is 0.9709. (B) The results of sorting 17 important species. (C) Classification performance of the multivariable logistic regression model using the combination of Blautia, Bacteroides, Megamonas, Romboutsia, and Anaerostipes was assessed based on the AUC (0.85).
FIGURE 6
FIGURE 6
Functional analysis of the predicted metagenomes. (A) Heatmap of KEGG ortholog (KO) genes among the two groups. (B) Heatmap of Kyoto Encyclopedia of Genes and Genomes (KEGG) function pathway at level 3. (C) The significantly a differential pathway at level 3 between diabetic retinopathy (DR) patients and healthy control (HC) individuals.

References

    1. Allin K. H., Tremaroli V., Caesar R., Jensen B. A. H., Damgaard M. T. F., Bahl M. I., et al. (2018). Aberrant intestinal microbiota in individuals with prediabetes. Diabetologia 61 810–820. 10.1007/s00125-018-4550-1 - DOI - PMC - PubMed
    1. Angelucci F., Cechova K., Amlerova J., Hort J. (2019). Antibiotics, gut microbiota, and Alzheimer’s disease. J. Neuroinflammation 16:108. 10.1186/s12974-019-1494-4 - DOI - PMC - PubMed
    1. Beli E., Yan Y., Moldovan L., Vieira C. P., Gao R., Duan Y., et al. (2018). Restructuring of the gut microbiome by intermittent fasting prevents retinopathy and prolongs survival in db/db Mice. Diabetes 67 1867–1879. 10.2337/db18-0158 - DOI - PMC - PubMed
    1. Bernstein C. N., Forbes J. D. (2017). Gut microbiome in inflammatory bowel disease and other chronic immune-mediated inflammatory diseases. Inflamm. Intest. Dis. 2 116–123. 10.1159/000481401 - DOI - PMC - PubMed
    1. Brahe L. K., Le Chatelier E., Prifti E., Pons N., Kennedy S., Hansen T., et al. (2015). Specific gut microbiota features and metabolic markers in postmenopausal women with obesity. Nutr. Diabetes 5:e159. 10.1038/nutd.2015.9 - DOI - PMC - PubMed

LinkOut - more resources