. 2022 Aug 23:9:791143.
doi: 10.3389/fcvm.2022.791143. eCollection 2022.

MAGI1 inhibits interferon signaling to promote influenza A infection

Affiliations

MAGI1 inhibits interferon signaling to promote influenza A infection

Yin Wang et al. Front Cardiovasc Med. .

Abstract

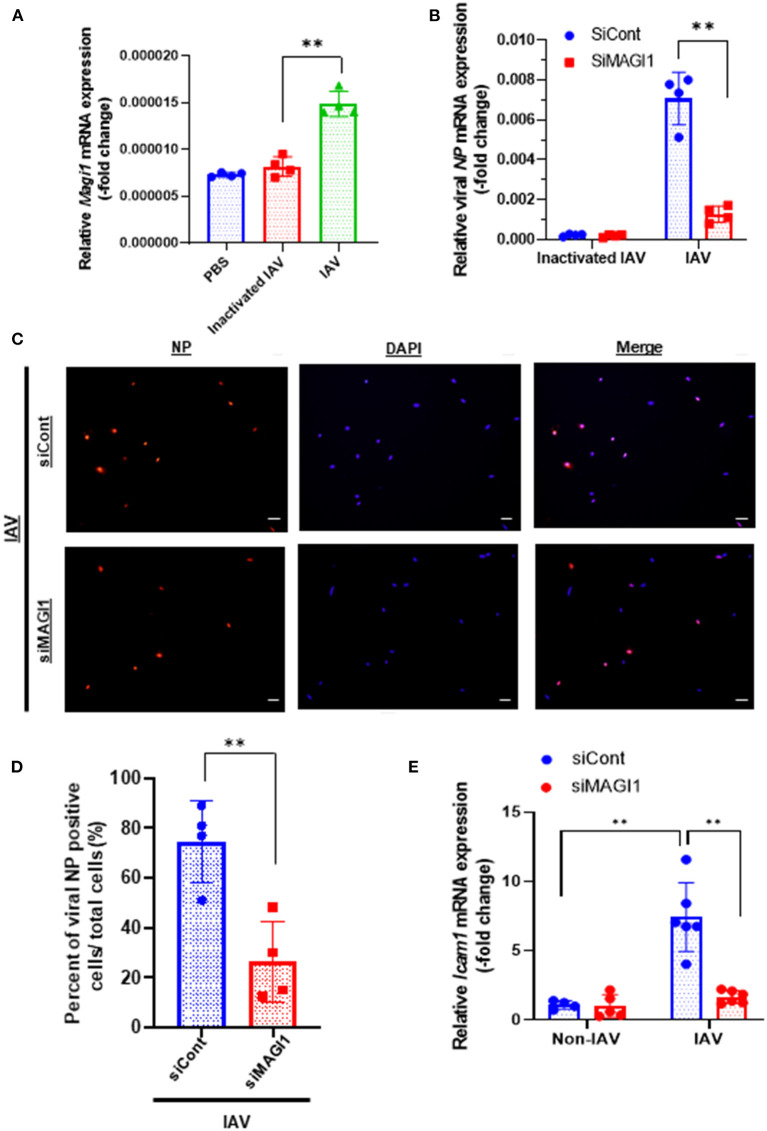
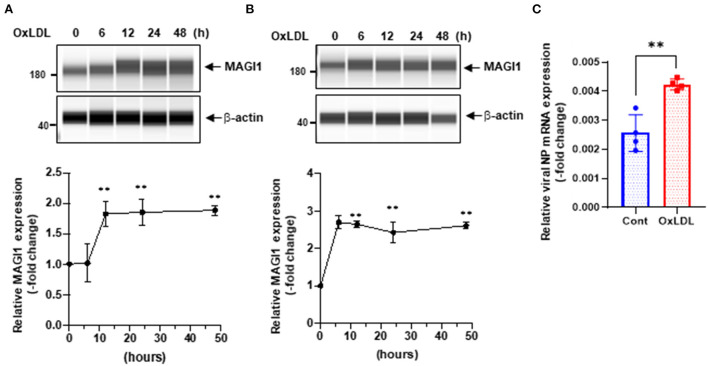
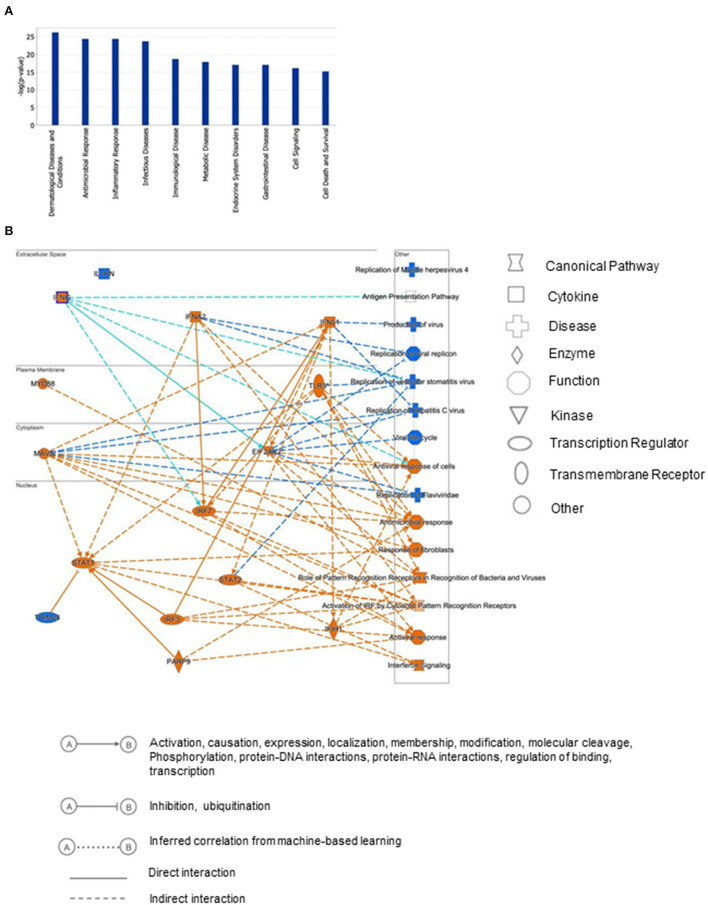
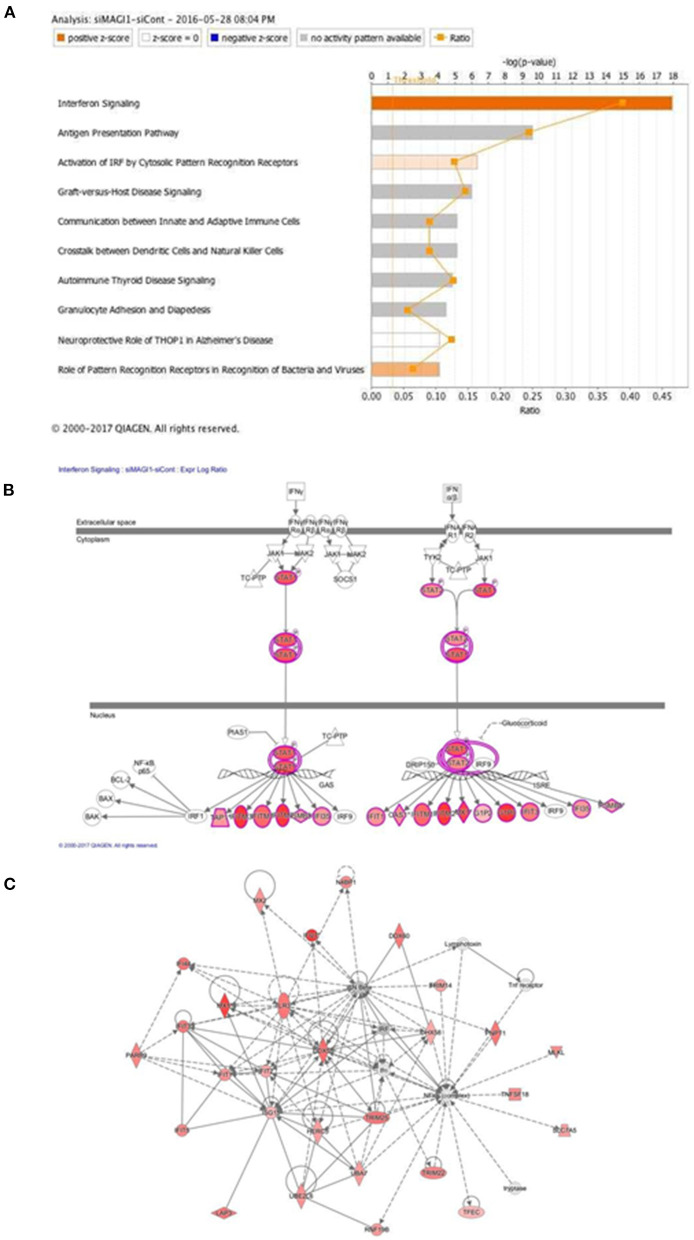
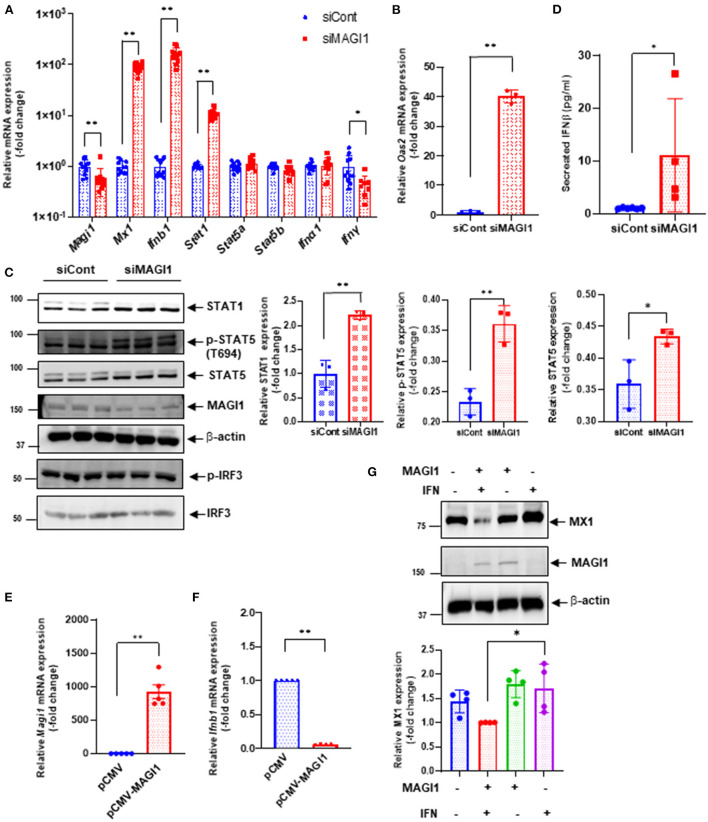
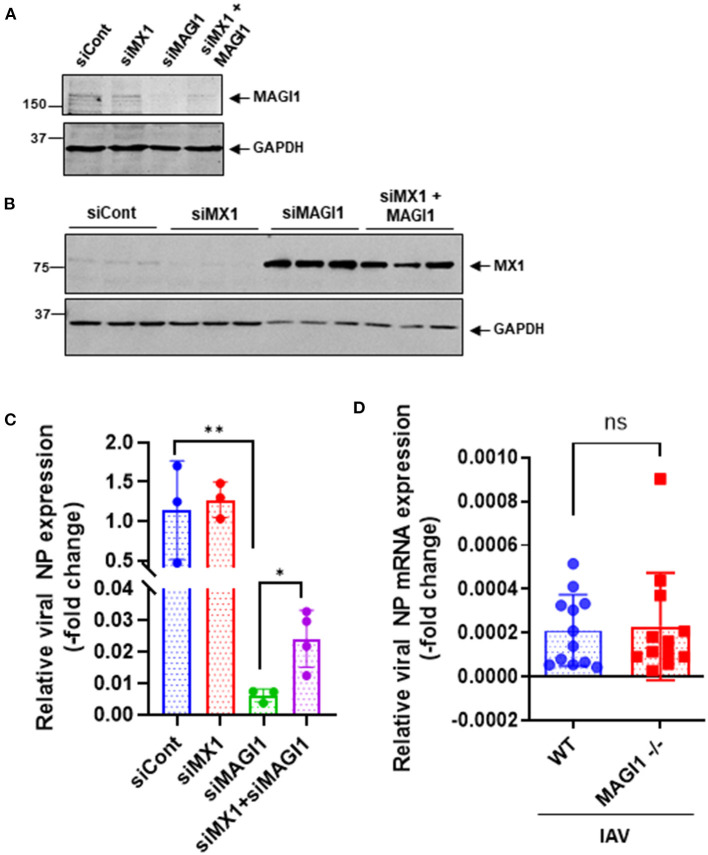
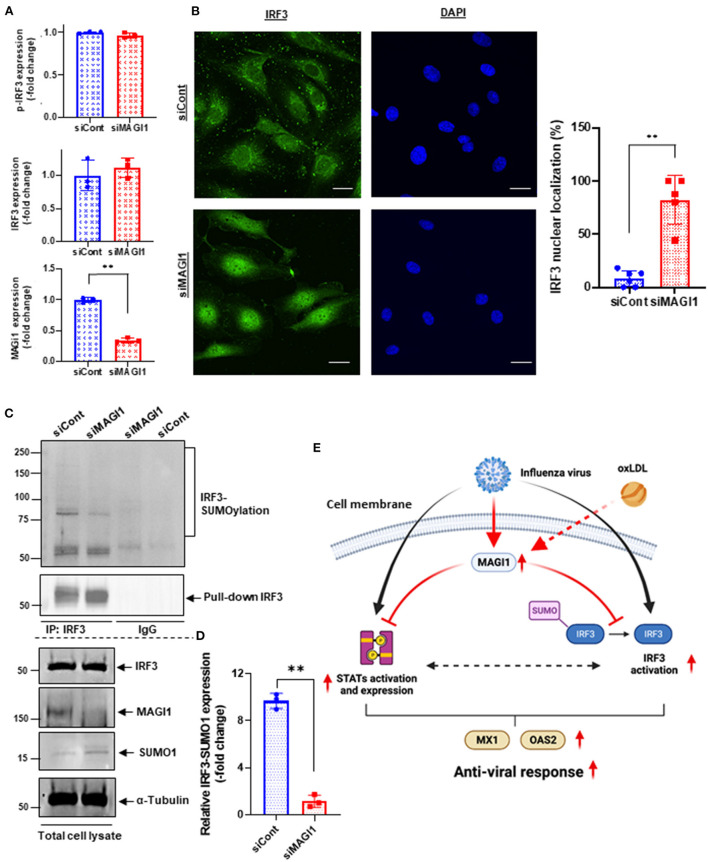
We have shown that membrane-associated guanylate kinase with inverted domain structure-1 (MAGI1), a scaffold protein with six PSD95/DiscLarge/ZO-1 (PDZ) domains, is involved in the regulation of endothelial cell (EC) activation and atherogenesis in mice. In addition to causing acute respiratory disease, influenza A virus (IAV) infection plays an important role in atherogenesis and triggers acute coronary syndromes and fatal myocardial infarction. Therefore, the aim of this study is to investigate the function and regulation of MAGI1 in IAV-induced EC activation. Whereas, EC infection by IAV increases MAGI1 expression, MAGI1 depletion suppresses IAV infection, suggesting that the induction of MAGI1 may promote IAV infection. Treatment of ECs with oxidized low-density lipoprotein (OxLDL) increases MAGI1 expression and IAV infection, suggesting that MAGI1 is part of the mechanistic link between serum lipid levels and patient prognosis following IAV infection. Our microarray studies suggest that MAGI1-depleted ECs increase protein expression and signaling networks involve in interferon (IFN) production. Specifically, infection of MAGI1-null ECs with IAV upregulates expression of signal transducer and activator of transcription 1 (STAT1), interferon b1 (IFNb1), myxovirus resistance protein 1 (MX1) and 2'-5'-oligoadenylate synthetase 2 (OAS2), and activate STAT5. By contrast, MAGI1 overexpression inhibits Ifnb1 mRNA and MX1 expression, again supporting the pro-viral response mediated by MAGI1. MAGI1 depletion induces the expression of MX1 and virus suppression. The data suggests that IAV suppression by MAGI1 depletion may, in part, be due to MX1 induction. Lastly, interferon regulatory factor 3 (IRF3) translocates to the nucleus in the absence of IRF3 phosphorylation, and IRF3 SUMOylation is abolished in MAGI1-depleted ECs. The data suggests that MAGI1 inhibits IRF3 activation by maintaining IRF3 SUMOylation. In summary, IAV infection occurs in ECs in a MAGI1 expression-dependent manner by inhibiting anti-viral responses including STATs and IRF3 activation and subsequent MX1 induction, and MAGI1 plays a role in EC activation, and in upregulating a pro-viral response. Therefore, the inhibition of MAGI1 is a potential therapeutic target for IAV-induced cardiovascular disease.

Keywords: EC inflammation; IAV; IRF3; MAGI1; MX1; interferon signaling.


Conflict of interest statement

The authors declare that the research was conducted in the absence of any commercial or financial relationships that could be construed as a potential conflict of interest.

Figures

Figure 1
Figure 1
IAV infection increases MAGI1 expression and MAGI1 depletion suppresses IAV infection and inhibits EC inflammation. (A) HUVECs were infected with IAV, heat-inactivated virus, or treated with PBS for 24 h. Total RNA was extracted and qRT-PCR was performed. Relative changes in Magi1 mRNA expression was calculated using the comparative Ct (2−ΔΔCt) method. Ct values of Magi1 were normalized to that of Gapdh (26). Each group passed the Shapiro-Wilk normality test, then one-way ANOVA followed by Turkey's multiple comparisons test were performed using the Prism software (GraphPad Software). The graph shows mean ± SD (n = 4). **p < 0.01. (B) HUVECs were transfected with either siCont or siMAGI1. After 48 h of transfection, the cells were infected with IAV or heat-inactivated virus for 24 h. Total RNA was extracted then qRT-PCR was performed. Relative changes in the viral NP mRNA expression was calculated using the comparative Ct (2−ΔΔCt) method. Ct values of the viral NP were normalized to that of the 18S ribosomal RNA (26). Each group passed the Shapiro-Wilk normality test, then two-way ANOVA followed by Turkey's multiple comparisons test were performed using the Prism software (GraphPad Software). The graph shows mean ± SD (n = 3). **p < 0.01. (C) HUVECs were transfected with either siCont or siMAGI1. After 48 h of transfection, the cells were infected with IAV and immunofluorescence staining for the viral NP protein (red) and DAPI staining for the nucleus (blue) were performed. Scale bars: 20 μM. (D) We analyzed a total of 30–120 cells per 2–3 fields per dish to determine the percentage of NP positive cells in a blinded manner. Each group passed the Shapiro-Wilk normality test, then unpaired student t-test was performed using the Prism software (GraphPad Software). The graph shows mean ± SD (n = 4). **p < 0.01. (E) HUVECs were transfected with either siCont or siMAGI1. After 48 h of transfection, the cells were infected or not infected with IAV for 24 h. Total RNA was extracted, and qRT-PCR was performed. Relative changes in Icam-1 mRNA expression was calculated using the comparative Ct (2−ΔΔCt) method. Ct values of Icam-1 were normalized to that of gapdh (26). Each group passed the Shapiro-Wilk normality test, then two-way ANOVA followed by Turkey's multiple comparisons test was performed using the Prism software (GraphPad Software). The graph shows mean ± SD (n = 4–6). **p < 0.01.
Figure 2
Figure 2
OxLDL increases MAGI1 expression and enhances IAV infection in ECs. (A,B) HUVECs (A) and HULECs (B) were pre-treated with OxLDL (10 μg/mL) for the indicated times. Upper: relative changes in MAGI1 protein expression were analyzed using the automated capillary electrophoresis Western analysis (Wes) system (ProteinSimple, San Jose, CA, USA) (27). Lower (densitometric quantification): relative changes in MAGI1 protein expression after OxLDL treatment. Fold increases are shown after normalization with β-actin at each time point. Quantification was performed using Image J. Each group passed the Shapiro-Wilk normality test, then one-way ANOVA followed by Turkey's multiple comparisons test was performed using the Prism software (GraphPad Software). The graph shows mean ± SD (n = 3). **P < 0.01. (C) HUVECs were pre-treated with OxLDL (10 μg/mL) for 24 h then infected with IAV for another 24 h. Total RNA was extracted then qRT-PCR was performed. Relative changes in the viral NP mRNA expression were calculated using the comparative Ct (2−ΔΔCt) method. Ct values of the viral NP were normalized to that of the 18S ribosomal RNA (26). Each group passed the Shapiro-Wilk normality test, then an unpaired student t-test was performed using the Prism software (GraphPad Software). The graph shows mean ± SD (n = 4). **p < 0.01.
Figure 3
Figure 3
Differential gene expression profiles between siMAGI1 vs. siCont-treated ECs. (A) Statistical significance of the IPA-determined biological function and disease gene enrichment in siMAGI1-treated ECs calculated by the right-tailed Fisher exact test and presented as –log(P) value. A larger value on the y-axis represents greater significance. A total of 252 genes were differentially expressed in siMAGI1-transfected ECs compared to that in siCont-transfected ECs (P < 0.05; absolute fold change >2). The p-value, calculated by the Fischer's exact test, reflects the likelihood that the association among a set of genes in the data set and a related biological function is significant. (B) Graphical summary of IPA results showing significant predictor genes that are related to antiviral response.
Figure 4
Figure 4
IFN signaling is the top-rank enriched IPA canonical pathway. (A) IPA-based identification of canonical pathways (–log[P] >5) associated with differentially expressed genes in HUVECs transfected with siMAGI1 vs. siCont. The bar chart indicates the –log(P) value of the significance of enrichment of each category. (B) Induction of IFN signaling in MAGI1-depleted ECs. Pathway models of IFN signaling in ECs based on data in the Ingenuity Knowledge Base are shown. Expression of genes in red is higher in siMAGI1-treated ECs compared to that in siCont-treated ECs. (C) Gene enrichment analyses (right-tailed Fisher exact test) according to the IPA downstream effects analysis identified Antimicrobial Response, Inflammatory Response, and Infectious Diseases as the highest scoring IPA interaction networks. Green and red symbols denote genes with lower and higher expression, respectively, in siMAGI1-treated ECs compared to that in siCont-treated ECs. The arrows with solid lines indicate direct (usually physical) interactions between two molecules in the direction of the arrow, Whereas, arrows with dashed lines denote indirect interactions (e.g., molecule/gene X affects molecule/gene Y). The abbreviations shown are defined in Supplementary Table 6.
Figure 5
Figure 5
MAGI1 suppresses IFN signaling in ECs. (A) HUVECs were transfected with either siCont or siMAGI1. After 48 h of transfection, total RNA was extracted then qRT-PCR was performed. Relative changes in Magi1, Mx1, Ifnb1, Ifna1, IfngI, Stat1, Stat5a, and Stat5b expression were calculated using the comparative Ct (2−ΔΔCt) method. Ct values of each target gene were normalized to that of the Gapdh (26). Each group passed the Shapiro-Wilk normality test, then an unpaired student t-test was performed using the Prism software (GraphPad Software). The graph shows mean ± SD (n = 11). **p < 0.01, *p < 0.05. (B) HUVECs were transfected with either siCont or siMAGI1. After 48 h of transfection, total RNA was extracted then qRT-PCR was performed. Relative changes in Oas2 mRNA expression were calculated using the comparative Ct (2−ΔΔCt) method. Ct values of Oas2 were normalized to that of the Gapdh (26). Each group passed the Shapiro-Wilk normality test, then an unpaired student t-test was performed using the Prism software (GraphPad Software). The graph shows mean ± SD (n = 3). **p < 0.01. (C) HUVECs were transfected with either siCont or siMAGI1. After 48 h of transfection, cell lysates were analyzed by immunoblotting with each specific antibody as indicated. The graphs represent densitometry data from 3 independent gels, one of which is shown in the left panel. Each group passed the Shapiro-Wilk normality test, then an unpaired student t-test was performed using the Prism software (GraphPad Software). The graph shows mean ± SD, n = 3, **P < 0.01, and * P < 0.05. Uncropped figures were provided in the supplements. (D) HUVECs were transfected with either siCont or siMAGI1. After 48 h of transfection, conditioned medium was collected and levels of IFNβ were measured. Each group passed the Shapiro-Wilk normality test, then an unpaired student t-test was performed using the Prism software (GraphPad Software). The graph shows mean ± SD, n = 4–6, *P < 0.05. (E,F) HUVECs were transfected with either the pCMV-MAGI1 or the pCMV-2B backbone construct (control) (20). After 24 h of transfection, total RNA was extracted then qRT-PCR was performed. Relative changes in Magi1 (E) and Ifnb1 (F) mRNA expression were calculated using the comparative Ct (2−ΔΔCt) method. Ct values of each target gene were normalized to that of the gapdh (26). At least, one of the groups did not pass the Shapiro-Wilk normality test, we performed an unpaired t-test with Welch's correction using the Prism software (GraphPad Software). The graph shows mean ± SD, n = 5, **P < 0.01. (G) HUVECs were transfected with either the pCMV-MAGI1 or the pCMV-2B backbone construct (control) (20). After 24 h of transfection, the cells were treated with IFN (200 U/mL) for 6 h, and immunoblotting was performed with each specific antibodies as indicated. The graph (lower) represents densitometry data from 4 independent gels, one of which is shown in the top panel. Each group passed the Shapiro-Wilk normality test, then one-way ANOVA followed by Turkey's multiple comparisons test was performed using the Prism software (GraphPad Software). The graph shows mean ± SD (n = 4). *p < 0.05.
Figure 6
Figure 6
MX1 depletion reverses MAGI1 depletion-mediated suppression of IAV infection. (A,B) HUVECs were transfected with either siCont, siMX1, siMAGI1, or siMX1+siMAGI1. After 48 h of transfection, cell lysates were analyzed by immunoblotting with each specific antibody as indicated. Gels are representative of 3 independent experiments. (C) HUVECs were transfected with either siCont, siMX1, siMAGI1, or siMX1+siMAGI1. After 48 h of transfection, the cells were infected with IAV for 24 h. Total RNA was extracted then qRT-PCR was performed. Relative changes in the viral NP mRNA expression were calculated using the comparative Ct (2−ΔΔCt) method. Ct values of the viral NP were normalized to that of the 18S ribosomal RNA (26). Each group passed the Shapiro-Wilk normality test, then one-way ANOVA followed by Turkey's multiple comparisons test was performed using the Prism software (GraphPad Software). The graph shows mean ± SD (n = 3-4). **p < 0.01, *p < 0.05. (D) Mouse lung ECs were isolated from Magi1−/− and littermate wild type (WT) control mice and cultured. The cells were infected with IAV for 24h. Total RNA was extracted then qRT-PCR was performed. Relative changes in the viral NP mRNA expression were calculated using the comparative Ct (2−ΔΔCt) method. Ct values of the viral NP were normalized to that of the 18S ribosomal RNA (26). Each group passed the Shapiro-Wilk normality test, then an unpaired student t-test was performed using the Prism software (GraphPad Software). The graph shows mean ± SD, n =11. NS: not significant.
Figure 7
Figure 7
MAGI1 depletion promotes IRF3 nuclear translocation and de-SUMOylation without affecting IRF3 S396 phosphorylation. (A) HUVECs were transfected with either siCont or siMAGI1. After 48 h of transfection, cell lysates were analyzed by immunoblotting with each specific antibody as indicated. The graphs represent densitometry data from 3 independent gels, one of which is shown in Figure 5C. Each group passed the Shapiro-Wilk normality test, then an unpaired student t-test was performed using the Prism software (GraphPad Software). The graphs show mean ± SD, n = 3, **P < 0.01. (B) HUVECs were transfected with either siCont or siMAGI1. After 48 h of transfection, immunofluorescence staining for IRF3 protein (green) and DAPI staining for the nuclei (blue) were performed. Scale bars: 20 μM. Robust IRF3 nuclear translocation noted in siMAGI1-transfected cells. The percentages of cells with nuclear staining were quantified by counting the cells with the mean intensity of IRF3 staining in the nucleus ≥ mean intensity of IRF3 cytoplasmic staining by each dish (n = 5–6) in a blinded manner. (C) HUVECs were transfected with either siCont or siMAGI1. After 48 h of transfection, cell lysates were immuno-precipitated IRF3 with the antibody that specifically recognizes this protein then immunoblotting with the antibody that recognizes SUMO1 to detect IRF3 SUMOylation (20). IgG antibody was used as a negative control. Total cell lysates were immunoblotted with each specific antibody as indicated. (D) The graphs represent densitometry data from 3 independent gels, one of which is shown in shown in (C). Median intensities of IRF3 SUMOylation were calculated after subtracting the background, which is median intensities of IgG control. Each group passed the Shapiro-Wilk normality test, then an unpaired student t-test with Welch's correction was performed using the Prism software (GraphPad Software). The graph shows mean ± SD, n = 3, **P < 0.01. (E) The scheme depicts the relationship between MAGI1 and IFN signaling. IAV infection induces anti-viral responses including STATs and IRF3 activation and subsequent MX1 and OAS2 induction. For efficient infection of IAV to ECs, IAV induces MAGI1 expression, resulting in inhibition of anti-viral responses by inhibiting STATs and IRF3 activation. Especially, MAGI1 inhibits IRF3 de-SUMOylation and subsequent IRF3 activation. Importantly, OxLDL also upregulates MAGI1 expression and promotes IAV infection, which may explain the relationship between hypercholesterolemia and IAV infection in patients. The scheme was generated using BioRender.

Similar articles

Cited by

References

    1. ReferencesDou D, Revol R, Ostbye H, Wang H, Daniels R. Influenza A virus cell entry, replication, virion assembly and movement. Front Immunol. (2018) 9:1581. 10.3389/fimmu.2018.01581 - DOI - PMC - PubMed
    1. Eisfeld AJ, Neumann G, Kawaoka Y. Influenza A virus isolation, culture and identification. Nat Protoc. (2014) 9:2663–81. 10.1038/nprot.2014.180 - DOI - PMC - PubMed
    1. Flerlage T, Boyd DF, Meliopoulos V, Thomas PG, Schultz-Cherry S. Influenza virus and SARS-CoV-2: pathogenesis and host responses in the respiratory tract. Nat Rev Microbiol. (2021) 19:425–41. 10.1038/s41579-021-00542-7 - DOI - PMC - PubMed
    1. Piantadosi CA, Schwartz DA. The acute respiratory distress syndrome. Ann Intern Med. (2004) 141:460–70. 10.7326/0003-4819-141-6-200409210-00012 - DOI - PubMed
    1. Sugiyama MG, Gamage A, Zyla R, Armstrong SM, Advani S, Advani A, et al. . Influenza virus infection induces platelet-endothelial adhesion which contributes to lung injury. J Virol. (2016) 90:1812–23. 10.1128/JVI.02599-15 - DOI - PMC - PubMed