

In Situ Assessment of Porcine Osteochondral Repair Tissue in the Visible-Near Infrared Spectral Region
- PMID: 36082171
- PMCID: PMC9445125
- DOI: 10.3389/fbioe.2022.885369
In Situ Assessment of Porcine Osteochondral Repair Tissue in the Visible-Near Infrared Spectral Region
Abstract
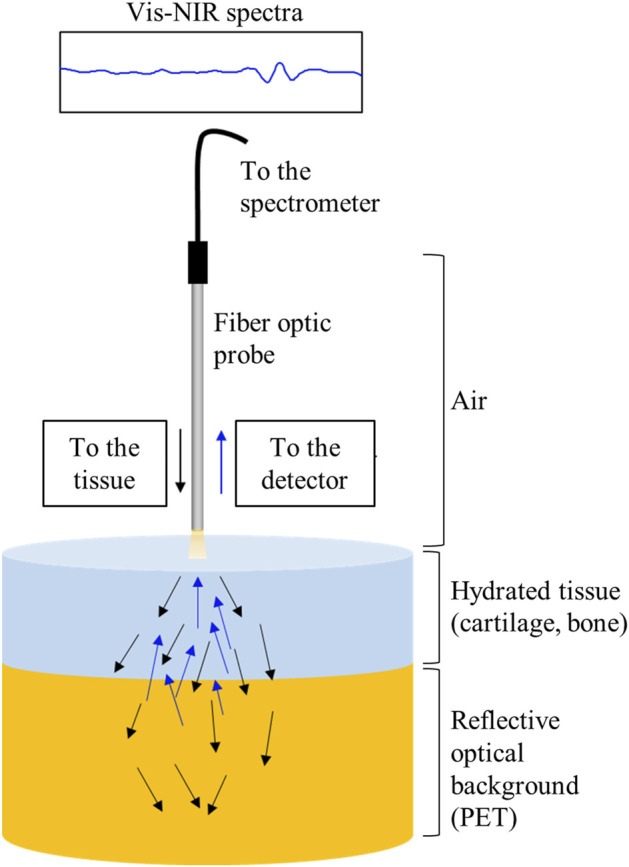
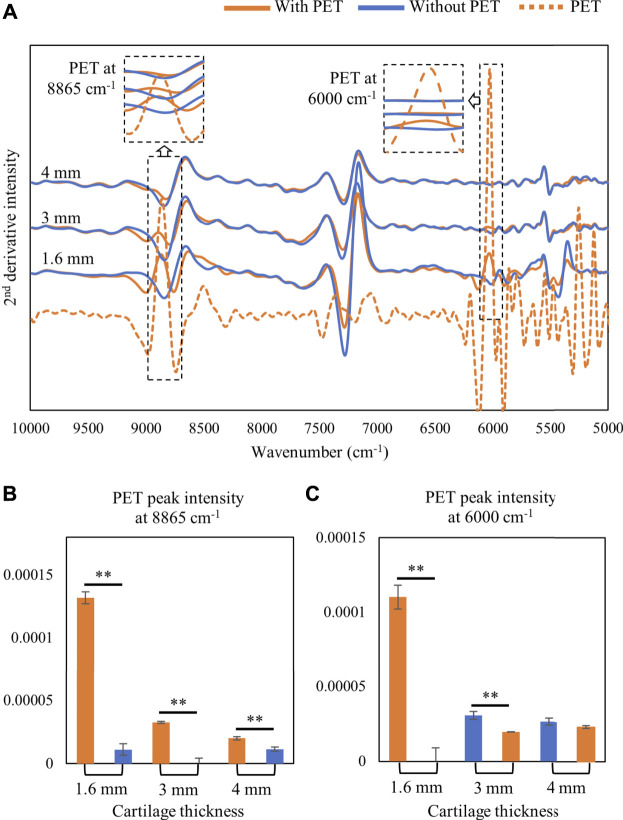
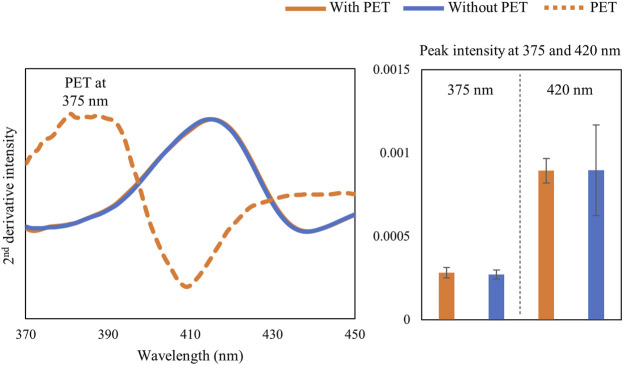
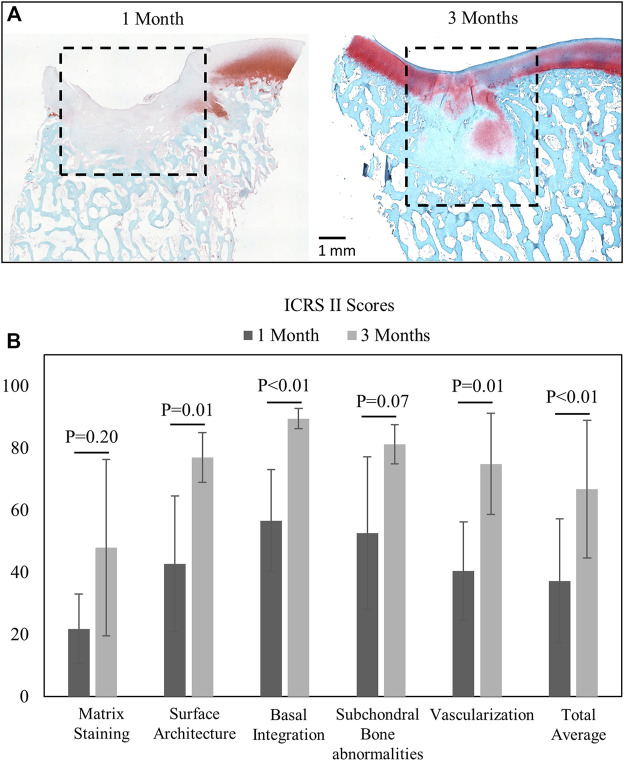
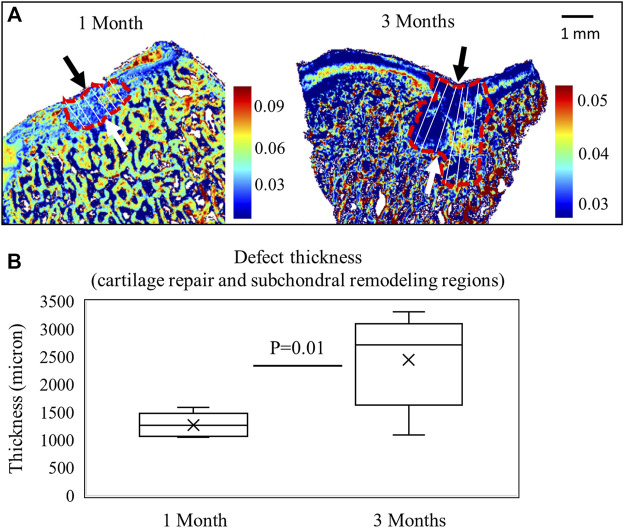
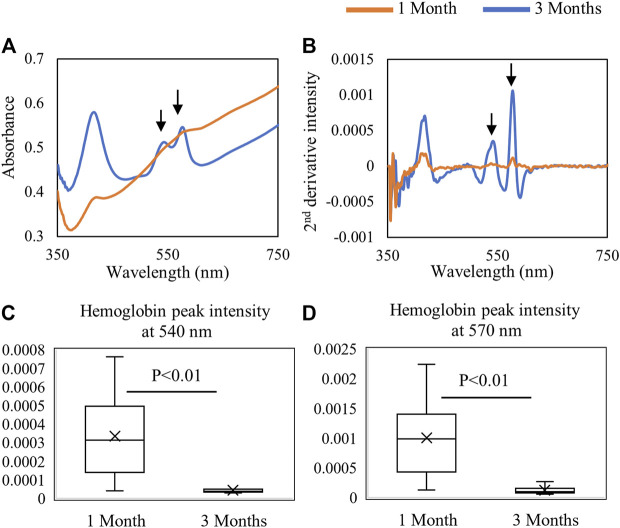
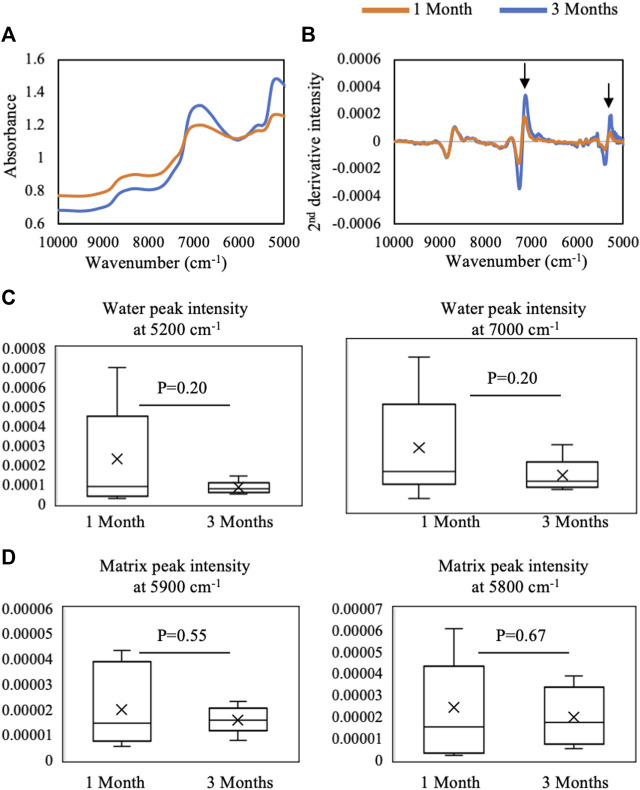
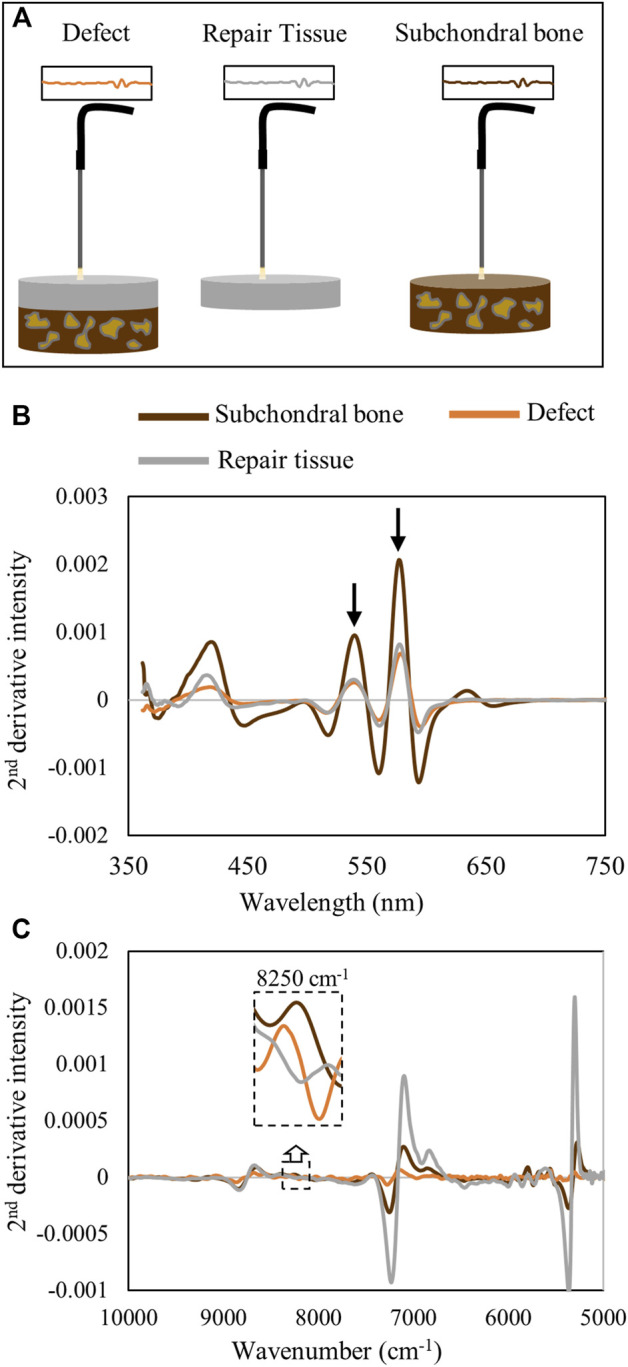
Standard assessment of cartilage repair progression by visual arthroscopy can be subjective and may result in suboptimal evaluation. Visible-near infrared (Vis-NIR) fiber optic spectroscopy of joint tissues, including articular cartilage and subchondral bone, provides an objective approach for quantitative assessment of tissue composition. Here, we applied this technique in the 350-2,500 nm spectral region to identify spectral markers of osteochondral tissue during repair with the overarching goal of developing a new approach to monitor repair of cartilage defects in vivo. Full thickness chondral defects were created in Yucatan minipigs using a 5-mm biopsy punch, and microfracture (MFx) was performed as a standard technique to facilitate repair. Tissues were evaluated at 1 month (in adult pigs) and 3 months (in juvenile pigs) post-surgery by spectroscopy and histology. After euthanasia, Vis-NIR spectra were collected in situ from the defect region. Additional spectroscopy experiments were carried out in vitro to aid in spectral interpretation. Osteochondral tissues were dissected from the joint and evaluated using the conventional International Cartilage Repair Society (ICRS) II histological scoring system, which showed lower scores for the 1-month than the 3-month repair tissues. In the visible spectral region, hemoglobin absorbances at 540 and 570 nm were significantly higher in spectra from 1-month repair tissue than 3-month repair tissue, indicating a reduction of blood in the more mature repair tissue. In the NIR region, we observed qualitative differences between the two groups in spectra taken from the defect, but differences did not reach significance. Furthermore, spectral data also indicated that the hydrated environment of the joint tissue may interfere with evaluation of tissue water absorbances in the NIR region. Together, these data provide support for further investigation of the visible spectral region for assessment of longitudinal repair of cartilage defects, which would enable assessment during routine arthroscopy, particularly in a hydrated environment.
Keywords: cartilage repair; fiber optic spectroscopy; in situ optical spectroscopy; microfracture; visible–near infrared (Vis-NIR).
Copyright © 2022 Kandel, Querido, Falcon, Zlotnick, Locke, Stoeckl, Patel, Patil, Mauck and Pleshko.
Conflict of interest statement
The authors declare that the research was conducted in the absence of any commercial or financial relationships that could be construed as a potential conflict of interest.
Figures
Similar articles
-
Age-Dependent Subchondral Bone Remodeling and Cartilage Repair in a Minipig Defect Model.Tissue Eng Part C Methods. 2017 Nov;23(11):745-753. doi: 10.1089/ten.TEC.2017.0109. Epub 2017 Oct 27. Tissue Eng Part C Methods. 2017. PMID: 28747146 Free PMC article.
-
A Novel Strategy to Enhance Microfracture Treatment With Stromal Cell-Derived Factor-1 in a Rat Model.Front Cell Dev Biol. 2021 Feb 4;8:595932. doi: 10.3389/fcell.2020.595932. eCollection 2020. Front Cell Dev Biol. 2021. PMID: 33634095 Free PMC article.
-
Chondroinduction Is the Main Cartilage Repair Response to Microfracture and Microfracture With BST-CarGel: Results as Shown by ICRS-II Histological Scoring and a Novel Zonal Collagen Type Scoring Method of Human Clinical Biopsy Specimens.Am J Sports Med. 2015 Oct;43(10):2469-80. doi: 10.1177/0363546515593943. Epub 2015 Aug 10. Am J Sports Med. 2015. PMID: 26260465
-
Autologous tissue transplantations for osteochondral repair.Dan Med J. 2016 Apr;63(4):B5236. Dan Med J. 2016. PMID: 27034191 Review.
-
[Biologic Reconstruction of Full Sized Cartilage Defects of the Hip: A Guideline from the DGOU Group "Clinical Tissue Regeneration" and the Hip Committee of the AGA].Z Orthop Unfall. 2017 Dec;155(6):670-682. doi: 10.1055/s-0043-116218. Epub 2017 Sep 15. Z Orthop Unfall. 2017. PMID: 28915523 Review. German.
Cited by
-
Considering the Cellular Landscape in Marrow Stimulation Techniques for Cartilage Repair.Cells Tissues Organs. 2024;213(6):523-537. doi: 10.1159/000538530. Epub 2024 Apr 10. Cells Tissues Organs. 2024. PMID: 38599194 Free PMC article. Review.
-
Visible and Near-Infrared Spectroscopy Enables Differentiation of Normal and Early Osteoarthritic Human Knee Joint Articular Cartilage.Ann Biomed Eng. 2023 Oct;51(10):2245-2257. doi: 10.1007/s10439-023-03261-7. Epub 2023 Jun 18. Ann Biomed Eng. 2023. PMID: 37332006 Free PMC article.
References
Grants and funding
LinkOut - more resources
Full Text Sources
Miscellaneous