

Neuronal Inflammation is Associated with Changes in Epidermal Innervation in High Fat Fed Mice
- PMID: 36082224
- PMCID: PMC9445198
- DOI: 10.3389/fphys.2022.891550
Neuronal Inflammation is Associated with Changes in Epidermal Innervation in High Fat Fed Mice
Abstract
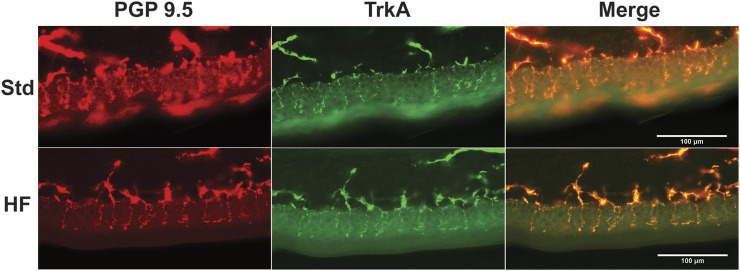
Peripheral neuropathy (PN), a debilitating complication of diabetes, is associated with obesity and the metabolic syndrome in nondiabetic individuals. Evidence indicates that a high fat diet can induce signs of diabetic peripheral PN in mice but the pathogenesis of high fat diet-induced PN remains unknown. PURPOSE: Determine if neuronal inflammation is associated with the development of mechanical hypersensitivity and nerve fiber changes in high fat fed mice. METHODS: Male C57Bl/6 mice were randomized to a standard (Std, 15% kcal from fat) or high fat diet (HF, 54% kcal from fat) for 2, 4, or 8 weeks (n = 11-12 per group). Lumbar dorsal root ganglia were harvested and inflammatory mediators (IL-1α, IL-1β, IL-2, IL-3, IL-4, IL-5, IL-6, IL-10, IL-12p70, IL-17, MCP-1, IFN-γ, TNF-α, MIP-1α, GMCSF, RANTES) were quantified. Hindpaw mechanical sensitivity was assessed using the von Frey test. Intraepidermal nerve fiber density (IENFD) and TrkA nerve fiber density were quantified via immunohistochemistry. RESULTS: After 8 weeks, HF had greater body mass (33.3 ± 1.0 vs 26.7 ± 0.5 g, p < 0.001), fasting blood glucose (160.3 ± 9.4 vs 138.5 ± 3.4 mg/dl, p < 0.05) and insulin (3.58 ± 0.46 vs 0.82 ± 0.14 ng/ml, p < 0.001) compared to Std. IL-1α, RANTES and IL-5 were higher in HF compared to Std after 2 and 4 weeks, respectively (IL-1α: 4.8 ± 1.3 vs 2.9 ± 0.6 pg/mg, p < 0.05; RANTES: 19.6 ± 2.2 vs 13.3 ± 1.2 pg/mg p < 0.05; IL-5: 5.8 ± 0.7 vs 3.1 ± 0.5 pg/mg, p < 0.05). IENFD and TrkA fiber density were also higher in HF vs Std after 4 weeks (IENFD: 39.4 ± 1.2 vs 32.2 ± 1.3 fibers/mm, p < 0.001; TrkA: 30.4 ± 1.8 vs 22.4 ± 1.3 fibers/mm). There were no significant differences in hindpaw sensitivity for Std vs HF. CONCLUSION: Increased inflammatory mediators preceded and accompanied an increase in cutaneous pain sensing nerve fibers in high fat fed mice but was not accompanied by significant mechanical allodynia. Diets high in fat may increase neuronal inflammation and lead to increased nociceptive nerve fiber density.
Keywords: TrkA; insulin resisitance; intraepidermal nerve fiber density; mechanical allodynia; peripheral neuropathy; prediabetes; von Frey.
Copyright © 2022 Umbaugh, Maciejewski, Wooten and Guilford.
Conflict of interest statement
The authors declare that the research was conducted in the absence of any commercial or financial relationships that could be construed as a potential conflict of interest.
Figures


References
-
- Azad N., Emanuele N. V., Abraira C., Henderson W. G., Colwell J., Levin S. R., et al. (1999). The effects of intensive glycemic control on neuropathy in the VA cooperative study on type II diabetes mellitus (VA CSDM). J. Diabetes Complicat. 13 (5-6), 307–313. 10.1016/s1056-8727(99)00062-8 - DOI - PubMed
-
- Biessels G. J., Bril V., Calcutt N. A., Cameron N. E., Cotter M. A., Dobrowsky R., et al. (2014). Phenotyping animal models of diabetic neuropathy: a consensus statement of the diabetic neuropathy study group of the EASD (neurodiab). J. Peripher. Nerv. Syst. 19 (2), 77–87. 10.1111/jns5.12072 - DOI - PMC - PubMed
Grants and funding
LinkOut - more resources
Full Text Sources
Research Materials
Miscellaneous