. 2022 Oct;241(4):896-918.
doi: 10.1111/joa.13729. Epub 2022 Sep 9.

Patterns of variation in canal and root number in human post-canine teeth

Affiliations

Patterns of variation in canal and root number in human post-canine teeth

Jason J Gellis et al. J Anat. 2022 Oct.

Abstract

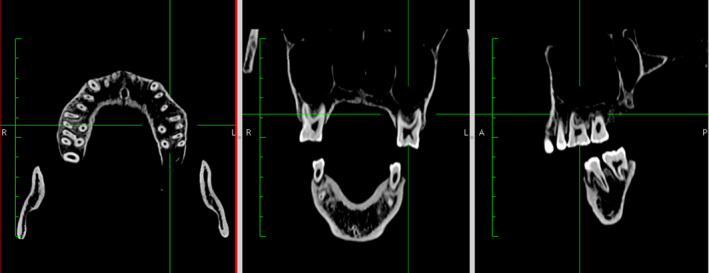
Descriptive morphology of tooth roots traditionally focuses on number of canals and roots. However, how or if canal and root number are related is poorly understood. While it is often assumed that canal number is concomitant with root number and morphology, in practice canal number and morphology do not always covary with external root features. To investigate the relationship between canal and root number, fully developed, adult post-canine teeth were examined and quantified from computerized tomography scans from a global sample of 945 modern humans. We tested the hypotheses that root and canal number do not follow a 1:1 ratio, that canal to root ratios differ between teeth, and that canal to root ratios differ across major human geographical groups. Results indicate that not only is root number dependent on canal number, but that this relationship becomes more variable as canal number increases, varies between individual teeth and by major geographical group, and changes as these groups increase in geographical distance from Sub-Saharan Africa. These results show that the ratio of canal number to root number is an important indicator of variation in dental phenotypes.

Keywords: dental anthropology; human dental evolution; root canals; tooth roots.


Figures

FIGURE 1
FIGURE 1
Top: The location on the apical foramen of the tooth crown where the inter‐radicular processes (IRPs) form determines the number and orientation of each tooth root/tooth roots. For example, in a tooth with mesial and distal roots, two inter‐radicular processes arise from the buccal and lingual borders of the apical foramen, forming mesial and distal secondary apical foramina upon fusion. Grey = apical foramina of the developing tooth crown. Bottom: Fully developed roots of different types of teeth with the same number, but different orientation of IRPs. From left to right: single‐rooted teeth, single‐rooted teeth in which IRP did not fuse with opposing side of apical foramen, two rooted teeth in which two opposing IRPs fused, three rooted teeth in which three opposing IRPs fused, four rooted teeth in which four opposing IRPs fused.
FIGURE 2
FIGURE 2
Sample sizes by collection. Left: Bar plot of counts for entire sample (n = 945). Right: Counts of samples divided up by collection, and geographic locations given by collection records. A complete list of the individuals used in this study, their collection information, antiquity, sex and locality based on available records is listed in Supplementary Materials Table A.
FIGURE 3
FIGURE 3
Human population sample sizes by location and sex. Left: Bar plot of sex for entire sample (n = 945). Right: Sex divided up by collection and geographic locations given by collection records. Individuals of undetermined sex (‘NA’) are not included in the plot on the right to improve readability. They are: AMNH (NA = 3), DW (NA = 12) and SI (NA = 2). A complete list of the individuals used in this study, their collection information, antiquity, sex and locality based on available records is Supplementary Materials Table A.
FIGURE 4
FIGURE 4
Map of individuals used in this study adapted to show the five major human geographical groups.
FIGURE 5
FIGURE 5
Horos Dicom Viewer 2D orthogonal view used to assess root and canal morphologies. Left: Coronal view at mid‐point of roots (see Figure 6 for measurements). Centre: Anterior view. Right: Saggital view.
FIGURE 6
FIGURE 6
Measurement and identification of root and/or canal number. Top left: Locations of measurements taken in Horos Dicom Viewer of (a) Absolute length of root ‐ CEJ to parallel position at apex of roots(s); (b) bifurcation length; (c & d) root length(s) along the axis of the root(s); (m) mid‐point between CEJ and root apex along the long axis of the root. Top right: Application of measures to CT slice of a mandibular molar. Bottom: Determination of canal numbers from Gellis and Foley (2021). Illustration of a distal root of a double‐rooted mandibular molar with examples of canal counts in solid grey. Dotted grey lines indicate canal/s position in root. CEJ, Cemento‐enamel junction; POB, Point of bifurcation; Solid grey, canals; CT, cervical third; MT, middle third; AT, apical third.
FIGURE 7
FIGURE 7
Pearson correlation of root number (RN) to canal number (CN). Significance level = 0.05. Significant positive correlation coefficients in blue. Significant negative correlation coefficients in red. Blank cells in P4 RN:P4 RN due to all P4s having the same level (i.e. one root; see Table 3). Counts for imputed values used in analyses are provided in Supplementary Materials Table B.
FIGURE 8
FIGURE 8
PGLM prediction curves with error bars for canal to root number for individual teeth. Dotted red line represents 1:1 canal to root relationship (i.e. what would be observed if there was a simple 1:1 relationship between roots and canals). Over prediction in the number of roots for single canaled M1/M1s‐M3/M3s is owing to very small sample of individuals with one root to one canal (see Table 3 for counts). Counts for imputed values used in analyses are provided in Supplementary Materials Table B.
FIGURE 9
FIGURE 9
Proportion of canal and root number phenotype permutations for individual teeth. R = root number and C = canal number (Gellis & Foley, 2021). For example, R1‐C2 indicates a single‐rooted tooth with two canals. R1‐C4 = 9, R3‐C5 = 6, R3‐C6 = 1 and R4‐C4 = 8, are not visualized on this plot due to small sample size. Counts for imputed values used in analyses are provided in Supplementary Materials Tables C–L.
FIGURE 10
FIGURE 10
Tukey pair‐wise comparisons of estimated marginal means (means extracted from the PGLM analysis) of canal to root number by tooth. Black dot = mean value; Blue bar = confidence intervals. The degree to which red comparison arrows overlap reflects the significance (p = 0.05) of the comparison of the two estimates. Counts for imputed values used in analyses are provided in Supplementary Materials Table B. Full statistical output is presented in Supplementary Materials Table M.
FIGURE 11
FIGURE 11
PGLM prediction curve for root to canal number by major human geographical groups. Dotted red line represents 1:1 root to canal relationship. Over prediction in the number of roots for single canaled M1/M1s–M3/M3s is owing to very small sample of individuals with one root to one canal (see Table 3 for counts). Counts for imputed values used in analyses are provided in Supplementary Materials Tables C–L.
FIGURE 12
FIGURE 12
Marginal effects of canal to root count in individual teeth by geographical region. Counts for imputed values used in analyses are provided in Supplementary Materials Tables C–L.
FIGURE 13
FIGURE 13
Proportions of canal and root number phenotype permutations for individual teeth across major geographical groups. R stands for root number and C for canal number (Gellis & Foley, 2021). For example, R1‐C2 indicates a single‐rooted tooth with two canals. R1‐C4 = 9, R3‐C5 = 6, R3‐C6 = 1 and R4‐C4 = 8, are not visualized on this plot due to small sample size. Counts for imputed values used in analyses are provided in Supplementary Materials Tables C–L.
FIGURE 14
FIGURE 14
Tukey pair‐wise comparisons of estimated marginal means (means extracted from the PGLM analysis) of canal to root number by geographical region. Black dot = mean value; Blue bar = confidence intervals. The degree to which red comparison arrows overlap reflects the significance (p = 0.05) of the comparison of the two estimates. Counts for imputed values used in analyses are provided in Supplementary Materials Tables C–L. Full statistical output is presented in Supplementary Materials Table N.

References

    1. Abbott, S.A. (1984) A comparative study of tooth root morphology in the great apes, modern man and early hominids [unpublished Ph.D Dissertation]. London: University of London.
    1. Ackerman, J.L. , Ackerman, A.L. & Ackerman, A.B. (1973) Taurodont, pyramidal and fused molar roots associated with other anomalies in a kindred. American Journal of Physical Anthropology, 38(3), 681–694. 10.1002/ajpa.1330380305 - DOI - PubMed
    1. Agresti, A. (2002) Categorical Data Analysis. Somerset: John Wiley & Sons, Incorporated.
    1. Ahmed, H.M.A. , Versiani, M.A. , De‐Deus, G. & Dummer, P.M.H.H. (2017) A new system for classifying root and root canal morphology. International Endodontic Journal, 50(8), 761–770. 10.1111/iej.12685 - DOI - PubMed
    1. Akoglu, H. (2018) User's guide to correlation coefficients. Turkish Journal of Emergency Medicine, 18(3), 91–93. 10.1016/j.tjem.2018.08.001 - DOI - PMC - PubMed

Publication types

Grants and funding