. 2022 Sep 9;17(9):e0273844.
doi: 10.1371/journal.pone.0273844. eCollection 2022.

Natural diversity of the honey bee (Apis mellifera) gut bacteriome in various climatic and seasonal states

Affiliations

Natural diversity of the honey bee (Apis mellifera) gut bacteriome in various climatic and seasonal states

Márton Papp et al. PLoS One. .

Abstract

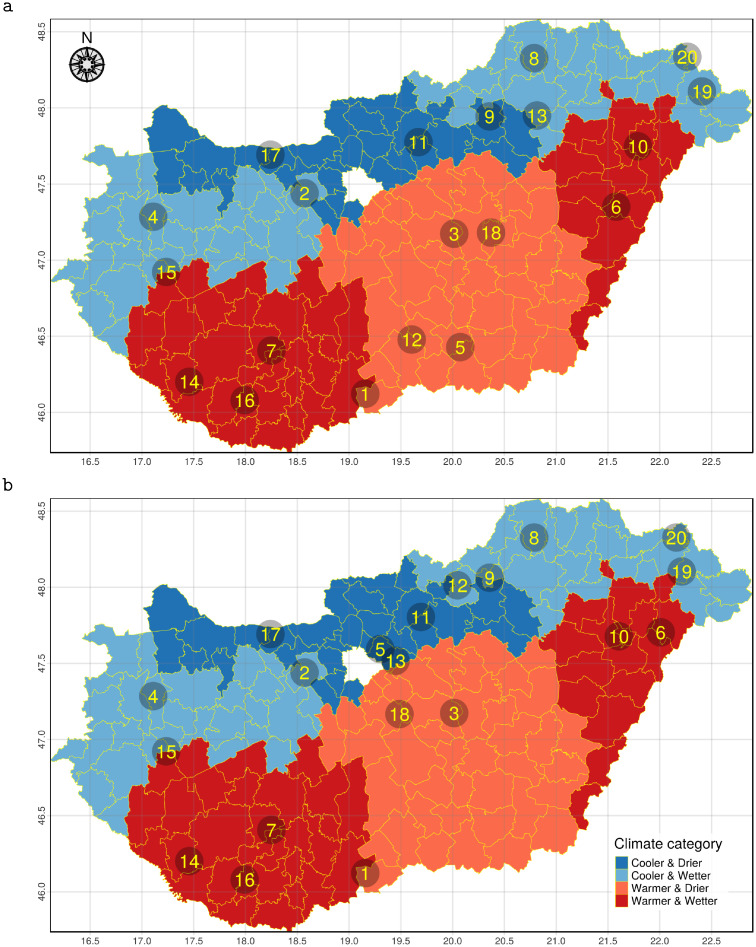
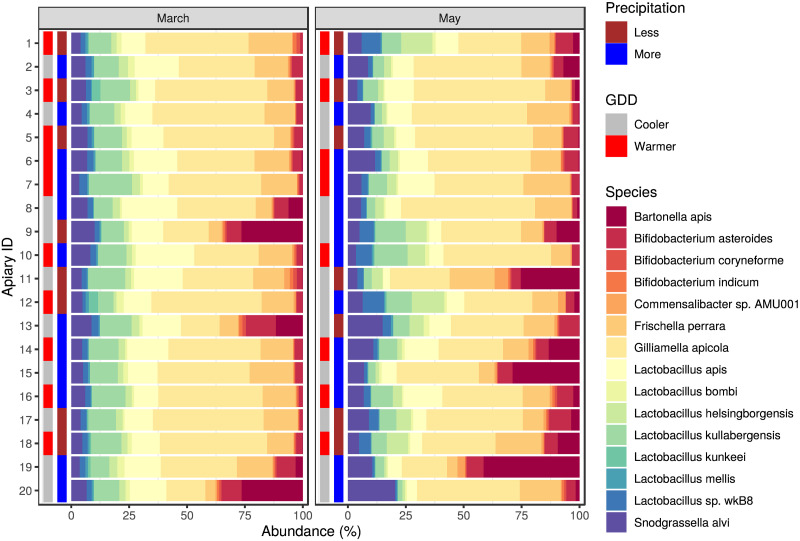
As pollinators and producers of numerous human-consumed products, honey bees have great ecological, economic and health importance. The composition of their bacteriota, for which the available knowledge is limited, is essential for their body's functioning. Based on our survey, we performed a metagenomic analysis of samples collected by repeated sampling. We used geolocations that represent the climatic types of the study area over two nutritionally extreme periods (March and May) of the collection season. Regarding bacteriome composition, a significant difference was found between the samples from March and May. The samples' bacteriome from March showed a significant composition difference between cooler and warmer regions. However, there were no significant bacteriome composition differences among the climatic classes of samples taken in May. Based on our results, one may conclude that the composition of healthy core bacteriomes in honey bees varies depending on the climatic and seasonal conditions. This is likely due to climatic factors and vegetation states determining the availability and nutrient content of flowering plants. The results of our study prove that in order to gain a thorough understanding of a microbiome's natural diversity, we need to obtain the necessary information from extreme ranges within the host's healthy state.


Conflict of interest statement

The authors have declared that no competing interests exist.

Figures

Fig 1
Fig 1. Climate category spatial pattern and sampling points.
The Hungarian local administrative units (LAU) coloured by climatic categories based on growing degree days (GDD) and precipitation of the period 2008–2017. The numbers represent the identification numbers of the sampled apiaries in March (a) and May (b).
Fig 2
Fig 2. Richness and evenness of honey bee gut bacteriome by sample groups.
The numbers of observed species (richness) and the Inverse Simpson’s Index (evenness) as α-diversity metrics are presented as a violin and box plot combination. These indices were calculated in 1,000 iterations of rarefied OTU tables with a sequencing depth of 6,129. The average over the iterations was taken for each apiary. The violin plot shows the probability density, while the box plot marks the outliers, median and the IQR. For Inverse Simpson’s Index, the comparison of samples from cooler and warmer districts collected in March showed significant (p = 0.0215) differences.
Fig 3
Fig 3. NMDS ordination of bacteriome for sampling March and May.
Bray-Curtis dissimilarity was calculated using the species-level abundance of core bacteria. The samples from apiaries (IDs in dots) collected in March (blue) and May (green) are plotted using these dissimilarities. Based on the same measures, PERMANOVA analysis showed significant differences between the sampling time periods (p = 0.002, stress = 0.144).
Fig 4
Fig 4. NMDS ordination of bacteriome for environmental condition categories by sampling period.
The colours represent the environmental condition categories and the numbers correspond to the apiary IDs. The stress was 0.062 and 0.116 for March and May respectively. The samples’ bacteriome from March showed significant (p = 0.02) distance between the cooler and warmer districts. From the same period, the precipitation levels did not differ significantly (p = 0.155). In the samples gathered in May, there was no significant distance neither between GDD nor precipitation categories (p = 0.277 and p = 0.849, respectively).
Fig 5
Fig 5. Core bacteriome composition of honey bee gut samples.
The relative abundance is plotted for the first (March) and second (May) sampling. Besides the bacterial species of the core bacteriome, the environmental condition (growing degree-day (GDD) and precipitation) categories of sampling places are also marked.

Similar articles

Cited by

References

    1. Ványi GÁ, Csapó Z, Kárpáti L. Externality effects of honey production. Applied Studies in Agribusiness and Commerce. 2012;6(1-2):63–67. doi: 10.19041/APSTRACT/2012/1-2/8 - DOI
    1. Hristov P, Neov B, Shumkova R, Palova N. Significance of Apoidea as main pollinators. Ecological and economic impact and implications for human nutrition. Diversity. 2020;12(7):280. doi: 10.3390/d12070280 - DOI
    1. Patel V, Pauli N, Biggs E, Barbour L, Boruff B. Why bees are critical for achieving sustainable development. Ambio. 2021;50(1):49–59. doi: 10.1007/s13280-020-01333-9 - DOI - PMC - PubMed
    1. Samarghandian S, Farkhondeh T, Samini F. Honey and health: A review of recent clinical research. Pharmacognosy Res. 2017;9(2):121. - PMC - PubMed
    1. Oldroyd BP. What’s killing American honey bees? PLoS Biol. 2007;5(6):e168. doi: 10.1371/journal.pbio.0050168 - DOI - PMC - PubMed

Publication types