. 2022 Sep 9;8(36):eabo2190.
doi: 10.1126/sciadv.abo2190. Epub 2022 Sep 9.

Extreme weather events and the politics of climate change attribution

Affiliations

Extreme weather events and the politics of climate change attribution

Zuhad Hai et al. Sci Adv. .

Abstract

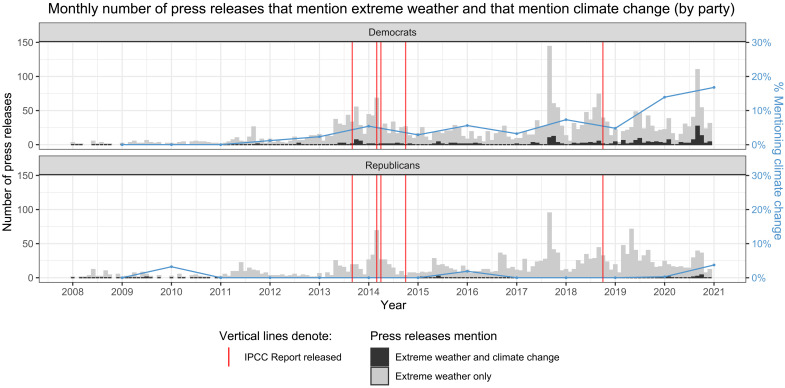
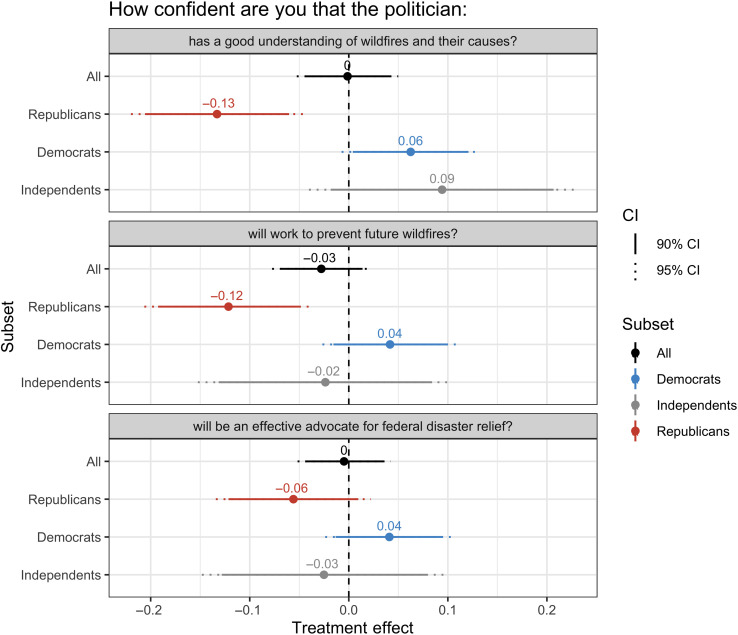
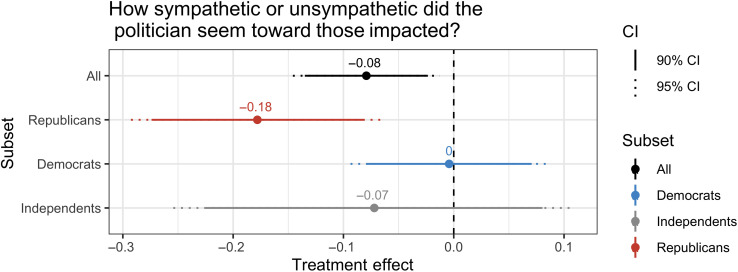
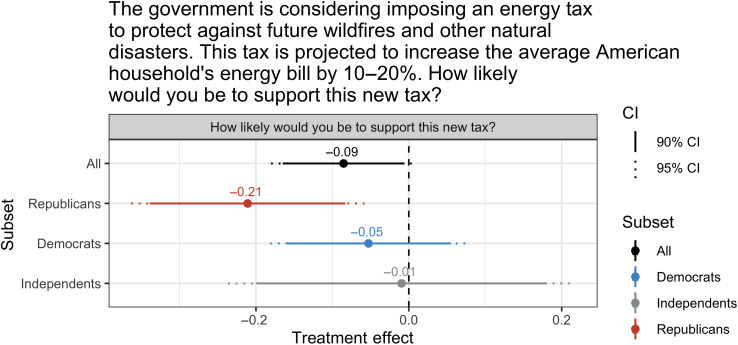
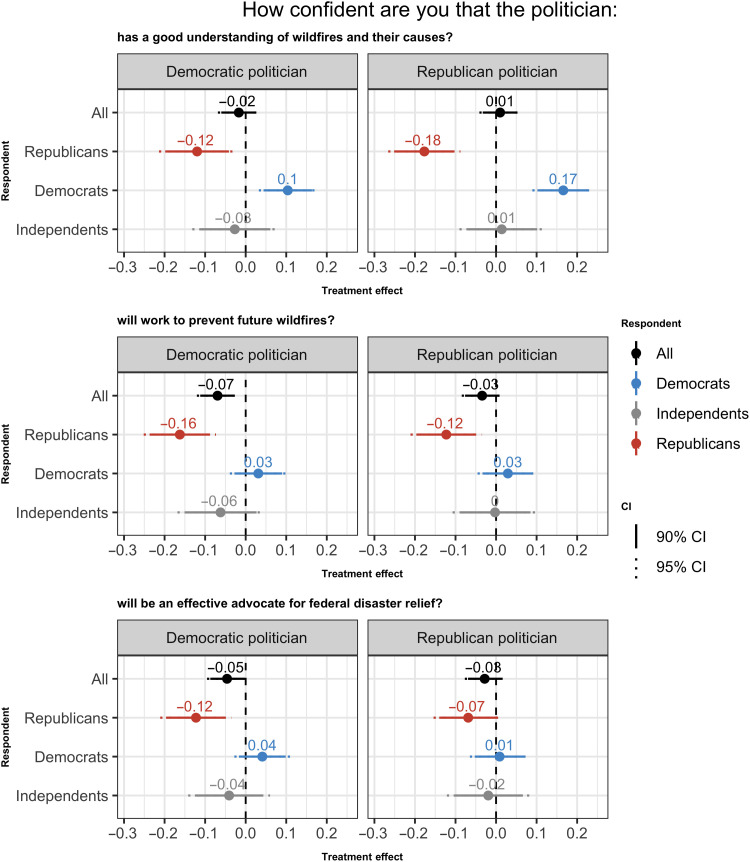
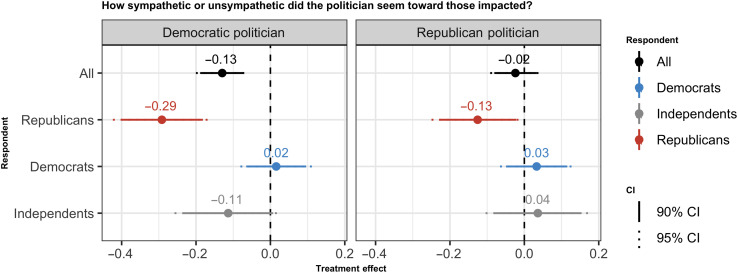
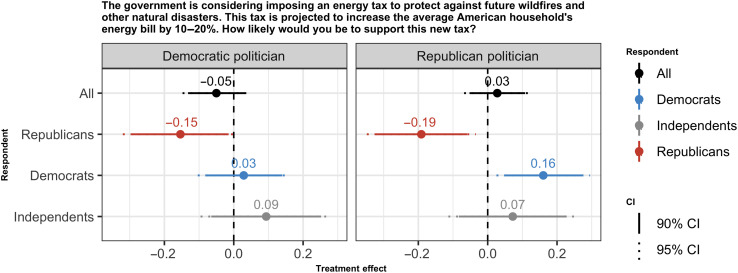
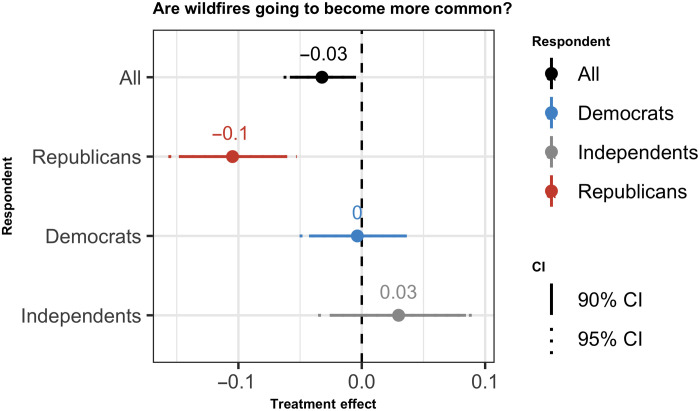
The consequences of climate change are becoming increasingly visible in the form of more severe wildfires, hurricanes, and flooding. As the science linking these disasters to climate change has grown more robust, it has led to pressure on politicians to acknowledge the connection. While an analysis of U.S. Congressional press releases reveals a slight increase in politicians' willingness to do so, many remain hesitant. Why? We hypothesize that climate change attribution can backfire, harming politicians' popularity and undermining their ability to adapt to the visible manifestations of climate change. We conduct an original survey experiment on a representative sample of American adults and show that when a politician links wildfires to climate change, Republicans perceive the official as less capable of addressing weather-related disasters. In addition, Republicans become less supportive of efforts to protect against similar disasters in the future. Our findings shed light on the potential trade-offs of conveying the link between climate change and its impacts.


Figures

Fig. 1.
Fig. 1.. Climate change attribution in weather-related press releases.
Fig. 2.
Fig. 2.. Treatment effect on confidence in politician.
This figure presents the effect of our treatment on the full sample and by respondents’ party identification. All three variables are on a three-point scale ranging from 0 (not confident at all) to 2 (extremely confident). All regressions use OLS and control for respondent’s gender, income, race, and level of education. CI, confidence interval.
Fig. 3.
Fig. 3.. Treatment effect on perception of politician’s sympathy.
This figure presents the effect of our treatment on the full sample and by respondents’ party identification. For the dependent variable, a value of 0 denotes “extremely unsympathetic,” while a value of 4 denotes “extremely sympathetic.” All regressions use OLS and control for respondent’s gender, income, race, and level of education.
Fig. 4.
Fig. 4.. Treatment effect on support for energy tax.
This figure presents the effect of our treatment on the full sample and by respondents’ party identification. The dependent variable is the respondent’s likelihood of supporting the tax. A value of 0 denotes “extremely unlikely,” while a value of 4 denotes “extremely likely.” All regressions use OLS and control for respondent’s gender, income, race, and level of education.
Fig. 5.
Fig. 5.. Treatment effect on confidence in politician by the party of politician (second wave).
This figure presents the effect of our treatment on the full sample and by respondents’ party identification, split by the party identification of the politician. All three variables are on a three-point scale ranging from 0 (not confident at all) to 2 (extremely confident). All regressions use OLS and control for respondent’s gender, income, race, and level of education.
Fig. 6.
Fig. 6.. Treatment effect on perception of politician’s sympathy by the party of politician (second wave).
This figure presents the effect of our treatment on the full sample and by respondents’ party identification, split by the party identification of the politician. Each panel presents the treatment effect on the full sample and by subgroups of respondents’ party identification. The dependent variable is on a five-point scale ranging from 0 (extremely unsympathetic) to 4 (extremely sympathetic). All regressions use OLS and control for respondent’s gender, income, race, and level of education.
Fig. 7.
Fig. 7.. Treatment effect on support for energy tax by the party of politician (second wave).
This figure presents the effect of our treatment on the full sample and by respondents’ party identification, split by the party identification of the politician. Each panel presents the treatment effect on the full sample and by subgroups of respondent party identification. The dependent variable is on a five-point scale ranging from 0 (extremely unlikely) to 4 (extremely likely). All regressions use OLS and control for respondent’s gender, income, race, and level of education.
Fig. 8.
Fig. 8.. Treatment effect on beliefs about wildfire frequency.
This figure presents the effect of the treatment on the full sample and by respondents’ party identification. The dependent variable is the respondents’ belief about how frequent wildfires will become in the next 10 years. The values range from 0 (less common) to 1 (neither more nor less common) to 2 (more common). All regressions use OLS and control for respondent’s gender, income, race, and level of education.

References

    1. IPCC, “Global Warming of 1.5°C. An IPCC Special Report on the impacts of global warming of 1.5°C above pre-industrial levels and related global greenhouse gas emission pathways, in the context of strengthening the global response to the threat of climate change, sustainable development, and efforts to eradicate poverty” (Technical Report Intergovernmental Panel on Climate Change, 2018).
    1. Abatzoglou J. T., Williams A. P., Impact of anthropogenic climate change on wildfire across western US forests. Proc. Natl. Acad. Sci. U.S.A. 113, 11770–11775 (2016). - PMC - PubMed
    1. Gardiner S. M., A perfect moral storm: Climate change, intergenerational ethics and the problem of moral corruption. Environ. Value. 15, 397–413 (2006).
    1. Brody S. D., Zahran S., Vedlitz A., Grover H., Examining the relationship between physical vulnerability and public perceptions of global climate change in the United States. Environ. Behav. 40, 72–95 (2008).
    1. Levin K., Cashore B., Bernstein S., Auld G., Overcoming the tragedy of super wicked problems: Constraining our future selves to ameliorate global climate change. Policy. Sci. 45, 123–152 (2012).