. 2022 Sep 9;8(36):eabn0756.
doi: 10.1126/sciadv.abn0756. Epub 2022 Sep 9.

Proteotype coevolution and quantitative diversity across 11 mammalian species

Affiliations

Proteotype coevolution and quantitative diversity across 11 mammalian species

Qian Ba et al. Sci Adv. .

Abstract

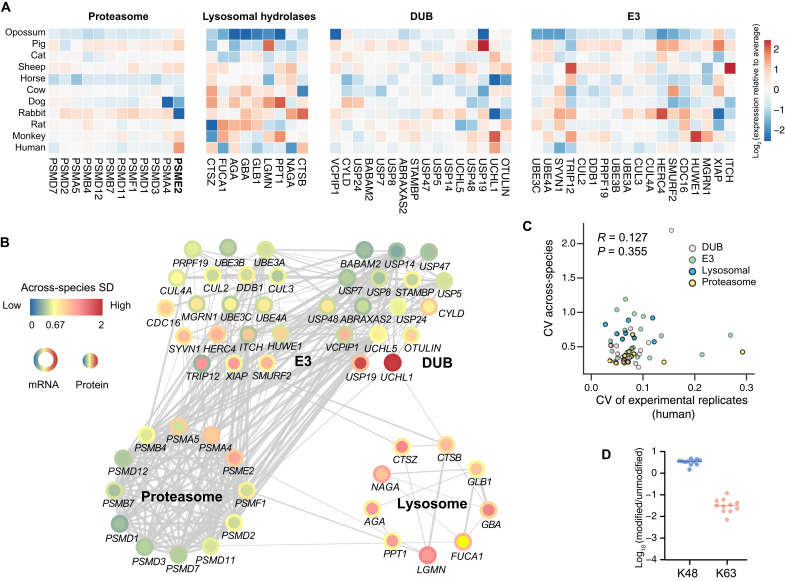
Evolutionary profiling has been largely limited to the nucleotide level. Using consistent proteomic methods, we quantified proteomic and phosphoproteomic layers in fibroblasts from 11 common mammalian species, with transcriptomes as reference. Covariation analysis indicates that transcript and protein expression levels and variabilities across mammals remarkably follow functional role, with extracellular matrix-associated expression being the most variable, demonstrating strong transcriptome-proteome coevolution. The biological variability of gene expression is universal at both interindividual and interspecies scales but to a different extent. RNA metabolic processes particularly show higher interspecies versus interindividual variation. Our results further indicate that while the ubiquitin-proteasome system is strongly conserved in mammals, lysosome-mediated protein degradation exhibits remarkable variation between mammalian lineages. In addition, the phosphosite profiles reveal a phosphorylation coevolution network independent of protein abundance.


Figures

Fig. 1.
Fig. 1.. Identification and quantification overview of transcriptome, proteome, and phosphoproteome across 11 mammalian species.
(A) Phylogenetic relationships among 11 mammalian species including 10 Boreotherian mammals and the opossum M. domestica as an outgroup. In Boreotherian mammals, six LAUT were colored as red, and four EAOG were colored as blue. The transcriptome, proteome, and phosphoproteome in skin fibroblast cells of all these species were shown in Circos plots. The identification numbers of mRNA (TPM > 1), protein, or P-sites in individual species are shown in green, red, and blue colors; created with BioRender.com. (B) Principal component analysis (PCA) of mRNA, protein, and P-site profiles in 11 species. (C and D) Within-species correlation between different layers [mRNA~protein (C) and protein~P-site (D)] of all genes/sites in individual species. Spearman’s rho for every species was individually calculated from all detected genes/sites in single species. (E) Gene-specific and cross-species correlation between different layers (mRNA~protein and protein~P-site). Spearman’s rho for every gene/site was individually calculated from the dataset of 11 species. All rho values were then summarized as violin plots. (F and G) Representative pathways showing different distribution of mRNA~protein (F) and protein~P-site (G) correlation.
Fig. 2.
Fig. 2.. Biological features associated with mRNA-protein coevolution and their quantitative variability across 11 mammalian species.
(A) Highly correlated mRNA-protein pairs tend to coevolve. The distribution of signed geometric (geom) mean of mRNA and protein PIC values at node C13 for each gene with high mRNA-protein PIC correlations (Pearson’s R > 0.8) and other genes. Node C13 separates LAUT from Eurchontoglires. P values, Wilcoxon rank sum test. (B) Number of protein-protein interactions (PPI) of each protein with high (Pearson’s R > 0.8) or low (|Pearson’s R| <0.2) mRNA-protein PIC correlations. P values, Wilcoxon rank sum test. (C) Profiling of SD for mRNA and protein levels and their relationship to gene essentiality (Wilcoxon rank sum test P = 9.948 × 10⁻⁹ and 0.005369 for nonessential versus conditional essential at the mRNA level and 2.644 × 10⁻¹⁵ and 8.203 × 10⁻⁴ at the protein level), haploinsufficiency (P = 2.776 × 10⁻⁴, 3.374 × 10⁻⁷, and 7.44 × 10⁻⁹ for haplo-insensitive versus medium, insensitive versus sensitive, and medium versus sensitive at the mRNA level and 0.005101, 3.243 × 10⁻⁵, and 1.675 × 10⁻⁷ at the protein level), secretome (P = 1.137 × 10⁻⁸ and 2.303 × 10⁻¹⁵ at the mRNA and protein levels), surfaceome (P = 6.176 × 10⁻⁴ and 4.607 × 10⁻⁴ at the mRNA and protein levels), and cancer biomarker annotations (P = 1.514 × 10⁻⁷ and 1.036 × 10⁻⁴ at the mRNA and protein levels) and whether the corresponding proteins are in stable protein complex in the CORUM database (Complex_in) or not (Complex_out). Note that P = 4.556 × 10⁻⁴ and 2.393 × 10⁻⁶ were obtained at the mRNA and protein levels, respectively, for comparing Complex_In and Out groups in cross-species comparison and P = 0.2582 and 3.816 × 10⁻⁶ in the cross-individual comparison. The point range showed the median, 25th, and 75th quantiles, and the histogram showed gene number in each class. SD, SD of the relative expression across 11 species or 11 individuals.
Fig. 3.
Fig. 3.. Functional enrichment analysis revealing protein expression variability control at the posttranscriptional level and between the individual and species scales.
(A) 2D enrichment plot of SD selected GOBPs (gene ontology biological processes) or GOCCs (gene ontology cellular components). The axes denote enrichment scores for SD from the average at mRNA (x axis) and protein (y axis) levels across 11 species. (B) 2D enrichment plot of SD selected GOBPs or GOCCs denoting gene expression variability analysis across species and human individuals. The axes denote enrichment scores for the protein SD from average across 11 species (x axis) and 11 individuals (y axis). rRNA, ribosomal RNA.
Fig. 4.
Fig. 4.. The distinctive interspecies quantitative diversity for proteasomal and lysosomal protein degradation.
(A) Heatmaps visualizing the protein-specific variability in 11 species for proteins detected and annotated as proteasome, lysosomal hydrolases, Ub enzymes including both DUBs and E3 Ub ligases. The color bar represents expressive values relative to the average, as calculated by the log2 (intensity) in the particular species subtracted by mean of the log2 (intensity) across species. (B) Network analysis visualizing STRING interactions between proteins. The outer ring and inner circle are colored for mRNA and protein SDs, respectively. SD, SD of the relative expression across 11 species. (C) The distribution of the quantitative CVs among experimental replicates for human along with the CVs across 11 species. CV, coefficient of variation of the raw scale (before log transformation) expression. (D) The log-scale ratios of modified Ub peptide versus unmodified peptide reference for K48 and K63 that were quantified across species.
Fig. 5.
Fig. 5.. P-site characteristics among 11 mammalian species.
(A) Profiling of SD across 11 species from the average at mRNA, protein, P-site, and protein-corrected P-site levels from the intersecting list between layers. SD, SD of the relative quantification across 11 species. (B) The site-specific parameters and features of the common P-sites (detected in all 11 species) and other human P-sites. P values, Wilcoxon rank sum test. dTm, difference in melting temperature. (C) The sequence logo of surrounding amino acids (±7 amino acids) of common P-sites (detected in all 11 species). (D) Motif analysis of the flanking amino acids (±7 amino acids) around the common P-sites (detected in all 11 species). The representative enriched motifs (four motif examples with >7-fold of enrichment) were shown. (E) Sequence analysis of the flanking amino acids (±7 amino acids) around the P-sites (common P-sites versus other human P-sites). The fold changes (FCs) of significant residues (P < 0.05) were shown. (F) By inferring the binary, quantitative correlation analysis between any P-site pairs, the phosphorylation coevolution network was built on the significantly associated common P-sites (Pearson’s correlation, P < 0.001) after correction by total protein changes. Red lines indicate positive associations while blue lines indicate negative associations. The representative GOBPs of phosphoproteins were highlighted in different colors. The top nine kinases curated from the P-sites as substrates were shown as diamonds, and the kinase-substrates pairs were shown as dashed lines.

References

    1. Müller J. B., Geyer P. E., Colaço A. R., Treit P. V., Strauss M. T., Oroshi M., Doll S., Winter S. V., Bader J. M., Köhler N., Theis F., Santos A., Mann M., The proteome landscape of the kingdoms of life. Nature 582, 592–596 (2020). - PubMed
    1. Wang Z.-Y., Leushkin E., Liechti A., Ovchinnikova S., Mößinger K., Brüning T., Rummel C., Grützner F., Cardoso-Moreira M., Janich P., Gatfield D., Diagouraga B., de Massy B., Gill M. E., Peters A. H. F. M., Anders S., Kaessmann H., Transcriptome and translatome co-evolution in mammals. Nature 588, 642–647 (2020). - PMC - PubMed
    1. Aebersold R., Mann M., Mass-spectrometric exploration of proteome structure and function. Nature 537, 347–355 (2016). - PubMed
    1. Gao E., Li W., Wu C., Shao W., Dia Y., Liu Y., Data-independent acquisition-based proteome and phosphoproteome profiling across six melanoma cell lines reveals determinants of proteotypes. Mol. Omics 17, 413–425 (2021). - PMC - PubMed
    1. Navarro P., Kuharev J., Gillet L. C., Bernhardt O. M., Lean B. M., Röst H. L., Tate S. A., Tsou C.-C., Reiter L., Distler U., Rosenberger G., Perez-Riverol Y., Nesvizhskii A. I., Aebersold R., Tenzer S., A multicenter study benchmarks software tools for label-free proteome quantification. Nat. Biotechnol. 34, 1130–1136 (2016). - PMC - PubMed