. 2022 Sep 9;17(9):e0273616.
doi: 10.1371/journal.pone.0273616. eCollection 2022.

A comparative phytochemical study of nine Lauraceae species by using chemometric data analysis

Affiliations

A comparative phytochemical study of nine Lauraceae species by using chemometric data analysis

Mira Oh et al. PLoS One. .

Abstract

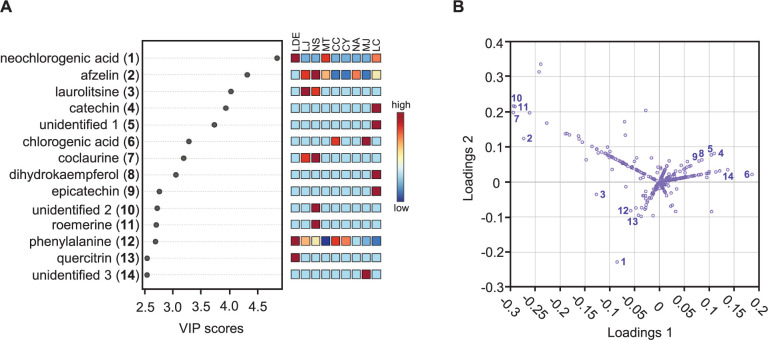
The diversity of secondary metabolites of individual plants results from multiple enzymatic processes in planta and various environmental factors, such as temperature, moisture, and soil conditions. Chemical composition analysis of plants can lead to a new method to understand relationship among comparable plants along with biological classification such as genetic and anatomical method. In this study, the chemical diversity of nine different Lauraceae species was investigated, and the plant samples were chemically analyzed and classified. Multivariate analysis methods, such as PLS-DA, were used to select important metabolites distinguishing the nine Lauraceae species. The selected metabolites were identified through preparative LC-MS or MS/MS fragment pattern analysis. In addition, the chemical dendrogram for the nine Lauraceae species was interpreted through molecular network analysis and compared with the genetic dendrogram. This approach enabled us to compare the complete chemical compositions of multiple plant samples to identify relationships among plants.


Conflict of interest statement

The authors have declared that no competing interests exist.

Figures

Fig 1
Fig 1. Multivariate statistical analysis plots of nine Lauraceae species based on LC-MS spectral data.
(A) PCA score plot. (B) PLS-DA score plot. LDE, Lindera erythrocarpa Makino; LJ, Litsea japonica (Thunb.) Jussieu; NS, Neolitsea sericea (Blume) Koidz.; MT, Machilus thunbergii Siebold & Zucc.; CC, Cinnamomum camphora (L.) J. Presl; CY, C. yabunikkei H. Ohba; NA, N. aciculata (Blume) Koidz.; MJ, M. japonica Siebold & Zucc.; and LC, L. coreana H.Lév.
Fig 2
Fig 2. VIP scores and loading plot obtained using the PLS-DA model for nine Lauraceae metabolites.
(A) Important metabolites identified by PLS-DA. The colored boxes on the right indicate the relative concentrations of the corresponding metabolite in each group under study. (B) Loading plot showing PC1-PC2. The 14 important metabolites selected according to the VIP scores are indicated on the corresponding plots. LDE, Lindera erythrocarpa Makino; LJ, Litsea japonica (Thunb.) Jussieu; NS, Neolitsea sericea (Blume) Koidz.; MT, Machilus thunbergii Siebold & Zucc.; CC, Cinnamomum camphora (L.) J. Presl; CY, C. yabunikkei H. Ohba; NA, N. aciculata (Blume) Koidz.; MJ, M. japonica Siebold & Zucc.; and LC, L. coreana H.Lév.
Fig 3
Fig 3. Representative chemical structures of eleven metabolites contributing to sample discrimination.
(1) neochlorogenic acid; (2) afzelin; (3) laurolitsine; (4) catechin; (6) chlorogenic acid; (7) coclaurine; (8) dihydrokaempferol; (9) epicatechin; (11) roemerine; (12) phenylalanine; and (13) quercitrin.
Fig 4
Fig 4. Bar plots of fourteen metabolites selected as important features according to the VIP scores.
The bar plots show the intensity of the corresponding ions in the nine analyzed Lauraceae samples. LDE, Lindera erythrocarpa Makino; LJ, Litsea japonica (Thunb.) Jussieu; NS, Neolitsea sericea (Blume) Koidz.; MT, Machilus thunbergii Siebold & Zucc.; CC, Cinnamomum camphora (L.) J. Presl; CY, C. yabunikkei H. Ohba; NA, N. aciculata (Blume) Koidz.; MJ, M. japonica Siebold & Zucc.; and LC, L. coreana H.Lév.
Fig 5
Fig 5. Chemical dendrogram of nine Lauraceae species.
A dendrogram was generated based on the chemical components of the samples using the Euclidean distance and Ward’s clustering algorithm. LDE, Lindera erythrocarpa Makino; LJ, Litsea japonica (Thunb.) Jussieu; NS, Neolitsea sericea (Blume) Koidz.; MT, Machilus thunbergii Siebold & Zucc.; CC, Cinnamomum camphora (L.) J. Presl; CY, C. yabunikkei H. Ohba; NA, N. aciculata (Blume) Koidz.; MJ, M. japonica Siebold & Zucc.; and LC, L. coreana H.Lév.
Fig 6
Fig 6. The networking analysis results of the nine Lauraceae species.
A network was generated using MS/MS spectra through classical molecular networking on the GNPS server and visualized with nodes and edges through Cytoscape 3.8.0. The nodes consist of pie charts based on the peak intensity proportion for each metabolite. The thickness of the edges was determined by the similarity between two connected nodes with edge widths ranging from 6.0 to 16.0. The blue, red, and green boxes indicate isoquinoline alkaloids, flavonoids, and lignin clusters, respectively. LDE, Lindera erythrocarpa Makino; LJ, Litsea japonica (Thunb.) Jussieu; NS, Neolitsea sericea (Blume) Koidz.; MT, Machilus thunbergii Siebold & Zucc.; CC, Cinnamomum camphora (L.) J. Presl; CY, C. yabunikkei H. Ohba; NA, N. aciculata (Blume) Koidz.; MJ, M. japonica Siebold & Zucc.; and LC, L. coreana H.Lév.
Fig 7
Fig 7. The chemical composition of Lauraceae samples based on the network analysis.
(A) Clusters annotated as isoquinoline alkaloids or flavonoids through classical molecular networking. The thickness of the edges was determined by the similarity between two connected nodes with edge widths ranging from 6.0 to 16.0. (B) The node composition ratio of isoquinoline alkaloids or flavonoids in each sample. LDE, Lindera erythrocarpa Makino; LJ, Litsea japonica (Thunb.) Jussieu; NS, Neolitsea sericea (Blume) Koidz.; MT, Machilus thunbergii Siebold & Zucc.; CC, Cinnamomum camphora (L.) J. Presl; CY, C. yabunikkei H. Ohba; NA, N. aciculata (Blume) Koidz.; MJ, M. japonica Siebold & Zucc.; and LC, L. coreana H.Lév.
Fig 8
Fig 8. Phylogenetic relationship of Lauraceae samples.
Combined sequences of two universal barcoding regions, trnH-GUG and rbcL, from each sample were used to draw a neighbor-joining tree with 1000 bootstrap replicates. LDE, Lindera erythrocarpa Makino; LJ, Litsea japonica (Thunb.) Jussieu; NS, Neolitsea sericea (Blume) Koidz.; MT, Machilus thunbergii Siebold & Zucc.; CC, Cinnamomum camphora (L.) J. Presl; CY, C. yabunikkei H. Ohba; NA, N. aciculata (Blume) Koidz.; MJ, M. japonica Siebold & Zucc.; and LC, L. coreana H.Lév.

References

    1. Fellows L, Scofield A. Chemical diversity in plants. Intellectual Property Rights and Biodiversity Conservation—An Interdisciplinary Analysis of the Values of Medicinal Plants. 1995; 19–44.
    1. Moghe GD, Last RL. Something old, something new: conserved enzymes and the evolution of novelty in plant specialized metabolism. Plant Physiol. 2015; 169(3):1512–23. doi: 10.1104/pp.15.00994 - DOI - PMC - PubMed
    1. Wink M. Introduction: biochemistry, physiology and ecological functions of secondary metabolites. Annu Plant Rev. 2010; 40:1–19. 10.1002/9781444320503.ch1/ - DOI
    1. Salleh WMNH, Ahmad F, Yen KH, Zulkifli RM. Essential oil compositions of Malaysian Lauraceae: A mini review. Pharm Sci. 2016a; 22(1):60–7. 10.15171/PS.2016.11 - DOI
    1. Wang Y, Zhang L-T, Feng Y-X, Zhang D, Guo S-S, Pang X, et al.. Comparative evaluation of the chemical composition and bioactivities of essential oils from four spice plants (Lauraceae) against stored-product insects. Ind Crops Prod. 2019; 140:111640. 10.1016/j.indcrop.2019.111640 - DOI

Publication types