Observational Study
. 2022 Sep 9;17(9):e0273918.
doi: 10.1371/journal.pone.0273918. eCollection 2022.

Associations of lifetime concussion history and repetitive head impact exposure with resting-state functional connectivity in former collegiate American football players: An NCAA 15-year follow-up study

Affiliations
Observational Study

Associations of lifetime concussion history and repetitive head impact exposure with resting-state functional connectivity in former collegiate American football players: An NCAA 15-year follow-up study

Samuel R Walton et al. PLoS One. .

Abstract

The objective of this study was to examine associations of lifetime concussion history (CHx) and an advanced metric of lifetime repetitive head impact exposure with resting-state functional connectivity (rsFC) across the whole-brain and among large-scale functional networks (Default Mode; Dorsal Attention; and Frontoparietal Control) in former collegiate football players. Individuals who completed at least one year of varsity collegiate football were eligible to participate in this observational cohort study (n = 48; aged 36-41 years; 79.2% white/Caucasian; 12.5±4.4 years of football played; all men). Individuals were excluded if they reported history/suspicion of psychotic disorder with active symptoms, contraindications to participation in study procedures (e.g., MRI safety concern), or inability to travel. Each participant provided concussion and football playing histories. Self-reported concussion history was analyzed in two different ways based on prior research: dichotomous "High" (≥3 concussions; n = 28) versus "Low" (<3 concussions; n = 20); and four ordinal categories (0-1 concussion [n = 19]; 2-4 concussions [n = 8]; 5-7 concussions [n = 9]; and ≥8 concussions [n = 12]). The Head Impact Exposure Estimate (HIEE) was calculated from football playing history captured via structured interview. Resting-state fMRI and T1-weighted MRI were acquired and preprocessed using established pipelines. Next, rsFC was calculated using the Seitzman et al., (2020) 300-ROI functional atlas. Whole-brain, within-network, and between-network rsFC were calculated using all ROIs and network-specific ROIs, respectively. Effects of CHx and HIEE on rsFC values were examined using separate multivariable linear regression models, with a-priori α set to 0.05. We observed no statistically significant associations between rsFC outcomes and either CHx or HIEE (ps ≥ .12). Neither CHx nor HIEE were associated with neural signatures that have been observed in studies of typical and pathological aging. While CHx and repetitive head impacts have been associated with changes in brain health in older former athletes, our preliminary results suggest that associations with rsFC may not be present in early midlife former football players.


Conflict of interest statement

I have read the journal’s policy and the authors of this manuscript have the following competing interests: BLB reports grants and support from the National Institute of Neurological Disorders and Stroke and National Institute on Aging under the National Institutes of Health. KMG reports compensation from National Collegiate Athletic Association for other services and grants from Boston Children’s Hospital (sub-award from the National Football League). MAM acknowledges researching funding from the National Institutes of Health, U.S. Department of Defense, Centers for Disease Control and Prevention, National Collegiate Association and National Football League (via subaward from Boston Children’s Hospital). No other conflicts of interest are declared for the remaining authors.

Figures
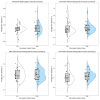
Fig 1
Fig 1. Whole-brain and within-network resting-state functional connectivity (rsFC) in large-scale networks separated by dichotomous concussion history group.
Whole-brain rsFC (top-left) was calculated as the average Pearson r correlation (y-axes) between each of the 300 regions of interest (ROIs) and all other ROIs across the time-series. Within-network rsFC for the Dorsal Attention Network (DAN; top-right), the Default Mode Network (DMN; bottom-left), and the Frontoparietal Control Network (FPCN; bottom-right) was calculated as the average Pearson r correlation between each of the individual ROIs from the given network and all other ROIs within that same network across the time-series. Individual points represent participant-level outcomes for each measure within each of the concussion history groups (White = “Low” [fewer than 3 lifetime concussions]; Blue =“High” [3 or more lifetime concussions]). Boxplots represent the median and interquartile range, and the whiskers extend to 1.5 times the interquartile range. The violin plot is a depiction of the density of individual rsFC values for each measure.
Fig 2
Fig 2. Between-network resting-state functional connectivity (rsFC) in large-scale networks separated by dichotomous concussion history group.
Between-network rsFC was calculated as the average Pearson r correlation (y-axes) between each of the individual ROIs from one specific network and all individual ROIs in another specific network across the time-series: Dorsal Attention Network and Default Mode Network (top-left); Default Mode Network and Frontoparietal Control Network (top-right); and Dorsal Attention Network and Frontoparietal Control Network (bottom). Individual points represent participant-level outcomes for each measure within each of the concussion history groups (White = “Low” [fewer than 3 lifetime concussions]; Blue =“High” [3 or more lifetime concussions]). Boxplots represent the median and interquartile range, and the whiskers extend to 1.5 times the interquartile range. The violin plot is a depiction of the density of individual rsFC values for each measure.
Fig 3
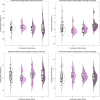
Fig 3. Whole-brain and within-network resting-state functional connectivity (rsFC) in large-scale networks separated by four ordinal concussion history groups.
Whole-brain rsFC (top-left) was calculated as the average Pearson r correlation (y-axes) between each of the 300 regions of interest (ROIs) and all other ROIs across the time-series. Within-network rsFC for the Dorsal Attention Network (DAN; top-right), the Default Mode Network (DMN; bottom-left), and the Frontoparietal Control Network (FPCN; bottom-right) was calculated as the average Pearson r correlation between each of the individual ROIs from the given network and all other ROIs within that same network across the time-series. Individual points represent participant-level outcomes for each measure within each of the concussion history groups (1 = 0 or 1 concussion [n = 19]; 2 = 2 to 4 concussions [n = 8]; 3 = 5 to 7 concussions [n = 9]; and 4 = 8 or more concussions [n = 12]). Boxplots represent the median and interquartile range, and the whiskers extend to 1.5 times the interquartile range. The violin plot is a depiction of the density of individual rsFC values for each measure.
Fig 4
Fig 4. Between-network resting-state functional connectivity (rsFC) in large-scale networks separated by four ordinal concussion history groups.
Between-network rsFC was calculated as the average Pearson r correlation (y-axes) between each of the individual ROIs from one specific network and all individual ROIs in another specific network across the time-series: Dorsal Attention Network and Default Mode Network (top-left); Default Mode Network and Frontoparietal Control Network (top-right); and Dorsal Attention Network and Frontoparietal Control Network (bottom). Individual points represent participant-level outcomes for each measure within each of the concussion history groups (1 = 0 or 1 concussion [n = 19]; 2 = 2 to 4 concussions [n = 8]; 3 = 5 to 7 concussions [n = 9]; and 4 = 8 or more concussions [n = 12]). Boxplots represent the median and interquartile range, and the whiskers extend to 1.5 times the interquartile range. The violin plot is a depiction of the density of individual rsFC values for each measure.
Fig 5
Fig 5. Plots of head impact exposure estimates (HIEE) and average resting-state functional connectivity (rsFC) measures in large-scale networks.
Whole-brain rsFC was calculated as the average Pearson r correlation (y-axes) between each of the 300 regions of interest (ROIs) and all other ROIs across the time-series. Within-network rsFC for the Dorsal Attention Network (DAN), the Default Mode Network (DMN), and the Frontoparietal Control Network (FPCN) was calculated as the average Pearson r correlation between each of the individual ROIs from the given network and all other ROIs within that same network across the time-series. Between-network rsFC was calculated as the average Pearson r correlation between each of the individual ROIs from one specific network and all individual ROIs in another specific network across the time-series: DMN-DAN; DMN-FPCN; and DAN-FPCN. Individual points represent each of the individual participants.

References

    1. Plassman BL, Langa KM, Fisher GG, Heeringa SG, Weir DR, Ofstedal MB, et al.. Prevalence of Dementia in the United States: The Aging, Demographics, and Memory Study. Neuroepidemiology. 2007;29: 125–132. doi: 10.1159/000109998 - DOI - PMC - PubMed
    1. Petersen RC, Lopez O, Armstrong MJ, Getchius TSD, Ganguli M, Gloss D, et al.. Practice guideline update summary: Mild cognitive impairment: Report of the Guideline Development, Dissemination, and Implementation Subcommittee of the American Academy of Neurology. Neurology. 2018;90: 126–135. doi: 10.1212/WNL.0000000000004826 - DOI - PMC - PubMed
    1. Langa KM, Larson EB, Crimmins EM, Faul JD, Levine DA, Kabeto MU, et al.. A Comparison of the Prevalence of Dementia in the United States in 2000 and 2012. JAMA Intern Med. 2017;177: 51. doi: 10.1001/jamainternmed.2016.6807 - DOI - PMC - PubMed
    1. Guskiewicz KM, Marshall SW, Bailes J, McCrea M, Cantu RC, Randolph C, et al.. Association between Recurrent Concussion and Late-Life Cognitive Impairment in Retired Professional Football Players. Neurosurgery. 2005; 719–726. doi: 10.1093/neurosurgery/57.4.719 - DOI - PubMed
    1. Lehman EJ, Hein MJ, Baron SL, Gersic CM. Neurodegenerative causes of death among retired National Football League players. Neurology. 2012;79: 1970–1974. doi: 10.1212/WNL.0b013e31826daf50 - DOI - PMC - PubMed

Publication types