. 2022 Sep 9;17(9):e0273711.
doi: 10.1371/journal.pone.0273711. eCollection 2022.

CCT196969 effectively inhibits growth and survival of melanoma brain metastasis cells

Affiliations

CCT196969 effectively inhibits growth and survival of melanoma brain metastasis cells

Agathe Reigstad et al. PLoS One. .

Abstract

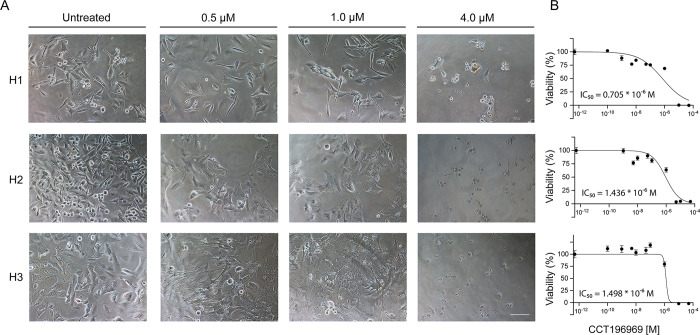
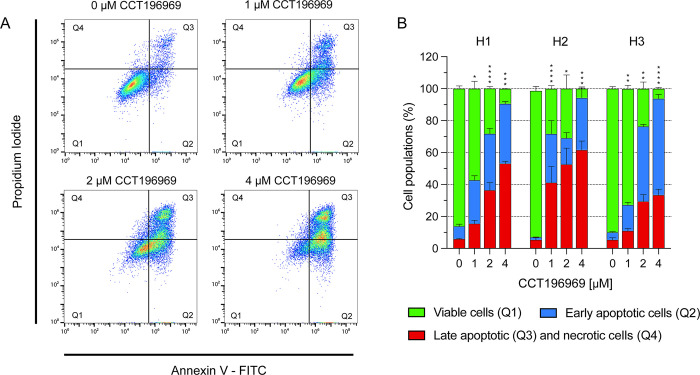
Melanomas frequently metastasize to the brain. Despite recent progress in the treatment of melanoma brain metastasis, therapy resistance and relapse of disease remain unsolved challenges. CCT196969 is a SRC family kinase (SFK) and Raf proto-oncogene, serine/threonine kinase (RAF) inhibitor with documented effects in primary melanoma cell lines in vitro and in vivo. Using in vitro cell line assays, we studied the effects of CCT196969 in multiple melanoma brain metastasis cell lines. The drug effectively inhibited proliferation, migration, and survival in all examined cell lines, with viability IC50 doses in the range of 0.18-2.6 μM. Western blot analysis showed decreased expression of p-ERK, p-MEK, p-STAT3 and STAT3 upon CCT196969 treatment. Furthermore, CCT196969 inhibited viability in two B-Raf Proto-Oncogene (BRAF) inhibitor resistant metastatic melanoma cell lines. Further in vivo studies should be performed to determine the treatment potential of CCT196969 in patients with treatment-naïve and resistant melanoma brain metastasis.


Conflict of interest statement

The authors declare that no competing interests exist.

Figures

Fig 1
Fig 1. CCT196969 treatment reduces viability in MBM cell lines in a dose-dependent manner.
(A) Representative microscopic images (20x objective) of H1, H2 and H3 cells grown in monolayers, exposed to increasing concentrations of CCT196969; untreated, 0.5, 1.0 and 4 μM, for 72 h. Scale bar = 100 μm. (B) Representative viability curves of the cell lines grown as monolayers, exposed to increasing concentrations of CCT196969. The mean IC50 dose value for CCT196969 was calculated from the experimental triplicate and is presented in the graph.
Fig 2
Fig 2. CCT196969 treatment reduces tumour sphere growth in MBM cell lines in a dose-dependent manner.
(A) Representative phase-contrast microscopic images (20x objective) of the H1, H2 and H3 cell lines at different concentrations of CCT196969; untreated, 0.1 and 1 μM. Scale bars = 100 μm. (B) Representative viability curves of the 3 cell lines with the mean IC50 dose of the triplicates. (C) Mean tumour sphere volumes (in mm3) measured after 10 days exposure to different CCT196969 concentrations: untreated, 0.01, 0.05, 0.1 and 1 μM for the H1 and H2 cell lines, and untreated, 0.05, 0.1, 0.5 and 1 for the H3 cell line.
Fig 3
Fig 3. CCT196969 reduces migration in MBM cell lines.
(A) Representative microscopic images (10x objective) of the H1, H2 and H3 cell lines displaying differences in wound confluency at 72 h, untreated or exposed to 0.5 or 1 μM of CCT196969. Scale bar = 300 μm. (B) Representative graphs of the wound confluency in the H1, H2 and H3 cell lines during 72 h. The experiments were done in triplicates.
Fig 4
Fig 4. CCT196969 induces apoptosis in MBM cell lines.
Annexin V labels apoptotic cells and propidium iodide labels necrotic cells. (A) Representative dot plots of the H1 cell line treated with selected concentrations of CCT196969; untreated, 1, 2 and 4 μM. (B) Percentage of viable cells, early apoptotic and late apoptotic and dead cells in the H1, H2 and H3 cell lines. The experiments were done in triplicates. Abbreviations: Q1: Viable cells, Q2: Early apoptotic cells, Q3: Late apoptotic cells, Q4: Necrotic cells. *: p < 0.05, **: p < 0.01, ***: p < 0.001, ****: p < 0.0001.
Fig 5
Fig 5. CCT196969 upregulates expression of cleaved caspase-3 in MBM cell lines.
(A) Western blots showing cleaved caspase-3 from H1 and H3 cells, untreated or treated with 1, 2 or 4 μM CCT196969 for 24 h. (B) Quantification of Western blots against the loading control GAPDH in ratio with the bands of the highest concentration of CCT196969. Due to no expression of cleaved caspase-3 in the untreated groups, expression of cleaved caspase-3 in the highest concentration group was set to 1.0. The experiments were done in triplicates. Abbreviations: ns: not significant, *: p < 0.05, ****: p < 0.0001.
Fig 6
Fig 6. CCT196969 downregulates expression of STAT3, p-STAT3, p-MEK and p-ERK in MBM cell lines.
(A) Western blots from H1 and H3 cells, untreated or treated with selected doses of CCT196969; 1, 2 and 4 μM. (B) Quantification of Western blots normalised against the loading control GAPDH and in ratio with the untreated control. The experiments were done in triplicates. The graphs show the mean with SEM. Abbreviations: ns: not significant, *: p < 0.05, **: p < 0.01, ***: p < 0.001, ****: p < 0.0001.
Fig 7
Fig 7
Cell viability in the vemurafenib-naïve and resistant cell lines after exposure to increasing concentrations of vemurafenib (A, C) and CCT196969 (B, D). (A) Dose response curves after exposure to vemurafenib for H1 and H1-R using the following concentrations: untreated, 1, 2, 4 and 6 μM. (B) Dose response curves for H1 and H1-R after exposure to CCT196969 using the following concentrations: untreated, 0.1, 0.5, 1 and 2 μM. (C) Dose response curves after exposure to vemurafenib for Wm3248 and Wm3248-DR using the following concentrations: untreated, 1, 2, 4 and 6 μM. (D) Dose response curves for Wm3248 and Wm3248-DR after exposure to CCT196969 using the following concentrations: untreated, 0.1, 0.5, 1 and 2 μM. Abbreviations: ns: not significant, **: p < 0.01, ****: p < 0.0001.

References

    1. Ali Z., Yousaf N., and Larkin J., Melanoma epidemiology, biology and prognosis. EJC Suppl, 2013. 11(2): p. 81–91. - PMC - PubMed
    1. Chason J.L., Walker F.B., and Landers J.W., Metastatic carcinoma in the central nervous system and dorsal root ganglia. A prospective autopsy study. Cancer, 1963. 16: p. 781–7. - PubMed
    1. Davies M.A., et al.., Prognostic factors for survival in melanoma patients with brain metastases. Cancer, 2011. 117(8): p. 1687–96. - PubMed
    1. Budman D.R., Camacho E., and Wittes R.E., The current causes of death in patients with malignant melanoma. Eur J Cancer, 1978. 14(4): p. 327–30. - PubMed
    1. Lagerwaard F.J., et al.., Identification of prognostic factors in patients with brain metastases: a review of 1292 patients. Int J Radiat Oncol Biol Phys, 1999. 43(4): p. 795–803. - PubMed

Publication types

Substances