. 2022 Nov 15;82(22):4164-4178.
doi: 10.1158/0008-5472.CAN-22-0237.

An Exercise-Induced Metabolic Shield in Distant Organs Blocks Cancer Progression and Metastatic Dissemination

Affiliations

An Exercise-Induced Metabolic Shield in Distant Organs Blocks Cancer Progression and Metastatic Dissemination

Danna Sheinboim et al. Cancer Res. .

Abstract

Exercise prevents cancer incidence and recurrence, yet the underlying mechanism behind this relationship remains mostly unknown. Here we report that exercise induces the metabolic reprogramming of internal organs that increases nutrient demand and protects against metastatic colonization by limiting nutrient availability to the tumor, generating an exercise-induced metabolic shield. Proteomic and ex vivo metabolic capacity analyses of murine internal organs revealed that exercise induces catabolic processes, glucose uptake, mitochondrial activity, and GLUT expression. Proteomic analysis of routinely active human subject plasma demonstrated increased carbohydrate utilization following exercise. Epidemiologic data from a 20-year prospective study of a large human cohort of initially cancer-free participants revealed that exercise prior to cancer initiation had a modest impact on cancer incidence in low metastatic stages but significantly reduced the likelihood of highly metastatic cancer. In three models of melanoma in mice, exercise prior to cancer injection significantly protected against metastases in distant organs. The protective effects of exercise were dependent on mTOR activity, and inhibition of the mTOR pathway with rapamycin treatment ex vivo reversed the exercise-induced metabolic shield. Under limited glucose conditions, active stroma consumed significantly more glucose at the expense of the tumor. Collectively, these data suggest a clash between the metabolic plasticity of cancer and exercise-induced metabolic reprogramming of the stroma, raising an opportunity to block metastasis by challenging the metabolic needs of the tumor.

Significance: Exercise protects against cancer progression and metastasis by inducing a high nutrient demand in internal organs, indicating that reducing nutrient availability to tumor cells represents a potential strategy to prevent metastasis. See related commentary by Zerhouni and Piskounova, p. 4124.


Figures

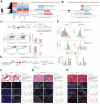
Figure 1. Exercise causes a metabolic shift in tissues. A, Schematic representation of the exercise mouse model. B, Left: heat maps showing proteins differentially expressed in lungs, lymph, liver, and skeletal muscle of active mice versus control with red indicative of upregulation and green indicative of downregulation in the tissues of active mice. Right, proteomaps of KEGG pathways enriched in differentially expressed proteins. C and D, Proteins differentially expressed in active mice enriched for (C) GO biological process and (D) GO cellular compartment identified using GENEONTOLOGY tool. Left: Venn diagram of overlap of the GO terms for proteins differentially expressed in the indicated organs for (C) biological processes and (D) cellular compartment. Right, sum of fold enrichment of the GO terms for all the indicated tissues. E, Left, glucose uptake in single cells originating from the indicated organs evaluated by analysis of fluorescence of 2-NBDG. Right, mean green fluorescence intensity in single cells originating from the indicated organs of the control and active mice relative to intensity in control tissue. F, Glycolytic function of single cells from the indicated organs determined using ECAR measurements. Samples were normalized to their Gapdh mRNA level. Error bars represent ± SEM (n ≥ 4). G, FACS analysis of mitochondrial activity in primary organ cells (lungs, lymph nodes, liver, and skeletal muscles) of control and active mice; TMRE expression is indicative of active mitochondria. Left, representative image of the FACS data shows the TMRE− and TMRE+ cell populations for control and active mice. Right, quantification (% gated cells) from the FACS for control and active mice. Statistical comparison between TMRE− and TMRE+ from each group (control and active) and TMRE+ between control and active groups is presented in the graphs (n > 3 animals in each group). *, P < 0.05; **, P < 0.01; ***, P < 0.001. H, qRT-PCR quantification of the mRNAs encoding the indicated glucose transporters in tissues from active and control mice. Data were normalized to endogenous levels of Gapdh or Hprt. Error bars represent ± SEM (n = 3 independent experiments). *, P < 0.05; **, P < 0.01; ***, P < 0.001.
Figure 1.
Exercise causes a metabolic shift in tissues. A, Schematic representation of the exercise mouse model. B, Left, heatmaps showing proteins differentially expressed in lungs, lymph, liver, and skeletal muscle of active mice versus control with red indicative of upregulation and green indicative of downregulation in the tissues of active mice. Right, proteomaps of KEGG pathways enriched in differentially expressed proteins. C and D, Proteins differentially expressed in active mice enriched for GO biological process (C) and GO cellular compartment (D) identified using GENEONTOLOGY tool. Left, Venn diagram of overlap of the GO terms for proteins differentially expressed in the indicated organs for biological processes (C) and cellular compartment (D). Right, sum of fold enrichment of the GO terms for all the indicated tissues. E, Left, glucose uptake in single cells originating from the indicated organs evaluated by analysis of fluorescence of 2-NBDG. Right, mean green fluorescence intensity in single cells originating from the indicated organs of the control and active mice relative to intensity in control tissue. F, Glycolytic function of single cells from the indicated organs determined using ECAR measurements. Samples were normalized to their Gapdh mRNA level. Error bars, ± SEM (n ≥ 4). G, FACS analysis of mitochondrial activity in primary organ cells (lungs, lymph nodes, liver, and skeletal muscles) of control and active mice; TMRE expression is indicative of active mitochondria. Left, representative image of the FACS data shows the TMRE and TMRE+ cell populations for control and active mice. Right, quantification (% gated cells) from the FACS for control and active mice. Statistical comparison between TMRE and TMRE+ from each group (control and active) and TMRE+ between control and active groups is presented in the graphs (n > 3 animals in each group). H, qRT-PCR quantification of the mRNAs encoding the indicated glucose transporters in tissues from active and control mice. Data were normalized to endogenous levels of Gapdh or Hprt. Error bars, ± SEM (n = 3 independent experiments). *, P < 0.05; **, P < 0.01; ***, P < 0.001.
Figure 2. High-intensity activities reduce metastatic cancer likelihood. A, Schematic representation of human exercise model. B, Venn diagrams showing an overlap of 16 pathways based on a GO enrichment analysis of differential proteins found in the plasma of the routinely active subjects (n = 3 males and n = 3 females) after a 30-minute run on the treadmill. C, The top four GO-enriched pathways of the 16 overlapped GO terms. D, The relative contributions of carbohydrates (CHO) and fats to the total substrate utilization prior to exercise and during moderate and high-intensity during a graded exercise test performed on a motorized treadmill. E, Fold enrichments of hazard ratio (HR) from a prospective cohort study among 2,734 cancer-free participants that were followed for 20 years, with indicated SEER stages of cancer classified into inactive (ref), low–moderate intensity (<6 metabolic equivalent, MET), and high-intensity exercise (>6 MET). “w” indicates the analysis for propensity score weighted model. *, P < 0.05. F, Relative exercise intensity of individuals with a cancer diagnosis during the 20 years of follow-up that were classified as SEER 0–4 compared with those with cancers classified as SEER 7.
Figure 2.
High-intensity activities reduce metastatic cancer likelihood. A, Schematic representation of human exercise model. B, Venn diagrams showing an overlap of 16 pathways based on a GO enrichment analysis of differential proteins found in the plasma of the routinely active subjects (n = 3 males and n = 3 females) after a 30-minute run on the treadmill. C, The top four GO-enriched pathways of the 16 overlapped GO terms. D, The relative contributions of carbohydrates (CHO) and fats to the total substrate utilization prior to exercise and during moderate and high-intensity during a graded exercise test performed on a motorized treadmill. E, Fold enrichments of hazard ratio (HR) from a prospective cohort study among 2,734 cancer-free participants that were followed for 20 years, with indicated SEER stages of cancer classified into inactive, low–moderate intensity (<6 metabolic equivalent, MET), and high-intensity exercise (>6 MET). F, Relative exercise intensity of individuals with a cancer diagnosis during the 20 years of follow-up that was classified as SEER 0–4 compared with those with cancers classified as SEER 7.
Figure 3. Exercise inhibits melanoma metastasis formation. A, Schematic of the subdermal melanoma mouse model. B, Left, representative images of mice from the control and active groups. Right, calculated tumor volumes. Error bars represent ± SEM (n = 16 mice per group). *, P < 0.05; **, P < 0.01. C, Left, FACS analysis of single cells from the lymph nodes, lungs, and liver of control and active mice subdermally injected with Ret-mCherry–labeled melanoma cells. mCherry-negative stromal cells are in green and mCherry-positive melanoma cells are in red. Right, fold change in mCherry-positive cells in active mice relative to controls based on the FACS analysis. Error bars represent ± SEM (n = 8 group). **, P < 0.01; ***, P < 0.001. D, Experimental design for intracarotid injection. Controls were sedentary. Active mice were exercised pre and post tumor cell injection or only preinjection. E, Left, bioluminescence images of lungs taken from control and exercised mice. Right, photon quantification of melanoma metastases plotted as fold change relative to control. Error bars represent ± SEM (n = 20 mice in control and active “pre and post” groups). **, P < 0.01. F, qRT-PCR quantification of melanoma markers mCherry, Tyrp1, and Mlana in the lungs of “pre and post” group. Data were normalized to Hprt and are plotted relative to quantities in control mice. Error bars represent ± SEM (n ≥ 3 independent experiments). ***, P < 0.001. G, Left, bioluminescence images of melanoma in the lungs taken from control mice and mice exercised only before intracarotid injection of tumor cells. Right, photon quantification of melanoma metastases plotted as fold change relative to control. Error bars represent ± SEM (n = 8 mice in each group). ***, P < 0.001. H, qRT-PCR quantification of melanoma markers mCherry, Tyrp1, and Mlana in the lungs of control mice and mice exercised only before intracarotid injection of tumor cells. Data were normalized to Hprt. Error bars represent ± SEM (n ≥ 3 independent experiments). ***, P < 0.001. I, Experimental design for the coculture of the melanoma cells and primary cells for microscopy analysis. J, Left, immunofluorescent images of melanoma cells that express mCherry seeded on adhered primary cells from the lymph nodes, lungs, and livers of control and active mice. Right, percent melanoma cell numbers relative to total cell numbers quantified in brightfield images. Error bars represent ± SEM (n = 3 independent experiments). *, P < 0.05. K, FACS analysis of GFP-labeled Ret-melanoma cells cocultured with primary lung cells of control and active mice. GFP+ (melanoma) and GFP− (primary lung cells). Top, representational dot plots from FACS analysis. Bottom, calculation of GFP+ cells based on the FACS analysis. Error bars represent ± SEM (n = 6 animals in each group). **, P < 0.01. L, FACS analysis of mCherry-labeled Ret-melanoma with primary lung cells from active and control animals. Top (vehicle treated): Left, representative image of % gated of mCherry+ cells with vehicle-treated primary cells from active and control mice. Right, graph representing fold change of surviving melanoma cells cocultured with either active or control primary cells. Bottom (rapamycin treated): left, representative image of % gated of mCherry+ cells with rapamycin (100 nmol/L) treated primary cells from active and control mice. Right, graph representing fold change of surviving melanoma cells cocultured with either active or control primary cells. Error bars represent ± SEM (n > 3 animals in each group). ***, P < 0.001.
Figure 3.
Exercise inhibits melanoma metastasis formation. A, Schematic of the subdermal melanoma mouse model. B, Left, representative images of mice from the control and active groups. Right, calculated tumor volumes. Error bars, ± SEM (n = 16 mice per group). C, Left, FACS analysis of single cells from the lymph nodes, lungs, and liver of control and active mice subdermally injected with Ret-mCherry–labeled melanoma cells. Green, mCherry-negative stromal cells; red, mCherry-positive melanoma cells. Right, fold change in mCherry-positive cells in active mice relative to controls based on the FACS analysis. Error bars, ± SEM (n = 8 group). D, Experimental design for intracarotid injection. Controls were sedentary. Active mice were exercised pre- and post-tumor cell injection or only preinjection. E, Left, bioluminescence images of lungs taken from control and exercised mice. Right, photon quantification of melanoma metastases plotted as fold change relative to control. Error bars, ±SEM (n = 20 mice in control and active “pre and post” groups). F, qRT-PCR quantification of melanoma markers mCherry, Tyrp1, and Mlana in the lungs of “pre and post” group. Data were normalized to Hprt and are plotted relative to quantities in control mice. Error bars, ±SEM (n ≥ 3 independent experiments). G, Left, bioluminescence images of melanoma in the lungs taken from control mice and mice exercised only before intracarotid injection of tumor cells. Right, photon quantification of melanoma metastases plotted as fold change relative to control. Error bars, ± SEM (n = 8 mice in each group). H, qRT-PCR quantification of melanoma markers mCherry, Tyrp1, and Mlana in the lungs of control mice and mice exercised only before intracarotid injection of tumor cells. Data were normalized to Hprt. Error bars, ± SEM (n ≥ 3 independent experiments). I, Experimental design for the coculture of the melanoma cells and primary cells for microscopy analysis. J, Left, immunofluorescent images of melanoma cells that express mCherry seeded on adhered primary cells from the lymph nodes, lungs, and livers of control and active mice. Right, percent melanoma cell numbers relative to total cell numbers quantified in brightfield images. Error bars, ± SEM (n = 3 independent experiments). K, FACS analysis of GFP-labeled Ret-melanoma cells cocultured with primary lung cells of control and active mice. GFP+ (melanoma) and GFP (primary lung cells). Top, representational dot plots from FACS analysis. Bottom, calculation of GFP+ cells based on the FACS analysis. Error bars, ± SEM (n = 6 animals in each group). L, FACS analysis of mCherry-labeled Ret-melanoma with primary lung cells from active and control animals. Top (vehicle treated) left, representative image of percent gated of mCherry+ cells with vehicle-treated primary cells from active and control mice. Right, graph representing fold change of surviving melanoma cells cocultured with either active or control primary cells. Bottom (rapamycin treated) left, representative image of percent gated of mCherry+ cells with rapamycin (100 nmol/L)-treated primary cells from active and control mice. Right, graph representing fold change of surviving melanoma cells cocultured with either active or control primary cells. Error bars, ± SEM (n > 3 animals in each group). *, P < 0.05; **, P < 0.01; ***, P < 0.001.
Figure 4. Metabolic cross-talk between cancer cells and stroma. A, Left, heatmap of the normalized expression of genes from TCGA data set (rows) classified as benign nevi, atypical nevi, vertical growth phase melanoma (VGP), and in situ melanoma compared with melanoma metastases of indicated tissues (Supplementary Table S3). Red indicates high expression; blue indicates low expression. Right: KEGG enrichment analysis of the genes upregulated and downregulated in metastatic melanoma. B, KEGG enrichment analysis if genes downregulated in primary melanomas of mice exercised pre and post melanoma cell injection compared with control mice (3). C, top, experimental design for the coculture of the melanoma cells and primary cells for mitochondrial activity (stained by TMRE) by FACS (as indicated). Bottom left, FACS analysis of the mitochondrial activity in GFP-labeled Ret-melanoma cells cocultured with primary lung cells of control and active mice; TMRE expression is indicative of active mitochondria. Bottom right, calculation of TMRE+ cells in primary lung cells (top) melanoma (bottom) based on the FACS analysis. Error bars represent ± SEM (n = 6 animals in each group). *, P < 0.05. D, Schematic representation of the glucose uptake assay. E, Top and middle, FACS analysis of the uptake of 2-NBDG by melanoma (mCherry+) and stromal (mCherry−) cells originating from the lungs and lymph nodes. Bottom, intensity of the signal from 2-NBDG in stroma and melanoma from lungs and lymph of control and active mice. F and G, Left: Hematoxylin and eosin staining (20× magnification) and immunofluorescence analysis (40× magnification) of S100-Beta (green) and GLUT1, ALDOA, or COMPLEX I (red) in (F) lungs, (G) lymph nodes, and (H) livers. DAPI-stained nuclei appear in blue. White-dashed lines indicate tumor (T)–stroma (S) boundaries. Right, quantification of the red and green mean fluorescence intensities in the tumor and stroma normalized to DAPI mean fluorescence intensity using ImageJ. t test statistical comparison is represented: *, (black) indicates a t-test GLUT1, ALDOA, or COMPLEX I (red) comparison of the control and active animals in stroma or tumor regions; + indicates a t-test GLUT1 (red), ALDOA (red), COMPLEX I (red) of S100-beta (green) comparison of the stroma and tumor regions of the control animals; λ indicates a t test GLUT1 (red), ALDOA (red), COMPLEX I (red), or S100- Beta (green) comparison of the stroma and tumor regions of active animals. Error bars represent ± SEM (n > 15 fields from each area (stroma or tumor for each target) in at least three images). + or * or λ, P < 0.05; ++ or ** or λλ, P < 0.001; +++ or *** or λλλ, P < 0.001.
Figure 4.
Metabolic cross-talk between cancer cells and stroma. A, Left, heatmap of the normalized expression of genes from TCGA data set (rows) classified as benign nevi, atypical nevi, vertical growth phase melanoma (VGP), and in situ melanoma compared with melanoma metastases of indicated tissues (Supplementary Table S3). Red, high expression; blue, low expression. Right, KEGG enrichment analysis of the genes upregulated and downregulated in metastatic melanoma. B, KEGG enrichment analysis if genes downregulated in primary melanomas of mice exercised pre- and post-melanoma cell injection compared with control mice (3). C, Top, experimental design for the coculture of the melanoma cells and primary cells for mitochondrial activity (stained by TMRE) by FACS (as indicated). Bottom left, FACS analysis of the mitochondrial activity in GFP-labeled Ret-melanoma cells cocultured with primary lung cells of control and active mice; TMRE expression is indicative of active mitochondria. Bottom right, calculation of TMRE+ cells in primary lung cells (top) and melanoma (bottom) based on the FACS analysis. Error bars, ± SEM (n = 6 animals in each group). D, Schematic representation of the glucose uptake assay. E, Top and middle, FACS analysis of the uptake of 2-NBDG by melanoma (mCherry+) and stromal (mCherry) cells originating from the lungs and lymph nodes. Bottom, intensity of the signal from 2-NBDG in stroma and melanoma from lungs and lymph of control and active mice. F–H, Left, hematoxylin and eosin staining (×20 magnification) and immunofluorescence analysis (×40 magnification) of S100-beta (green) and GLUT1, ALDOA, or COMPLEX I (red) in lungs (F), lymph nodes (G), and livers (H). Blue, DAPI-stained nuclei. White-dashed lines, tumor (T)–stroma (S) boundaries. Right, quantification of the red and green mean fluorescence intensities in the tumor and stroma normalized to DAPI mean fluorescence intensity using ImageJ. t test statistical comparison is represented: *, black, a t test GLUT1, ALDOA, or COMPLEX I (red) comparison of the control and active animals in stroma or tumor regions; +, a t test GLUT1 (red), ALDOA (red), COMPLEX I (red) of S100-beta (green) comparison of the stroma and tumor regions of the control animals; •, t test GLUT1 (red), ALDOA (red), COMPLEX I (red), or S100-beta (green) comparison of the stroma and tumor regions of active animals. Error bars, ± SEM [n > 15 fields from each area (stroma or tumor for each target) in at least three images]. + or * or •, P < 0.05; ++ or ** or ••, P < 0.001; +++ or *** or •••, P < 0.001.

Comment in

  • Running to Outcompete Metastasis.
    Zerhouni M, Piskounova E. Zerhouni M, et al. Cancer Res. 2022 Nov 15;82(22):4124-4125. doi: 10.1158/0008-5472.CAN-22-2898. Cancer Res. 2022. PMID: 36377384

References

    1. Moore SC, Lee I-M, Weiderpass E, Campbell PT, Sampson JN, Kitahara CM, et al. . Association of leisure-time physical activity with risk of 26 types of cancer in 1.44 million adults. JAMA Intern. Med. 2016;176:816–25. - PMC - PubMed
    1. Brown JC, Gilmore LA. Physical activity reduces the risk of recurrence and mortality in cancer patients. Exerc Sport Sci Rev 2020;48:67–73. - PMC - PubMed
    1. Pedersen L, Idorn M, Olofsson GH, Lauenborg B, Nookaew I, Hansen RH, et al. . Voluntary running suppresses tumor growth through epinephrine- and IL-6-dependent NK cell mobilization and redistribution. Cell Metab 2016;23:554–62. - PubMed
    1. Hojman P, Gehl J, Christensen JF, Pedersen BK. Molecular mechanisms linking exercise to cancer prevention and treatment. Cell Metab 2018;27:10–21. - PubMed
    1. Pedersen L, Christensen JF, Hojman P. Effects of exercise on tumor physiology and metabolism. Cancer J 2015;21:111–6. - PubMed

Publication types