. 2022 Dec;6(12):e2200197.
doi: 10.1002/adbi.202200197. Epub 2022 Sep 9.

Extracellular Matrix Modulates Outgrowth Dynamics in Ovarian Cancer

Affiliations

Extracellular Matrix Modulates Outgrowth Dynamics in Ovarian Cancer

Sarah Alshehri et al. Adv Biol (Weinh). 2022 Dec.

Abstract

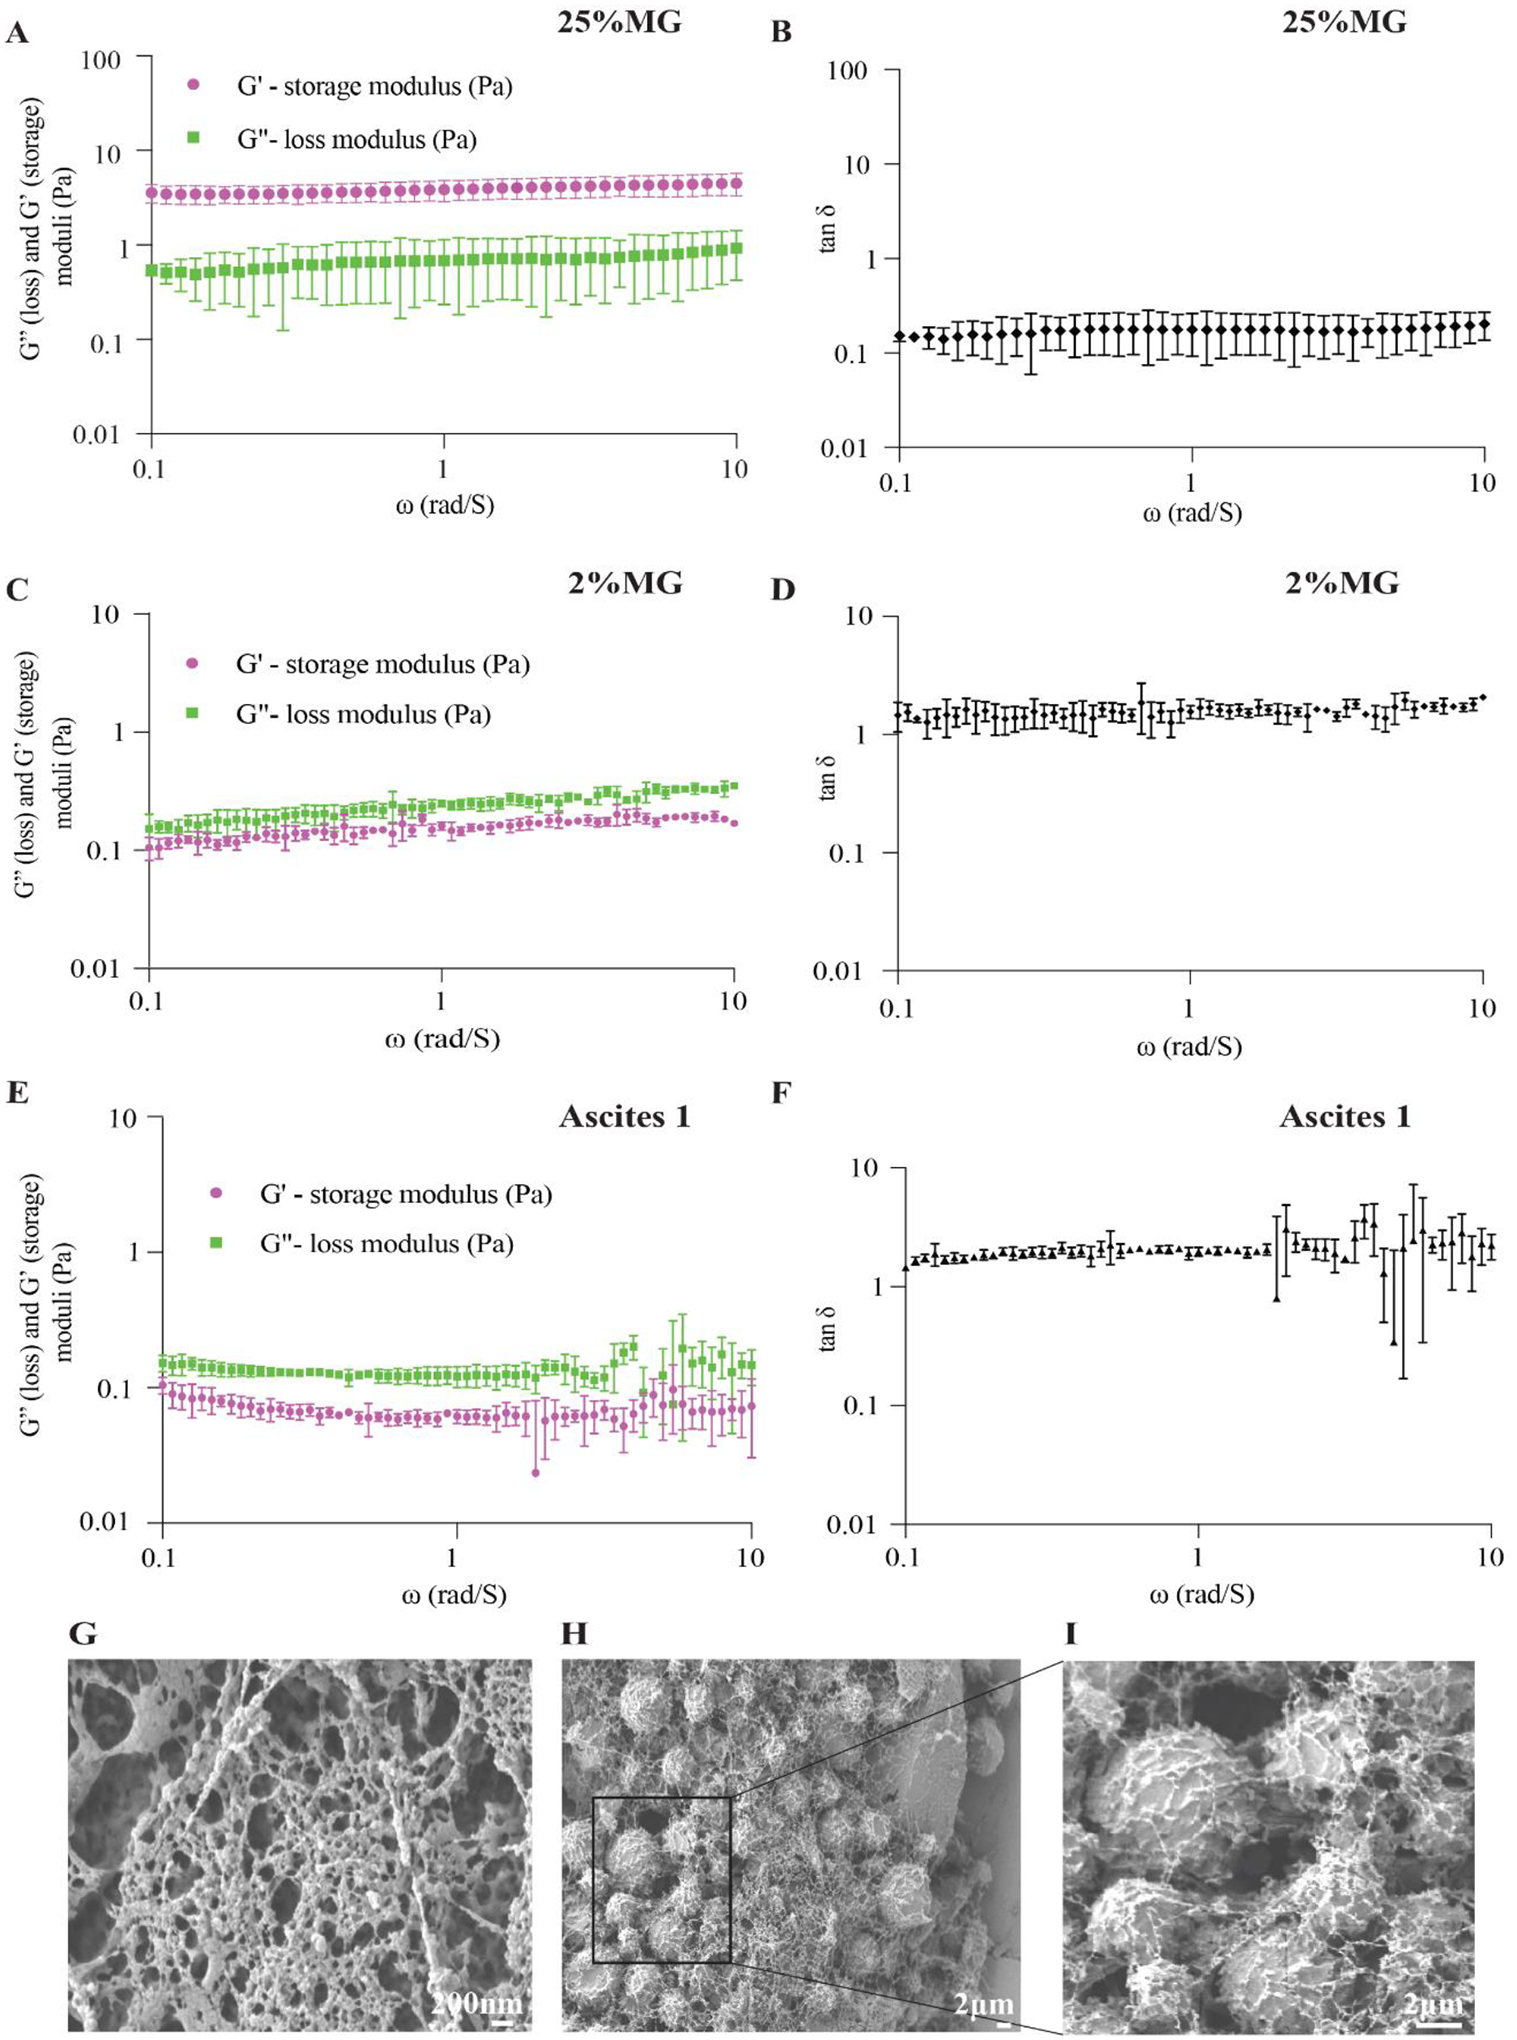
Ovarian carcinoma (OC) forms outgrowths that extend from the outer surface of an afflicted organ into the peritoneum. OC outgrowth formation is poorly understood due to the limited availability of cell culture models examining the behavior of cells that form outgrowths. Prompted by immunochemical evaluation of extracellular matrix (ECM) components in human tissues, laminin and collagen-rich ECM-reconstituted cell culture models amenable to studies of cell clusters that can form outgrowths are developed. It is demonstrated that ECM promotes outgrowth formation in fallopian tube non-ciliated epithelial cells (FNE) expressing mutant p53 and various OC cell lines. Outgrowths are initiated by cells that underwent outward translocation and retained the ability to intercalate into mesothelial cell monolayers. Electron microscopy, optical coherence tomography, and small amplitude oscillatory shear experiments reveal that increased ECM levels led to increased fibrous network thickness and high shear elasticity of the microenvironment. These physical characteristics are associated with outgrowth suppression. The low ECM microenvironment mimicks the viscoelasticity of malignant peritoneal fluid (ascites) and supports cell proliferation, cell translocation, and outgrowth formation. These results highlight the importance of the ECM microenvironment in modulating OC growth and can provide additional insights into the mode of dissemination of primary and recurrent ovarian tumors.

Keywords: ascites; collagen; extracellular matrix; laminin γ1; outgrowths; ovarian cancer; tumor microenvironment.


Conflict of interest statement

Competing Interest Statement. The authors declare no competing interests.

Figures

Figure 1.
Figure 1.
Immuno and chemical evaluation of laminin γ1 and collagen. (A, B) PAX8-positive OC outgrowths, and PAX8-negative surrounding connective tissue. Representative images of laminin γ1 (C, D), and collagen (E, F) expression in tumors protruding from human ovary (C, E), or in xenograft experiments, from the surface of the omentum (D, F). Red arrows point to the deposition of laminin γ1. Blue arrows indicate fibrillar collagen structures within the tumor’s connective tissue, whereas black arrows represent collagen deposition within tumors. Quantification of laminin γ1 (G, I) and collagen (H, J) expression in PAX8-positive tumor outgrowths and PAX8-negative surrounding tissue. Each data point represents one region of interest (ROI) within tumor outgrowth or surrounding stroma. In each group, G: 51, H: 59, I: 38, and J: 45 ROIs/ condition (tumor and stroma). All data points are shown with bars indicating mean ± SD. An unpaired, two-tailed, non-parametric Mann-Whitney test was used to examine statistical differences between data sets. Intensity values are normalized to background level (area without tissue) after RGB image conversion to 8-bit gray scale (0–255 pixels range).[33] Bars are 100 μm and 50 μm in boxed area.
Figure 2.
Figure 2.
OC before and after chemotherapy is associated with spatially distinct laminin γ1 and collagen ECM microenvironments. (A) Hematoxylin and PAX8 stain of high-grade serous ovarian cancer (HGSOC) growing within the ovary before chemotherapy; bar is 100μm. (B) Laminin γ1 and (C) collagen deposition in matched omental tissue of HGSOC before and after chemotherapy; bar is 500μm. (D) H-score quantification of laminin γ1 positivity in matched tissue samples representing HGSOC before and after taxane-platin therapy. Tissues were analyzed from three patients (n=3). Wilcoxon sum rank test was used to compare the difference between the groups, NS= Not-Statistically different. Data points are presented as mean ± SD. (E) Quantification of collagen expression in omental metastases before and after chemotherapy. Each data point represents one region of interest (ROI); Before: 82 & After: 160 ROIs. All data points are shown with bars indicating mean ± SD. An unpaired, two-tailed, parametric student t-test with Welch’s correction was used to examine statistical differences between data sets. Intensity values are normalized to background level (area without tissue) after RGB image conversion to 8-bit grayscale (0–255 pixels range).[33]
Figure 3.
Figure 3.
Laminin- and collagen-rich ECM reconstitution stimulates outgrowths in suspended cultures of various OC cells. (A) Graphical representation of the assay design to study outgrowth dynamics. (B) Representative bright-field images of outgrowth formation in FNE cells expressing plasmid containing m-p53R175H (FNE-m-p53), or control plasmid, and cultured as suspended clusters reconstituted with 2% MG. Cell structures were cultured for 7 days before imaging and subsequently followed for an additional 72 hrs. (C) Quantification of 3D structure (spheroid) expansion, where each dot represents fold change in area, over 72 hrs of filming time, in a spheroid. Total spheroids: 8 for FNE & 10 for FNE-m-p53. All data points are shown with bars indicating mean ± SD. An unpaired, two-tailed, parametric student t-test with Welch’s correction was used to examine statistical differences between data sets. (D) Quantification of cell clusters with outgrowths in FNE-m-p53 or FNE cells. Bar represents an average percentage of outgrowth formation with at least 30 cell clusters analyzed. (E) Representative bright-field images of outgrowths in Hey-A8 and TYK-nu ovarian cancer cell lines, and quantification of outgrowths in Hey-A8 or TYK-nu. Bars represent an average percentage of outgrowth formation in three independent experiments with 20–30 spheroids scored per experiment. Scale bars are 200 μm.
Figure 4.
Figure 4.
Detached outgrowths clear mesothelial monolayers. (A) Schematic representation of Hey-A8 outgrowth detachment and co-culture with mesothelial cells expressing GFP. Created with BioRender.com. (B) Representative bright-field image of a spheroid before outgrowth detachment, followed by representative bright-field and fluorescent images of mesothelial clearance by Hey-A8 spheroid (black arrow) or detached outgrowth (white arrows); scale bar is 200 μm. (C) Quantification of mesothelial clearance by Hey-A8 spheroids and detached outgrowths.[39] Each data point represents a spheroid or outgrowth from two independent experiments from 69 spheroids and 43 outgrowths. (D) Representative bright-field and corresponding fluorescent maximum projection images of a Hey-A8 spheroid forming an outgrowth and treated with propidium iodide (PI) to spatially visualize cell death within the structure; scale bar is 200 μm. (E) Quantification of PI incorporation by spheroids or outgrowths. Twenty-one Hey-A8 cell structures were analyzed. In C and E all data points are shown with bars indicating mean ± SD, and an unpaired, two-tailed, non-parametric, Mann-Whitney test was used to examine statistical differences between data sets.
Figure 5.
Figure 5.
Elevation of ECM concentration inhibits outgrowths. Representative bright-field maximum Z-projection images of (A) FNE-m-p53 spheroids reconstituted with 2% or 25% MG; scale bar is 250 μm. (B) Hey-A8 spheroids reconstituted with 2% or 25% MG; scale bar is 500 μm. Spheroids were grown for 10 days, and the images show the final time point. Dot plots represent the distribution of outgrowth lengths from individual spheroids reconstituted with 2% or 25% MG. All data are shown with bars indicating mean ± SD. An unpaired, two-tailed, parametric student t-test with Welch’s correction was used to examine statistical differences between data sets. (C) Representative electron scanning micrographs representing 2% and 25% MG. (D) Representative OCT B-scan images of 2% and 25% MG; scale bars are 100 μm. (E) Representative OCT depth-resolved intensity profiles where the slopes from optical attenuation are removed. (F) Amplitude spectra of the spatial frequency corresponding to the panel -E- show relatively stronger low-frequency components from 25% MG, and exponential fit of local peaks indicating a faster decay rate in 25% MG.
Figure 6.
Figure 6.
ECM modulates viscoelastic properties in the OC culture microenvironment. Measurements of storage (elastic) and loss (viscous) moduli in OC cell culture media reconstituted with 2% or 25% of MG (A, C); or in ascites isolated from OC patients with a relapsed disease (E). (B, D, F) Graphs represent calculated tan δ from values reported in A, C & E. (G, H, I) Scanning electron micrographs represent the ascitic fibrous network surrounding tumor cells. Each data point represents the mean and SD from triplicate measurements with a total of 41 (25% MG), 91 (2% MG) & 91 (ascites) measurements.
Figure 7.
Figure 7.
Elevation of ECM concentration suppresses directional cell translocation. (A) Graphical illustration of confinement ratio quantification. (B) Representative trajectory images of cell translocation within FNE-m-p53 or (D) Hey-A8 cell monolayers overlayed with 2% or 25% MG. Each line represents a single cell trajectory formed during 50 frames/time interval. Time zero corresponds to the first 50 frames; scale bar 100 μm. Distribution of confinement ratio within (C) FNE-m-p53 or (E) Hey-A8 cell monolayers overlayed with various concentrations of MG. Each dot represents one field of view that contained 20–100 cells/ condition (2% vs. 25% MG). All data points are shown with bars indicating mean ± SD. Two independent experiments were performed with a total of 12–30 fields of view. An unpaired, two-tailed, parametric student t-test with Welch’s correction was used to examine statistical differences between data sets. (F) Graphical representation of key findings in this study. Created with BioRender.com

References

    1. Kurman RJ, Shih IM. The origin and pathogenesis of epithelial ovarian cancer: a proposed unifying theory. Am J Surg Pathol [Internet] 2010. [cited 2022 Apr 16];34(3):433–43. Available from: https://pubmed.ncbi.nlm.nih.gov/20154587/ - PMC - PubMed
    1. Auersperg N Ovarian surface epithelium as a source of ovarian cancers: unwarranted speculation or evidence-based hypothesis? Gynecol Oncol [Internet] 2013. [cited 2022 Apr 16];130(1):246–51. Available from: https://pubmed.ncbi.nlm.nih.gov/23558054/ - PubMed
    1. Folkins AK, Jarboe EA, Saleemuddin A, Lee Y, Callahan MJ, Drapkin R, et al. A candidate precursor to pelvic serous cancer (p53 signature) and its prevalence in ovaries and fallopian tubes from women with BRCA mutations. Gynecol Oncol [Internet] 2008. [cited 2022 Apr 16];109(2):168–73. Available from: https://pubmed.ncbi.nlm.nih.gov/18342932/ - PMC - PubMed
    1. Meserve EEK, Brouwer J, Crum CP. Serous tubal intraepithelial neoplasia: the concept and its application. Mod Pathol [Internet] 2017. [cited 2022 Apr 16];30(5):710–21. Available from: https://pubmed.ncbi.nlm.nih.gov/28106106/ - PubMed
    1. Karst AM, Drapkin R. Ovarian cancer pathogenesis: a model in evolution. J Oncol [Internet] 2010. [cited 2022 Apr 16];2010:1–13. Available from: https://pubmed.ncbi.nlm.nih.gov/19746182/ - PMC - PubMed

Publication types