. 2022 Dec 1;71(12):2642-2655.
doi: 10.2337/db22-0117.

Stem Cell Therapy Improves Human Islet Graft Survival in Mice via Regulation of Macrophages

Affiliations

Stem Cell Therapy Improves Human Islet Graft Survival in Mice via Regulation of Macrophages

Wenyu Gou et al. Diabetes. .

Abstract

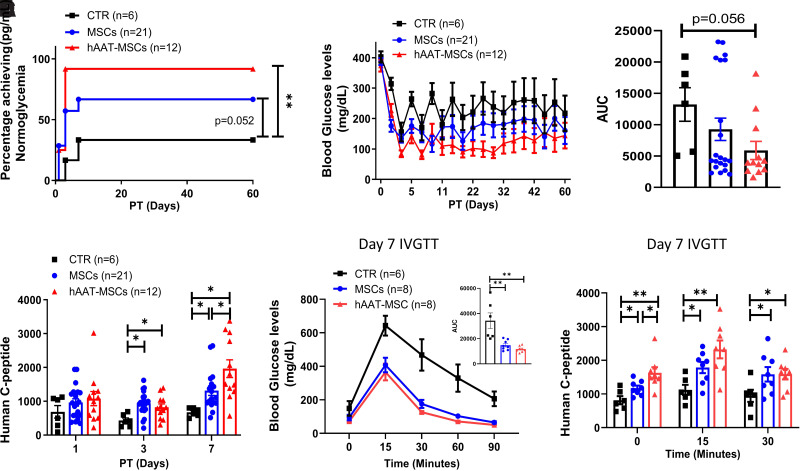
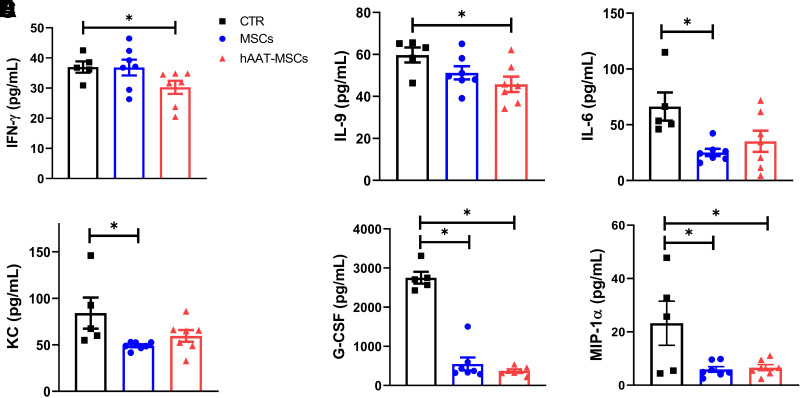
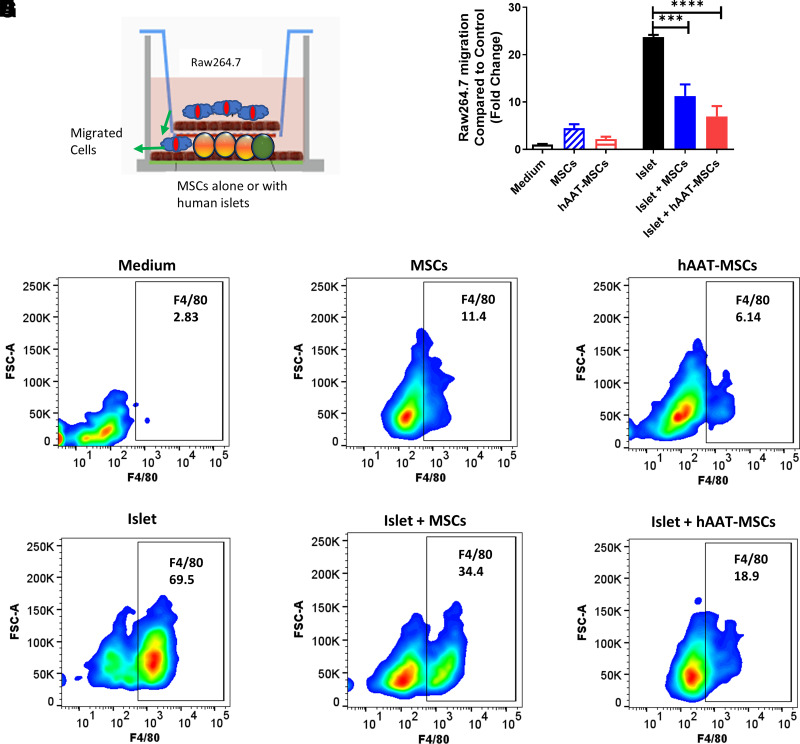
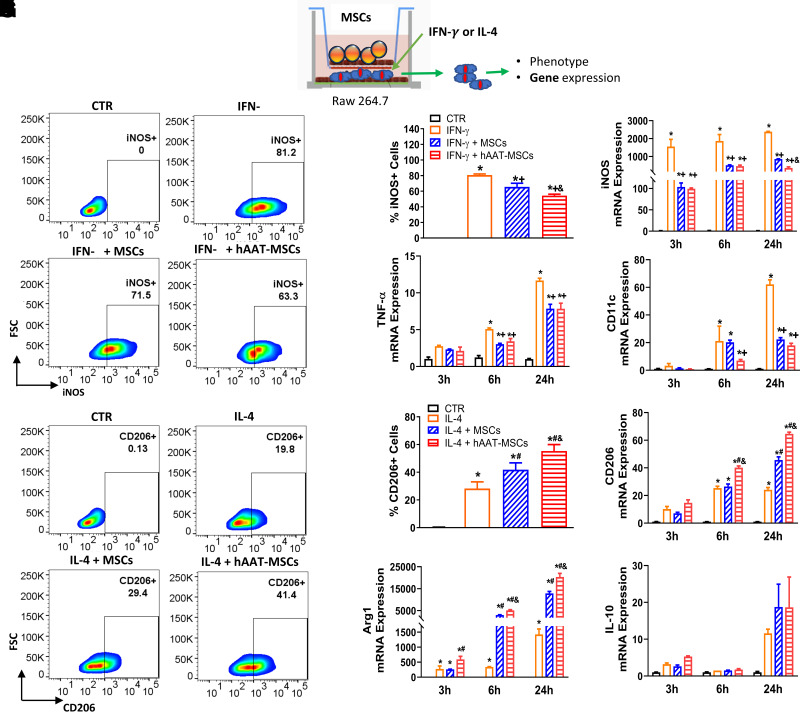
Islet/β-cell transplantation offers great hope for patients with type 1 diabetes. We assessed the mechanisms of how intrahepatic coinfusion of human α-1 antitrypsin (hAAT)-engineered mesenchymal stromal cells (hAAT-MSCs) improves survival of human islet grafts posttransplantation (PT). Longitudinal in vivo bioluminescence imaging studies identified significantly more islets in the livers bearing islets cotransplanted with hAAT-MSCs compared with islets transplanted alone. In vitro mechanistic studies revealed that hAAT-MSCs inhibit macrophage migration and suppress IFN-γ-induced M1-like macrophages while promoting IL-4-induced M2-like macrophages. In vivo this translated to significantly reduced CD11c+ and F4/80+ cells and increased CD206+ cells around islets cotransplanted with hAAT-MSCs as identified by multiplex immunofluorescence staining. Recipient-derived F4/80+and CD11b+ macrophages were mainly present in the periphery of an islet, while CD11c+ and CD206+ cells appeared inside an islet. hAAT-MSCs inhibited macrophage migration and skewed the M1-like phenotype toward an M2 phenotype both in vitro and in vivo, which may have favored islet survival. These data provide evidence that hAAT-MSCs cotransplanted with islets remain in the liver and shift macrophages to a protective state that favors islet survival. This novel strategy may be used to enhance β-cell survival during islet/β-cell transplantation for the treatment of type 1 diabetes or other diseases.


Figures

Figure 1
Figure 1
Cotransplantation of hAAT-MSCs with human islets led to better islet graft survival and function. Suboptimal numbers of human islets (17 islets/g body wt per mouse) were transplanted into the liver of diabetic NOD-SCID mice. A: Percentages of mice reaching normoglycemia at 60 days PT (**P < 0.01, log-rank test). B: BG levels in CTR, MSCs, and hAAT-MSCs mice. C: Mean area under the curve (AUC) of BG levels in each group. D: Nonfasting serum human C-peptide levels at days 1, 3, and 7 PT. E: BG levels and area under the curve (insets) during an IVGTT in mice at day 7 PT. F: Stimulated human C-peptide levels before and at 15 and 30 min after IVGTT initiation. AD: n = 6 in CTR, n = 21 in MSCs, and n = 12 in hAAT-MSCs. E and F: n = 6 in CTR, n = 8 in MSCs and hAAT-MSCs. Mice were randomly picked for the IVGTT. Data are shown as mean ± SEM. *P < 0.05, **P < 0.01, by ANOVA with Tukey post hoc test.
Figure 2
Figure 2
Visualization of Luc+ islets or Luc+ MSCs after intraportal islet transplantation into NOD-SCID recipients. A: Longitudinal in vivo images of representative Luc+ islets transplanted alone (CTR) or with MSCs or hAAT-MSCs at different days PT. B: Bioluminescence levels at days 1, 3, 7, and 28 PT are shown by pseudo-colored heat maps, and scale bars are photons/s/cm2/sr (p/sec/cm2/sr). A and B: n = 4 in each group. C: Longitudinal in vivo images of representative mice receiving human islets and Luc+ MSCs (Luc+MSC1, 0.5 × 10⁶; Luc+MSC2:,1 × 106) at 1, 3, and 7 days PT. D: Bioluminescence level is shown by pseudo-colored heat maps, and scale bars are photons/s/cm2/sr. E: Luminescence levels in liver, intestine, pancreas, kidney, and lung from mice receiving human islets alone (CTR) or human islets with Luc+MSCs or from Luc transgenic mice (Luc+ Organs). F and G: Immunofluorescent staining of GFP+ and AAT+ cells in islets from hAAT-MSC mice at day 3 PT (green, GFP; red, insulin; white, AAT). White arrows point to GFP+ cells. H: Serum AAT levels in MSCs and hAAT-MSCs mice at 7 PT. At least three mice were included in each group. Data are shown as mean ± SEM. *P < 0.05 and ***P < 0.001 by ANOVA with Tukey post hoc test. Conc., concentration.
Figure 3
Figure 3
Mice receiving MSCs or hAAT-MSCs cotransplantation had larger islet mass as analyzed with immunofluorescent staining at day 28 PT. A: Hematoxylin-eosin (H.E.) staining of NOD-SCID liver sections bearing human islet grafts in mice receiving islet alone (CTR) or MSCs or hAAT-MSCs cotransplantation at day 28 PT. Black circles mark islets. Scale bar = 1,000 μm. B: Representative islets stained for insulin and glucagon from whole liver sections of mice receiving islets only or islets with MSCs or hAAT-MSCs. Red, insulin; white, glucagon; blue, nuclei. Scale bar = 100 μm. C and E: Averages of numbers of islets (C), insulin+ area (D), and glucagon+ area (E) per liver section in CTR, MSCs, or hAAT-MSCs livers. For each group, three whole liver sections at least 150 μm apart from each mouse were analyzed. A total of three mice were included in each group. Among them, 127 islets from control, 361 islets from MSCs, and 360 islets from hAAT-MSCs groups were individually analyzed. Data are shown as mean ± SEM. *P < 0.05, **P < 0.01 by ANOVA with Tukey post hoc test.
Figure 4
Figure 4
Reduced inflammatory cytokine levels in recipients bearing islets and MSCs compared with controls at day 1 PT. A: Serum cytokines IFN-γ (A), IL-9 (B), IL-6 (C), KC (D), G-CSF (E), and MIP-1α (F) from CTR (n = 5), MSC (n = 7), or hAAT-MSC (n = 7) mice at 1 day PT measured with the Bio-Plex Pro Mouse Cytokine 23-plex Assay kit. Data are shown as mean ± SEM. *P < 0.05 by ANOVA with Tukey post hoc test.
Figure 5
Figure 5
MSCs or hAAT-MSCs suppress macrophage migration in the Transwell coculture system. A: Schematic diagram of the Transwell system with Raw264.7 cells (blue) and MSCs or hAAT-MSCs (yellow) cultured alone or with human islets (green). B: Fold changes of Raw264.7 cells migrated to the Transwell’s lower well compared with control. x-axis represents the content in the lower cell culture well. CH: Representative flow cytometry data show the presence of macrophages in the low chamber in different groups. Medium: no cells placed in lower wells. MSCs: MSCs were seeded in the lower well. hAAT-MSCs: hAAT-MSCs were seeded in the lower well. Islet: human islets were cultured in the lower well. Islet + MSCs: human islets and MSCs were cultured in the lower well. Islet + hAAT-MSCs: Human islets and hAAT-MSCs were cultured in the lower well. Data were from three independent experiments. *P < 0.05 by ANOVA with Tukey post hoc test. FSC-A, forward scatter area.
Figure 6
Figure 6
Coculture with MSCs or hAAT-MSCs suppresses M1 and promotes M2 macrophage polarization in Raw264.7 cells. A: Diagram of the Transwell system when Raw264.7 cells were stimulated with IFN-γ (100 ng/mL) or IL-4 (10 ng/mL). B: The representative pseudo-color plots of iNOS+ in Raw264.7 cells (1 × 10⁵) stimulated with IFN-γ in the absence or presence of MSCs (2 × 10⁵) and hAAT-MSCs (2 × 10⁵) as analyzed by flow cytometry. C: Percentages of iNOS+ cells Raw264.7 in cells cultured alone, stimulated with IFN-γ in the absence or presence of MSCs or hAAT-MSCs. DF: Relative mRNA expression of M1-related genes (iNOS, TNF-α, and CD11c) divided by β-actin expression in Raw264.7 cells treated with IFN-γ in the presence of MSCs or hAAT-MSCs. G: Representative pseudo-color plots of CD206+ cells in Raw264.7 cells (1 × 10⁵) stimulated with IL-4 in the absence or presence of MSCs (2 × 10⁵) and hAAT-MSCs (2 × 10⁵) as analyzed by flow cytometry. H: Percentage of CD206+ Raw264.7 cells in cells cultured alone, stimulated with IL-4 in the absence or presence of MSCs or hAAT-MSCs. IK: Relative mRNA expression of M2-related genes (CD206, Arg-1, and IL-10) in Raw267.4 cells treated with IL-4 in the presence of MSCs or hAAT-MSCs, divided by β-actin expression. Data are shown as mean ± SEM. *P < 0.05 vs. CTR, +P < 0.05 vs. IFN-γ, #P < 0.05 vs. IL-4, and &P < 0.05 MSCs vs. hAAT-MSCs by ANOVA with Tukey post hoc test. Data are from at least three individual experiments. FSC, forward scatter.
Figure 7
Figure 7
Analysis of insulin staining and different macrophage subtypes with multiplex immunofluorescence staining in livers bearing islets at 3 days PT. AC: Scanning photos of whole liver (scale bar = 3 mm) bearing islet grafts (each square contains one islet). Scale bar in individual staining slide = 50 μm. Red, insulin; yellow, CD11b; green, CD11c; cyan, CD206; brown, F4/80; blue, nuclei. D: Average numbers of islet per liver section in mice from different groups. EI: Cell counts per islet cluster of insulin+ (E), CD11b+ (F), CD11c+ (G), CD206+ (H), and F4/80+ (I). Ratio of CD206+ to CD11c+ per islet in mice receiving islets alone (CTR), with MSCs or hAAT-MSCs around an islet (J). Each cell type within 25 μm around an islet was counted. Three mice were analyzed in each group. In each mouse, whole liver sections from at least 150 μm apart (nine sections total) were used for staining. Data are shown as mean ± SEM. *P < 0.05, **P < 0.01, ***P < 0.001 by ANOVA with Tukey post hoc test.

References

    1. Ramzy A, Thompson DM, Ward-Hartstonge KA, et al. . Implanted pluripotent stem-cell-derived pancreatic endoderm cells secrete glucose-responsive C-peptide in patients with type 1 diabetes. Cell Stem Cell 2021;28:2047–2061.e5 - PubMed
    1. Shapiro AM, Pokrywczynska M, Ricordi C. Clinical pancreatic islet transplantation. Nat Rev Endocrinol 2017;13:268–277 - PubMed
    1. Sutherland DE, Radosevich DM, Bellin MD, et al. . Total pancreatectomy and islet autotransplantation for chronic pancreatitis. J Am Coll Surg 2012;214:409–424; discussion 424–426 - PMC - PubMed
    1. Abdi R, Fiorina P, Adra CN, Atkinson M, Sayegh MH. Immunomodulation by mesenchymal stem cells: a potential therapeutic strategy for type 1 diabetes. Diabetes 2008;57:1759–1767 - PMC - PubMed
    1. Dominici M, Le Blanc K, Mueller I, et al. . Minimal criteria for defining multipotent mesenchymal stromal cells. The International Society for Cellular Therapy position statement. Cytotherapy 2006;8:315–317 - PubMed

Publication types