. 2022 Oct:56:102452.
doi: 10.1016/j.redox.2022.102452. Epub 2022 Aug 30.

Chenodeoxycholic acid suppresses AML progression through promoting lipid peroxidation via ROS/p38 MAPK/DGAT1 pathway and inhibiting M2 macrophage polarization

Affiliations

Chenodeoxycholic acid suppresses AML progression through promoting lipid peroxidation via ROS/p38 MAPK/DGAT1 pathway and inhibiting M2 macrophage polarization

Jinting Liu et al. Redox Biol. 2022 Oct.

Erratum in

Abstract

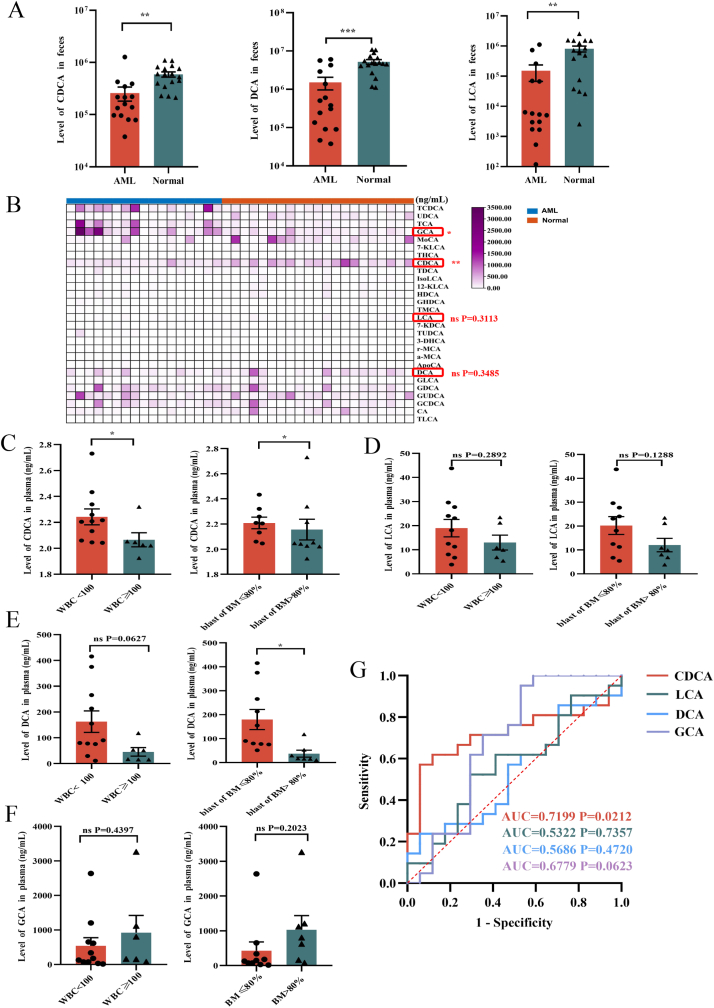
Purpose: Bile acids are steroid synthesized in liver, which are essential for fat emulsification, cholesterol excretion and gut microbial homeostasis. However, the role of bile acids in leukemia progression remains unclear. We aim at exploring the effects and mechanisms of chenodeoxycholic acid (CDCA), a type of bile acids, on acute myeloid leukemia (AML) progression.

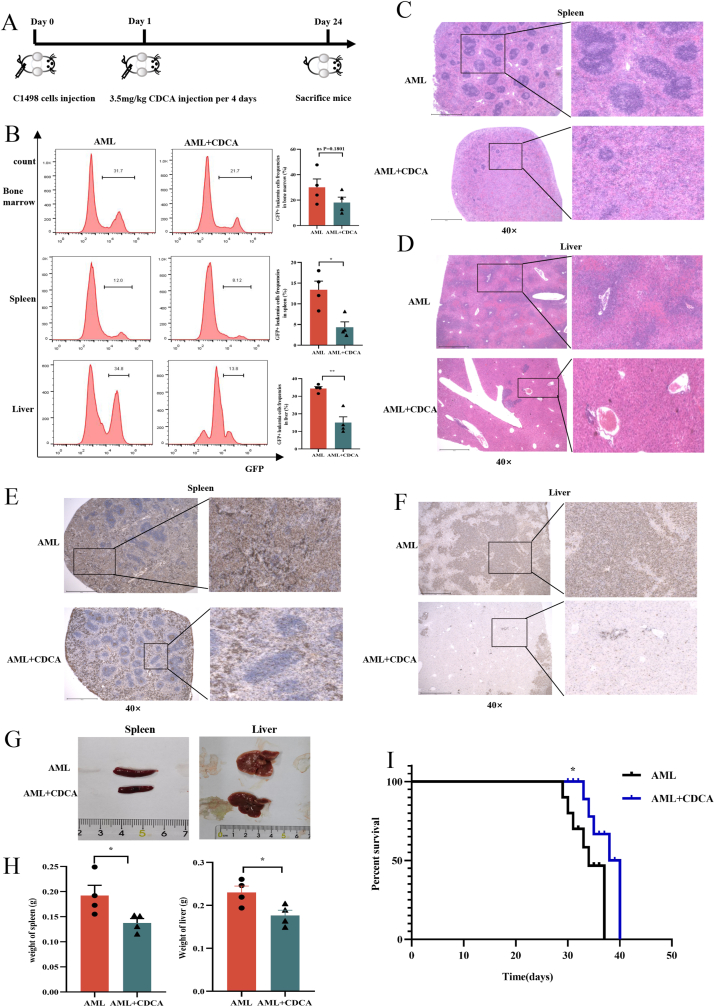
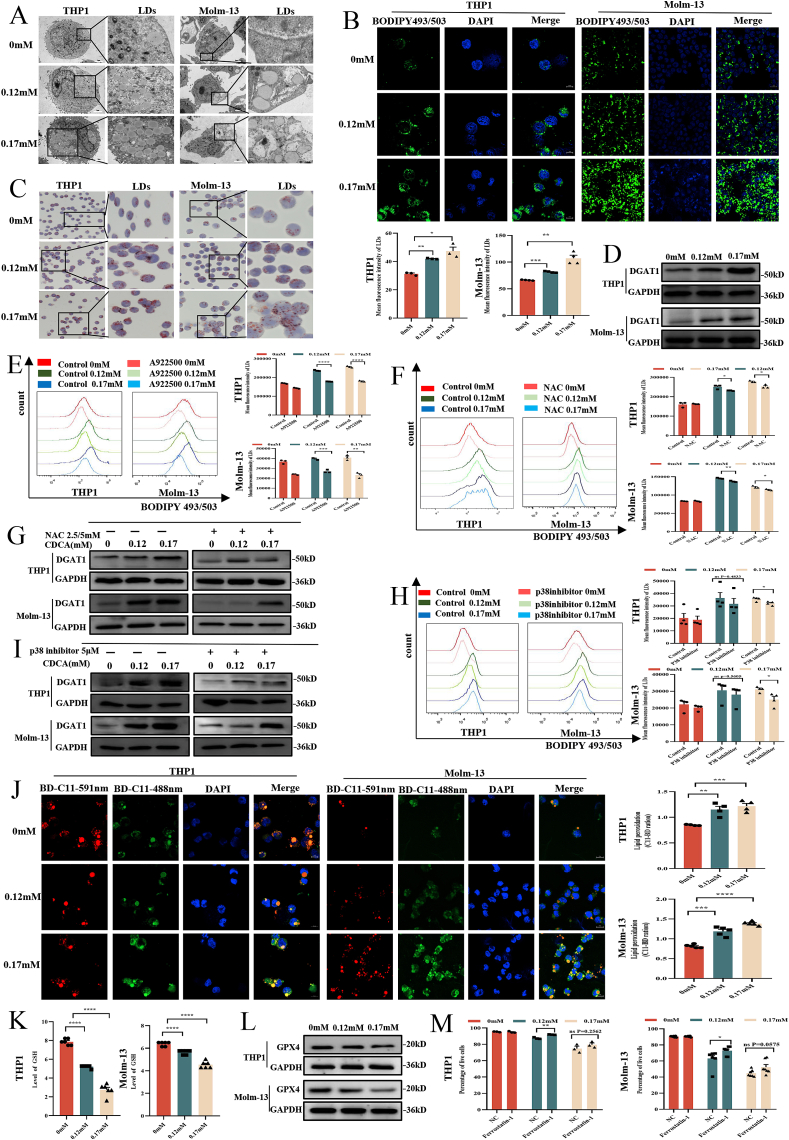
Results: Here, we found that CDCA was decreased in feces and plasma of AML patients, positively correlated with the diversity of gut microbiota, and negatively associated with AML prognosis. We further demonstrated that CDCA suppressed AML progression both in vivo and in vitro. Mechanistically, CDCA bound to mitochondria to cause mitochondrial morphology damage containing swelling and reduction of cristae, decreased mitochondrial membrane potential and elevated mitochondrial calcium level, which resulted in the production of excessive reactive oxygen species (ROS). Elevated ROS further activated p38 MAPK signaling pathway, which collaboratively promoted the accumulation of lipid droplets (LDs) through upregulating the expression of the diacylglycerol O-acyltransferase 1 (DGAT1). As the consequence of the abundance of ROS and LDs, lipid peroxidation was enhanced in AML cells. Moreover, we uncovered that CDCA inhibited M2 macrophage polarization and suppressed the proliferation-promoting effects of M2 macrophages on AML cells in co-cultured experiments.

Conclusion: Our findings demonstrate that CDCA suppresses AML progression through synergistically promoting LDs accumulation and lipid peroxidation via ROS/p38 MAPK/DGAT1 pathway caused by mitochondrial dysfunction in leukemia cells and inhibiting M2 macrophage polarization.

Keywords: Acute myeloid leukemia; Chenodeoxycholic acid; Lipid droplets; Mitochondria.


Conflict of interest statement

Declaration of competing interest The authors declare no competing financial interests.

Figures

Fig. 1
Fig. 1
Microbiota-associated CDCA is decreased in feces and plasma of AML patients and its low level predicts poor prognosis (A)The levels of chenodeoxycholic acids (CDCA), Lithocholic acids (LCA), and Deoxycholic acids (DCA) in fecal samples of AML patients (n = 15) and normal people (n = 17) were determined by LC-MS. (B) Heatmap of abundance of different bile acids in periphery blood serum from AML patients (n = 17) and normal people (n = 21). (C) The relation between the level of CDCA and the white blood cells in peripheral blood or the blast cells in bone marrow was shown. (D–F) The relation between the level of DCA, LCA or GCA with the white blood cells in peripheral blood or the blast cells in bone marrow was shown. (G) The ROC curves of CDCA, LCA, DCA or GCA were shown. P-values were determined using student's t-test and Wilcoxon rank test. Error bars represent as mean ± SEM. ns: Not significant; *p < 0.05; **p < 0.01; ***p < 0.001, ****p < 0.0001.
Fig. 2
Fig. 2
CDCA inhibits the proliferation and promotes the apoptosis of AML cells (A) CCK8 analysis of cell viability of THP1 (n = 4) and Molm-13 (n = 4) treated with CDCA at different concentrations of 0, 0.10, 0.12, 0.15, 0.17, 0.20 mmol/L at 0, 24, 48h was shown. (B) EdU analysis of cell proliferation of THP1 (n = 3) and Molm-13 (n = 6) at concentrations of 0, 0.12, 0.17 mmol/L CDCA for 24h was shown. And the corresponding histograms were shown on the right. (C) The colony formation assays of THP1 (n = 3) and Molm-13 (n = 3) at concentrations of 0, 0.12, 0.17 mmol/L CDCA for 24h were shown. And the corresponding histograms were shown on the right. (D) The apoptosis analysis of THP1 (n = 6) and Molm-13 (n = 3) at concentrations of 0, 0.12, 0.17 mmol/L CDCA for 24h was shown. And the statistical histograms were shown on the right. (E) The apoptosis assay of primary leukemia cells after being treated with 0, 0.12, 0.17 mmol/L CDCA for 24h was shown (n = 8). And the corresponding histograms were shown on the right. P-values were determined using student's t-test or Wilcoxon rank test. Error bars represent mean ± SEM. ns: Not significant; *p < 0.05; **p < 0.01; ***p < 0.001, ****p < 0.0001.
Fig. 3
Fig. 3
CDCA suppresses AML progression in homograft and xenograft mouse models (A) Schematic diagram of the mouse experimental processes. (B) The frequency of leukemia cells (GFP + leukemia cells) in bone marrow, spleen and liver from AML-control mice (n = 4) and AML-CDCA mice (n = 4) was shown. And the corresponding histograms were shown on the right. (C–F) Representative images of HE histopathology and Ki67 immunohistochemical staining sections of spleen and liver from AML-CDCA group and AML-control group (n = 4) were shown. All microscopic analysis was performed with original magnification × 40. Scale bar = 1000 μm. (G–H) The photographs and weights of spleens and livers from AML-control mice (n = 4) and AML-CDCA mice (n = 4) were shown. (I) The Kaplan-Meier survival curve of AML mice was shown (n = 6). P-values were determined using student's t-test and Wilcoxon rank test. Error bars represent mean ± SEM. ns: Not significant; *p < 0.05; **p < 0.01; ***p < 0.001, ****p < 0.0001.
Fig. 4
Fig. 4
CDCA binds to mitochondria and induces mitochondrial dysfunction in AML cells (A) THP1 or Molm-13 cell were treated with 0.17 mmol/L FITC-labeled CDCA. After 24h, AML cells were collected and incubated with MDR and were detected by confocal microscope to visualize the location of CDCA and mitochondria. The representative images were shown. Scale bar = 5 μm (B) Representative images of mitochondria in THP1 and Molm-13 detected by TEM were shown. Scale bar = 1 μm or 0.2 μm. (C) Representative images of mitochondrial mass of THP1 and Molm-13 using MDR detected by confocal microscope were shown (n = 3). And the corresponding histograms were shown on the right. Scale bar = 10 μm. (D) Mitochondrial membrane potential of THP1 and Molm-13 using JC-1 measured by flow cytometry was shown (n = 3). And the corresponding histograms were shown on the right. (E) Rhod-2 AM kit was used to examine calcium among mitochondria in THP1 (n = 3) and Molm-13 (n = 4) cells. Representative images detected by confocal microscope were shown. And the corresponding histograms were shown on the right. Scale bar = 10 μm. P-values were determined using student's t-test and Wilcoxon rank test. Error bars represent mean ± SEM. ns: Not significant; *p < 0.05; **p < 0.01; ***p < 0.001, ****p < 0.0001.
Fig. 5
Fig. 5
CDCA-induced mitochondrial dysfunction causes excessive ROS production, which further activates p38 MAPK in AML cells (A) DCFH-DA was used to examine ROS in cytoplasm of THP1 (n = 4) and Molm-13 (n = 3) cells after being treated with 0, 0.12, 0.17 mmol/L CDCA for 24h. Representative images detected by flow cytometry were shown. And the corresponding histograms were shown below the images. (B) MitoSOX assay was employed to determine ROS in mitochondria of THP1 and Molm-13 cells after being treated with 0, 0.12, 0.17 mmol/L CDCA for 24h. Representative images detected by confocal microscope were shown (n = 3). And the corresponding histograms were shown below the images. Scale bar = 10 μm. (C) Western blot analysis of p38 and p-p38 in THP1 and Molm-13 cells after being treated with 0, 0.12, 0.17 mmol/L CDCA for 24h was shown. (D) Western blot analysis of p38 and p-p38 in THP1 and Molm-13 cells after being treated with 0, 0.12, 0.17 mmol/L CDCA for 24h with or without NAC pretreatment was shown. (E) Apoptosis assays of THP1 (n = 6) and Molm-13 (n = 4) cells after being treated with 0, 0.12, 0.17 mmol/L CDCA for 24h with or without NAC pretreatment was shown. And the corresponding histograms were shown on the right. (F) Apoptosis assays of THP1 (n = 3) and Molm-13 (n = 3) cells after being treated with 0, 0.12, 0.17 mmol/L CDCA for 24h with or without p38 inhibitor pretreatment was shown. And the corresponding histograms were shown on the right. P-values were determined using student's t-test and Wilcoxon rank test. Error bars represent mean ± SEM. ns: Not significant; *p < 0.05; **p < 0.01; ***p < 0.001, ****p < 0.0001.
Fig. 6
Fig. 6
CDCA causes LDs accumulation and lipid peroxidation through ROS/p38 MAPK/DGAT1 pathway in AML cells (A) Representative images of LDs in THP1 and Molm-13 detected by transmission electron microscope (TEM) were shown. The scale bar was 1 μm. (B) Representative images of LDs of THP1 (n = 3) and Molm-13 (n = 4) using BODIPY 493/503 measured by confocal microscope were shown. And the corresponding histograms were shown below the images. Scale bar = 10 μm. (C) Representative images of THP1 and Molm-13 using Oil Red O staining were shown. (D) Western blot analysis of DGAT1 protein after CDCA treatment was shown. (E) The representative images of LDs in THP1 and Molm-13 cells after 0, 0.12, 0.17 mmol/L CDCA treatment for 24h with or without A922500 pretreatment were shown (n = 3). And the corresponding histograms were shown on the right. (F) The representative images of LDs in THP1 and Molm-13 cells after being treated with 0, 0.12, 0.17 mmolm/L CDCA with or without NAC pretreatment were shown (n = 3). And the corresponding histograms were shown on the right. (G) Western blot analysis of DGAT1 in THP1 and Molm-13 cells after 0, 0.12, 0.17 mmol/L CDCA treatment for 24h with or without NAC pretreatment was shown. (H) The representative images of LDs in THP1 and Molm-13 cells after 0, 0.12, 0.17 mmol/L CDCA treatment for 24h with or without p38 inhibitor pretreatment were shown (n = 4). And the corresponding histograms were shown on the right. (I) Western blot analysis of DGAT1 in THP1 and Molm-13 cells after 0, 0.12, 0.17 mmol/L CDCA treatment for 24h with or without p38 inhibitor pretreatment was shown. (J) Representative images of THP1 (n = 4) and Molm-13 (n = 5) using BODIPY 581/591 C11(BD-C11) staining were shown. Red (591 nm) and green (488 nm) fluorescence indicate total and peroxidized lipids respectively. Quantitation of lipid peroxidation (the ratio of green to red) was exhibited on the right. Scale bar = 10 μm. (K) Quantitation of GSH levels are shown after CDCA treatment (n = 6). (L) Western blot analysis of GPX4 protein after CDCA treatment was shown. (M) The apoptosis analysis of the corresponding statistical histograms of THP1 (n = 3) and Molm-13 (n = 7) after ferroptosis inhibitor ferrostatin-1 treatment at concentrations of 0, 0.12, 0.17 mmol/L CDCA for 24h were shown. P-values were determined using student's t-test and Wilcoxon rank test. Error bars represent mean ± SEM. ns: Not significant; *p < 0.05; **p < 0.01; ***p < 0.001, ****p < 0.0001. . (For interpretation of the references to colour in this figure legend, the reader is referred to the Web version of this article.)
Fig. 7
Fig. 7
CDCA inhibits AML progression by alleviating M2 macrophage polarization (A) The mRNA expression results of CD206, CD163 and ARG-1 in M2 macrophages (n = 3) derived from BMDMs with or without CDCA (0.12 mmol/L) pretreatment were shown. (B) The mRNA expression results of CD206, CD163 and ARG-1 in M2 macrophages derived from murine peritoneal derived macrophages with or without CDCA (0.12 mmol/L) pretreatment were shown (n = 3). (C) The percentage of M2 macrophages with or without CDCA (0.12 mmol/L) pretreatment detected by flow cytometry were shown. (D) M2 macrophages were induced with or without CDCA(0.12 mmol/L) pretreatment. After that, C1498 cells were co-cultured with M2 macrophages. CCK8 assays were shown (n = 7). P-values were determined using student's t-test and Wilcoxon rank test. Error bars represent mean ± SEM. ns: Not significant; *p < 0.05; **p < 0.01; ***p < 0.001, ****p < 0.0001.
Fig. 8
Fig. 8
Chenodeoxycholic acid suppresses AML progression through promoting lipid peroxidation via ROS/p38 MAPK/DGAT1 pathway and inhibiting M2 macrophage polarization Chenodeoxycholic acid (CDCA) is decreased in feces and plasma of AML and is correlated with gut microbiota. In mechanism, CDCA promotes LDs accumulation via ROS/p38 MAPK/DGAT1 pathway caused by mitochondrial dysfunction in leukemia cells, and the enrichment of excessive ROS and LDs promotes lipid peroxidation. Moreover, CDCA inhibits M2 macrophage polarization, which alleviates the AML-promoting effects of M2 macrophage.
figs1
figs1

References

    1. CDCP1 drives triple-negative breast cancer metastasis through reduction of lipid-droplet abundance and stimulation of fatty acid oxidation. www.pnas.org/cgi/doi/10.1073/pnas.1703791114 - DOI - PMC - PubMed
    1. Short N.J., Konopleva M., Kadia T.M., Borthakur G., Ravandi F., DiNardo C.D., et al. Advances in the treatment of acute myeloid leukemia: new drugs and new challenges. Cancer Discov. 2020;10(4):506–525. - PubMed
    1. Chiang J.Y. Bile acid metabolism and signaling. Compr. Physiol. 2013;3(3):1191–1212. - PMC - PubMed
    1. Sayin S.I., Wahlstrom A., Felin J., Jantti S., Marschall H.U., Bamberg K., et al. Gut microbiota regulates bile acid metabolism by reducing the levels of tauro-beta-muricholic acid, a naturally occurring FXR antagonist. Cell Metabol. 2013;17(2):225–235. - PubMed
    1. Cai J., Sun L., Gonzalez F.J. Gut microbiota-derived bile acids in intestinal immunity, inflammation, and tumorigenesis. Cell Host Microbe. 2022;30(3):289–300. - PMC - PubMed

Publication types

MeSH terms

LinkOut - more resources