. 2022 Dec 22;140(25):2740-2753.
doi: 10.1182/blood.2022016581.

Trafficking between clonally related peripheral T-helper cells and tissue-resident T-helper cells in chronic GVHD

Affiliations

Trafficking between clonally related peripheral T-helper cells and tissue-resident T-helper cells in chronic GVHD

Xiaohui Kong et al. Blood. .

Abstract

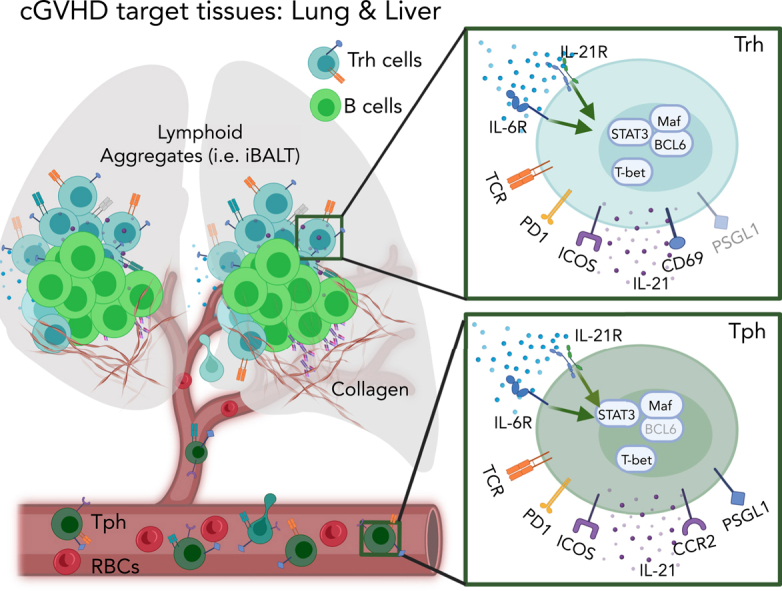
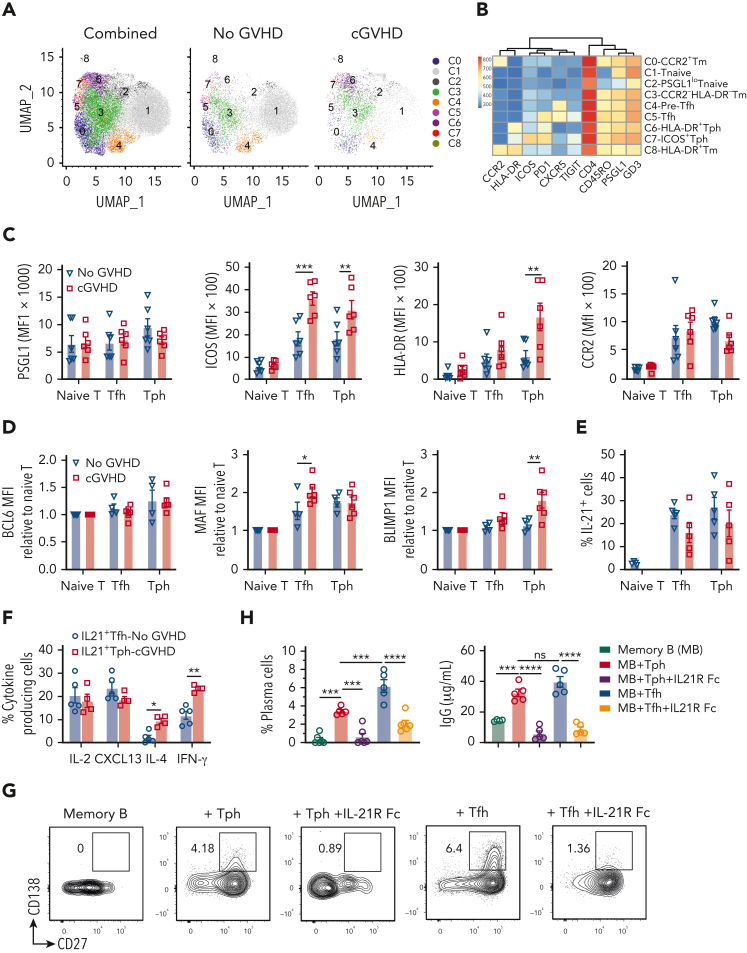
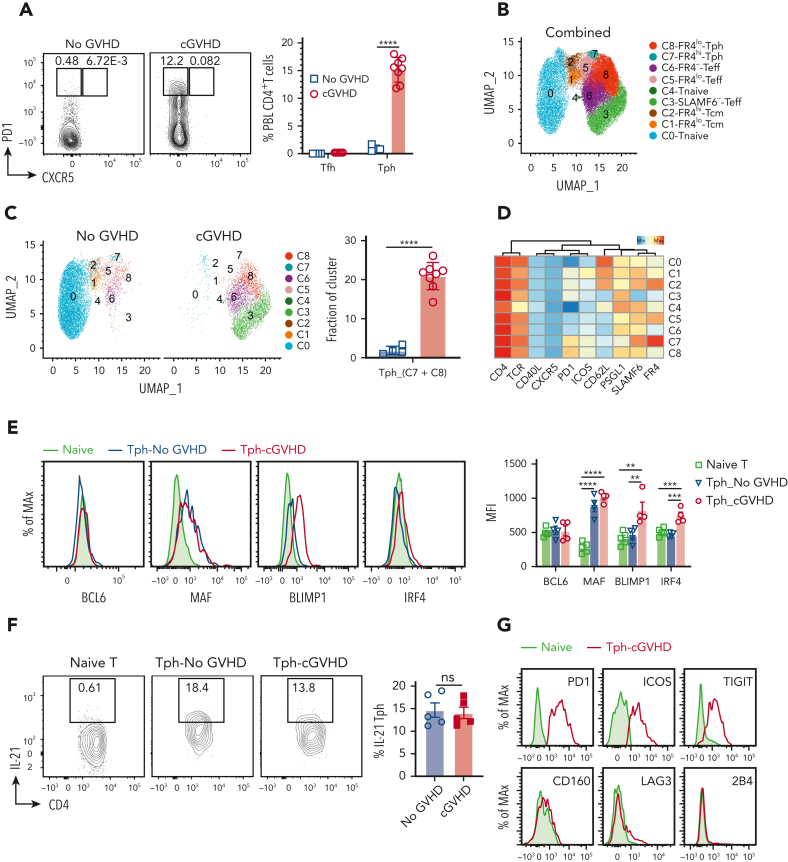
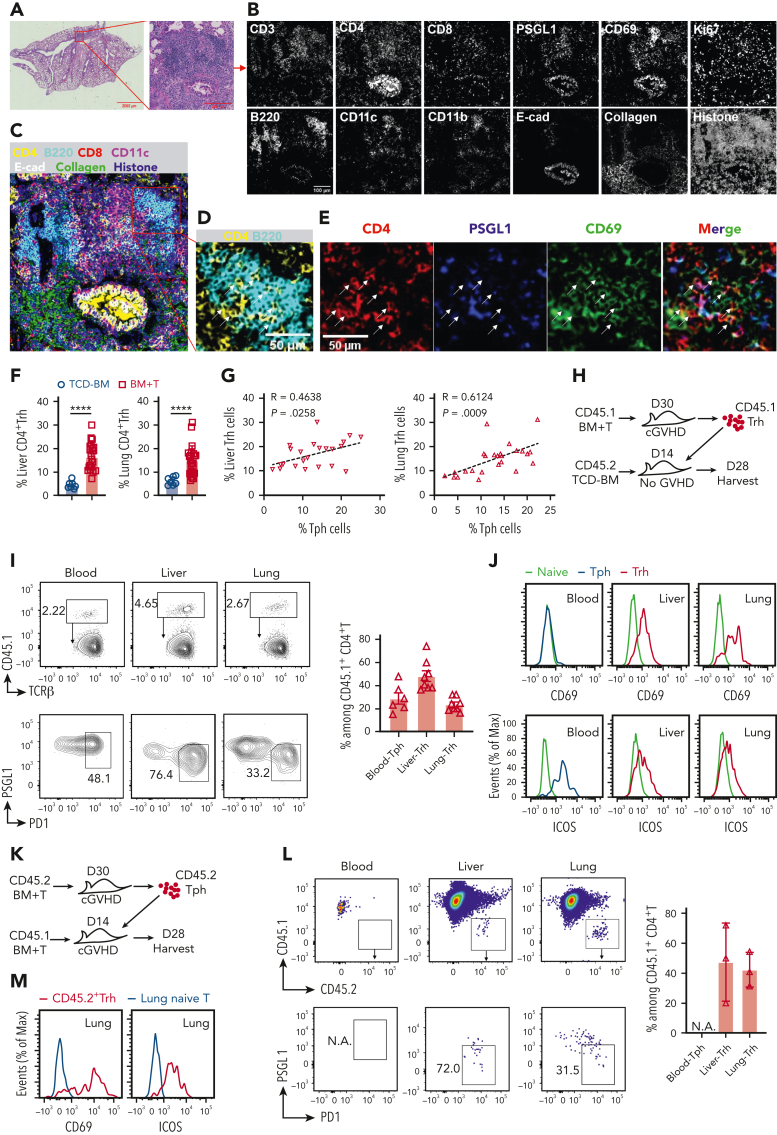
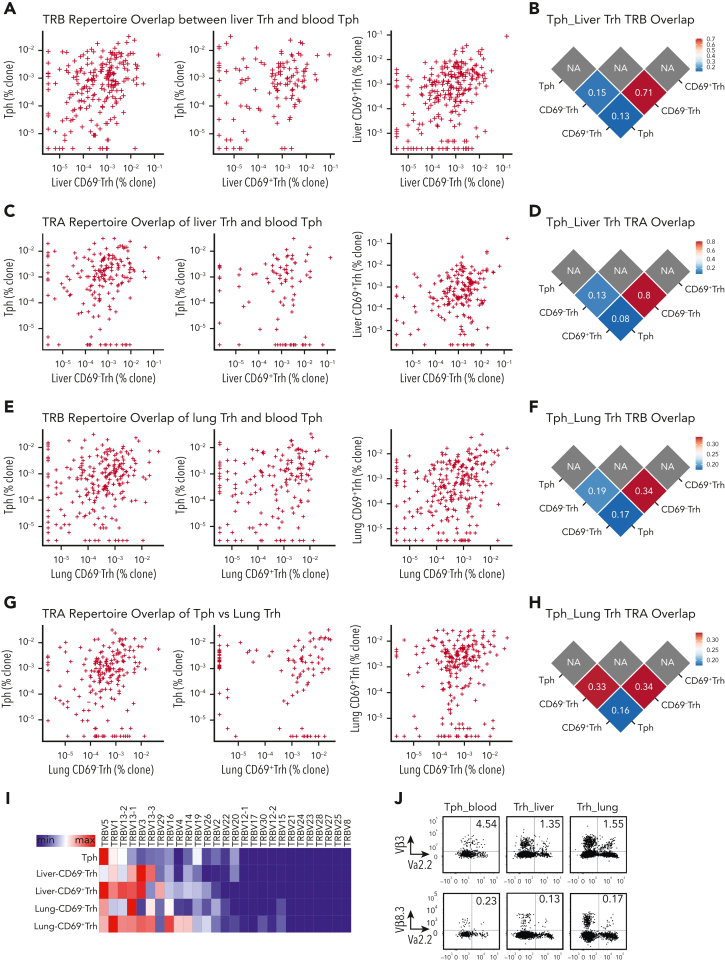
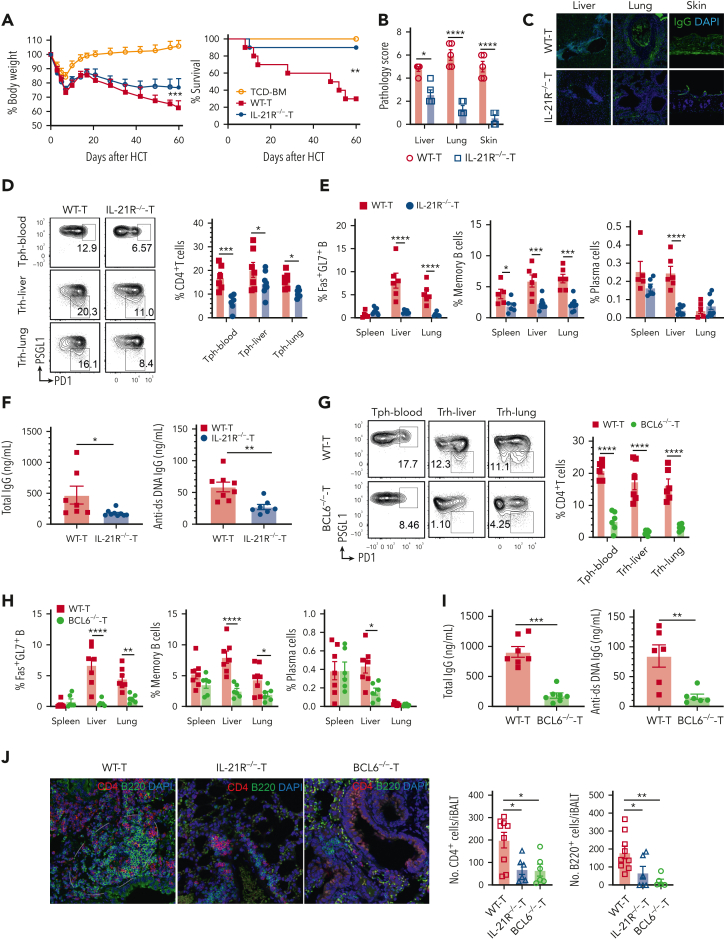
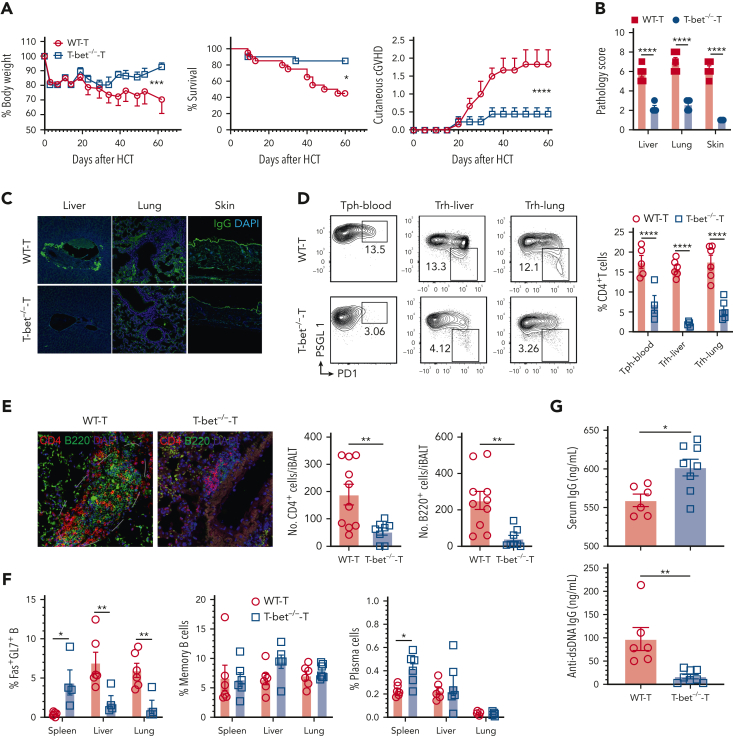
Chronic graft-versus-host disease (cGVHD) is an autoimmune-like syndrome. CXCR5-PD-1hi peripheral T-helper (Tph) cells have an important pathogenic role in autoimmune diseases, but the role of Tph cells in cGVHD remains unknown. We show that in patients with cGVHD, expansion of Tph cells among blood CD4+ T cells was associated with cGVHD severity. These cells augmented memory B-cell differentiation and production of immunoglobulin G via interleukin 21 (IL-21). Tph cell expansion was also observed in a murine model of cGVHD. This Tph cell expansion in the blood is associated with the expansion of pathogenic tissue-resident T-helper (Trh) cells that form lymphoid aggregates surrounded by collagen in graft-versus-host disease (GVHD) target tissues. Adoptive transfer experiments showed that Trh cells from GVHD target tissues give rise to Tph cells in the blood, and conversely, Tph cells from the blood give rise to Trh cells in GVHD target tissues. Tph cells in the blood and Trh cells in GVHD target tissues had highly overlapping T-cell receptor α and β repertoires. Deficiency of IL-21R, B-cell lymphoma 6 (BCL6), or T-bet in donor T cells markedly reduced the proportions of Tph cells in the blood and Trh cells in GVHD target tissues and reduced T-B interaction in the lymphoid aggregates. These results indicate that clonally related pathogenic Tph cells and Trh cells traffic between the blood and cGVHD target tissues, and that IL-21R-BCL6 signaling and T-bet are required for the development and expansion of Tph and Trh cells in the pathogenesis of cGVHD.


Conflict of interest statement

Conflict-of-interest disclosure: The authors declare no competing financial interests.

Figures

None
Graphical abstract
Figure 1.
Figure 1.
Expansion of Tph cells is associated with cGVHD severity. Frozen peripheral blood mononuclear cells from patients detailed in supplemental Tables 1 and 2 were thawed and stained with multiple monoclonal antibodies. (A) PD1 versus CXCR5 expression among CD3+ CD45RO+/ CD45RA- CD4+ memory T cells from HDs (N = 11) and patients with no GVHD (N = 7), mild cGVHD(N = 7), moderate cGVHD (N = 8), or severe cGVHD (N = 8) was examined by flow cytometry. (B) Percentage and yield of PD1-CXCR5+ pre-Tfh cells, PD1+CXCR5+ Tfh cells, and PD1hiCXCR5- Tph cells were calculated. (C) Correlation between percentage of Tph cells and percentage of Tfh cells, between percentage of Tph cells and percentage of pre-Tfh cells, and between yield of Tph cells and yield of pre-Tfh cells in patients with cGVHD (N = 23). Data represent mean ± standard error of the mean (SEM). P values were calculated by 1-way analysis of variance (ANOVA) with Holm-Sidak test (B) and nonparametric Spearman correlation (C). ∗P < .05; ∗∗P < .01; ∗∗∗P < .001; ∗∗∗∗P < .0001.
Figure 2.
Figure 2.
B-cell helper–related markers and functional analysis of Tph cells in the blood of patients with cGVHD. Thawed mononuclear cell samples from patients with cGVHD were stained with multiple antibodies. (A) Cluster identification was visualized with UMAP, and (B) heatmap was generated with FlowSOM to analyze pooled data from 4 samples, 2 with no GVHD and 2 with active cGVHD. (C) Surface expression of PSGL1, ICOS, HLA-DR, and CCR2 were measured and calculated (N = 6). (D) Intracellular BCL6, MAF, and BLIMP1 were measured among naïve T cells, Tfh cells, and Tph cells between patients with no GVHD (N = 4) and patients with cGVHD (N = 6). (E) IL-21 production by Tfh and Tph cells from patients with no GVHD and patients with cGVHD was also tested (N = 5). (F) IL-2, CXCL13, IL-4, and interferon-γ expression among IL-21–producing Tfh and Tph cells were examined. (G) Sorted CD3+ CD4+ CD45RA- PD1hiCXCR5- Tph and PD1hiCXCR5+ Tfh cells were cultured with memory B cells in vitro in the presence of lipopolysaccharide and staphylococcal enterotoxin B with or without IL-21R Fc for 7 days. CD27+CD138+ plasma cells were measured by flow cytometry, and (H) plasma cell percentages were calculated. Supernatant IgG levels were measured by enzyme-linked immunosorbent assay (ELISA). Data represent mean ± SEM. P values were calculated by 2-way ANOVA with Holm-Sidak test (C, D, F) and 1-way ANOVA with Holm-Sidak test (H). ∗P < .05; ∗∗P < .01; ∗∗∗P < .001; ∗∗∗∗P < .0001.
Figure 3.
Figure 3.
An experimental murine model of cGVHD shows expansion of Tph cells in the blood. Irradiated BALB/c recipients were engrafted with TCD-BM alone (no GVHD) or plus splenic Thy1.2+ T cells (2 × 105) to induce cGVHD, and approximately 40% of cGVHD recipients survived at 60 days after HCT. (A) PD1 versus CXCR5 expression among CD4+T cells at day 60 after HCT in the PBL from recipients with no GVHD or with cGVHD. (B, C) Cluster identification was visualized using UMAP to analyze peripheral blood CD4+T cells among 4 recipients with no GVHD and 8 recipients with cGVHD. Fractions of Tph cells were also calculated. (D) Heatmap shows protein expression levels among the clusters in (B). (E) Intracellular expression levels of BCL6, MAF, BLIMP1, and IRF4 were examined among Tph cells from recipients with no GVHD or cGVHD and naïve CD4+ T cells from no-GVHD recipients. MFI was also calculated. (F) PBMCs were stimulated with PMA and ionomycin, and subsequent IL-21 expression levels were measured. (G) Exhaustion-related markers PD1, ICOS, TIGIT, CD160, LAG3, and 2B4 were also compared. Data represent mean ± SEM. P values were calculated by 2-way ANOVA with Holm-Sidak test (A, E) and unpaired Student t test (C, F). ∗P < .05; ∗∗P < .01; ∗∗∗P < .001; ∗∗∗∗P < .0001.
Figure 4.
Figure 4.
Pathogenic Tph cells and Trh cells traffic between the blood and cGVHD target tissues. Lung FFPE slides from cGVHD mice were processed to visualize lymphocyte infiltration via imaging mass cytometry (N = 4). (A) Selected lung lymphocyte infiltration area via hematoxylin-eosin stains. (B) Representative images of 12 markers are shown. (C) Merged channels image shows signals of CD4, B220, CD8, CD11c, E-cadherin, collagen, and histone. (D) Merged channels image shows signals of CD4 and B220 within lung inducible bronchus-associated lymphoid tissue (iBALT). (E) Images show signals of CD4, PSGL1, CD69, and merged channels in lung iBALT. (F) Percentage of liver (N = 23) and lung (N = 25) PSGL1loPD1hi Trh cells among total CD4+ T cells in cGVHD mice and compared with Trh cells (N = 7) from no-GVHD mice by flow cytometry on day 60 after HCT. (G) Correlations between percentage of liver Trh cells and Tph cells, and between percentage of lung Trh cells and Tph cells were analyzed. (H) Diagram of transfer experiments in which donor CD45.1+ Trh cells in the liver and lung of primary cGVHD mice were isolated on day 30 after HCT and transferred into CD45.2+ adoptive recipients of no-GVHD mice on day 14 after HCT. Fourteen days after cell transfer, CD45.1+ T cells were isolated from the adoptive recipients and analyzed (N = 8). (I) Percentages of Tph cells from blood and Trh cells from liver and lung were measured among injected CD45.1+ T cells, mean ± SEM. (J) Representative panel of CD69 and ICOS expression of CD45.1+ Tph cells in the blood and CD45.1+ Trh cells in the liver and lung compared with tissue-matched naïve CD4+ T cells. (K) Diagram of transfer experiments in which donor CD45.2+ blood Tph cells of primary cGVHD mice were enriched at day 30 after HCT and adoptively transferred into CD45.1+ cGVHD recipients at 14 days after HCT. CD45.2+ T cells were monitored 14 days later (N = 3). (L) CD45.2+ T cells in the blood, liver, and lung were identified and tested for PSGL1 versus PD1 expression as shown for 1 representative recipient (left) and calculated (right), mean ± standard deviation. (M) Representative panel of CD69 and ICOS expression of lung CD45.2+Trh cells compared with naïve T cells. P values were calculated by unpaired Student t test (F) and nonparametric Spearman correlation (G). ∗P < .05; ∗∗P < .01; ∗∗∗P < .001; ∗∗∗∗P < .0001.
Figure 5.
Figure 5.
Tph cells share large portions of repertoires with Trh cells. Tph cells in the blood and CD69+ or CD69- Trh subsets in the liver and lung of cGVHD recipients 30 days after HCT were isolated for TCR-Seq analysis to compare the similarity of TCR repertoires. Because of lymphopenia in cGVHD mice, peripheral blood mononuclear cells from 15 mice were pooled for a single sorting experiment and liver or lung mononuclear cells were pooled from 5 mice. (A, C) Scatterplot comparison of TRB and TRA repertoire fractions between Tph cells and liver CD69+ or CD69- Trh cells. (B, D) TCR repertoire similarity of TRB and TRA in A and C was compared by Morisita’s overlap index. (E, G) Scatterplot comparison of TRB and TRA repertoire fractions between Tph cells and lung CD69+ or CD69- Trh cells. (F, H) TCR repertoire similarity of TRB and TRA in E and G was compared by Morisita’s overlap index. (I) Heatmap of gene use of TRB-V segments among Tph from blood, CD69-, and CD69+ Trh subsets from the liver and lung. (J) Two representative TCR clonotypes TCR-Vα2.2-Vβ3 and TCR-Vα2.2-Vβ8.3 were measured by flow cytometry among Tph cells from blood, Trh cells from the liver, and lung of cGVHD recipients.
Figure 6.
Figure 6.
Absence of IL-21R or BCL6 in donor T cells reduces expansion of Tph and Trh cells and ameliorates cGVHD. WT or IL-21R-/- C57BL/6 donor T cells (0.2 × 106) were engrafted with or without WT C57BL/6 TCD-BM cells (2.5 × 106) in lethal total body irradiation–conditioned BALB/c recipients. The BALB/c recipients given TCD-BM alone or with WT-T or IL-21R-/--T cells were assessed at day 60 after HCT. (A) Curves of percent body weight and percent survival are shown. (B) GVHD pathology scores. (C) Representative staining of IgG deposition in the liver, lung, and skin. Original magnification ×200. (D) Tph cells among CD4+ T cells from blood and Trh cells among CD4+ T cells from liver and lung were measured and calculated. (E) Percentages of Fas+GL7+ B cells among total B cells, memory B cells among IgD- B cells, and plasma cells from the spleen and liver were measured. (F) Serum concentrations of total IgG and anti-dsDNA IgG were measured with ELISA. (G) Tph cells among CD4+ T cells from blood and Trh cells among CD4+ T cells from the liver and lung of BALB/c recipients after HCT with TCD-BM plus WT-T or BCL6-/- T cells. (H) Percentages of Fas+GL7+ B cells among total B cells, memory B cells among IgD- B cells, and plasma cells from the spleen and liver were measured. (I) Serum concentrations of total IgG and anti-dsDNA IgG were measured with ELISA. (J) Representative confocal images show CD4+ and B220+ cells in the lung iBALT among WT, IL-21R-/-, and BCL6-/- cGVHD mice. Counts of CD4+ and B220+ cells per iBALT are also shown. Original magnification ×200. Results (mean ± SEM) are combined from 2 replicate experiments. N = 7 to 10. P values were calculated by nonlinear regression with comparison of fits and log-rank test for survival compared with TCD-BM (A), 2-way ANOVA with Holm-Sadik test (B, D, E, G, H), unpaired Student t test (F, I), and 1-way ANOVA with Holm-Sadik test (J). ∗P < .05; ∗∗P < .01; ∗∗∗P < .001; ∗∗∗∗P < .0001.
Figure 7.
Figure 7.
Absence of T-bet in donor T cells reduces expansion of Tph and Trh cells and ameliorates cGVHD. (A) Irradiated BALB/c recipients were engrafted with T cells from WT or T-bet-/- C57BL/6 donors together with TCD-BM from WT C57BL/6 donors. The recipients were monitored for body weight changes and survival for up to 60 days after HCT. Curves of percent body weight, percent survival, and cutaneous cGVHD score are shown. (B) GVHD pathology score. (C) One representative pattern of IgG deposition in the liver, lung, and skin is shown for 4 replicate experiments. Original magnification ×200. (D) Percentages of Tph cells among CD4+ T cells from the blood and Trh cells among CD4+ T cells from the liver and lung of recipients given WT or T-bet-/- donor T cells were examined by flow cytometry. (E) Representative confocal images show CD4+ and B220+ cells inside the lung iBALT of WT and T-bet-/- cGVHD mice. Original magnification ×200. Counts of CD4+ and B220+ cells per iBALT are also shown. (F) Percentages of Fas+GL7+ B among total B cells, memory B cells among IgD- B cells, and plasma cells were measured. (G) Concentration of serum total IgG and anti-dsDNA IgG was measured with ELISA. Mean ± SEM is combined from 2 replicate experiments, N = 10. P values were calculated by nonlinear regression with comparison of fits and log-rank test (A), 2-way ANOVA with Holm-Sadik test (B, D, F), and unpaired Student t test (E, G). ∗P < .05; ∗∗P < .01; ∗∗∗P < .001; ∗∗∗∗P < .0001.

Comment in

  • Chronic GVHD on the move.
    Müller AMS. Müller AMS. Blood. 2022 Dec 22;140(25):2660-2661. doi: 10.1182/blood.2022018321. Blood. 2022. PMID: 36548018 Free PMC article. No abstract available.

References

    1. Zeiser R, Blazar BR. Pathophysiology of chronic graft-versus-host disease and therapeutic targets. N Engl J Med. 2017;377(26):2565–2579. - PubMed
    1. Ferrara JL, Levine JE, Reddy P, Holler E. Graft-versus-host disease. Lancet. 2009;373(9674):1550–1561. - PMC - PubMed
    1. Hill GR, Betts BC, Tkachev V, Kean LS, Blazar BR. Current concepts and advances in graft-versus-host disease immunology. Annu Rev Immunol. 2021;39:19–49. - PMC - PubMed
    1. Socie G, Kean LS, Zeiser R, Blazar BR. Insights from integrating clinical and preclinical studies advance understanding of graft-versus-host disease. J Clin Invest. 2021;131(12):e149296. - PMC - PubMed
    1. Jiang H, Fu D, Bidgoli A, Paczesny S. T cell subsets in graft versus host disease and graft versus tumor. Front Immunol. 2021;12:761448. - PMC - PubMed

Publication types