. 2022 Oct 6;109(10):1828-1849.
doi: 10.1016/j.ajhg.2022.08.009. Epub 2022 Sep 8.

Mutations in SCNM1 cause orofaciodigital syndrome due to minor intron splicing defects affecting primary cilia

Affiliations

Mutations in SCNM1 cause orofaciodigital syndrome due to minor intron splicing defects affecting primary cilia

Asier Iturrate et al. Am J Hum Genet. .

Abstract

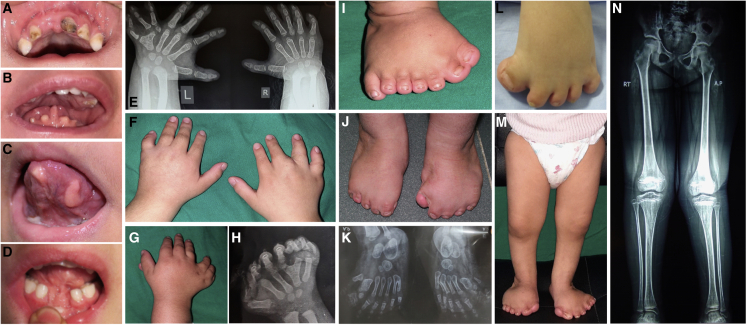
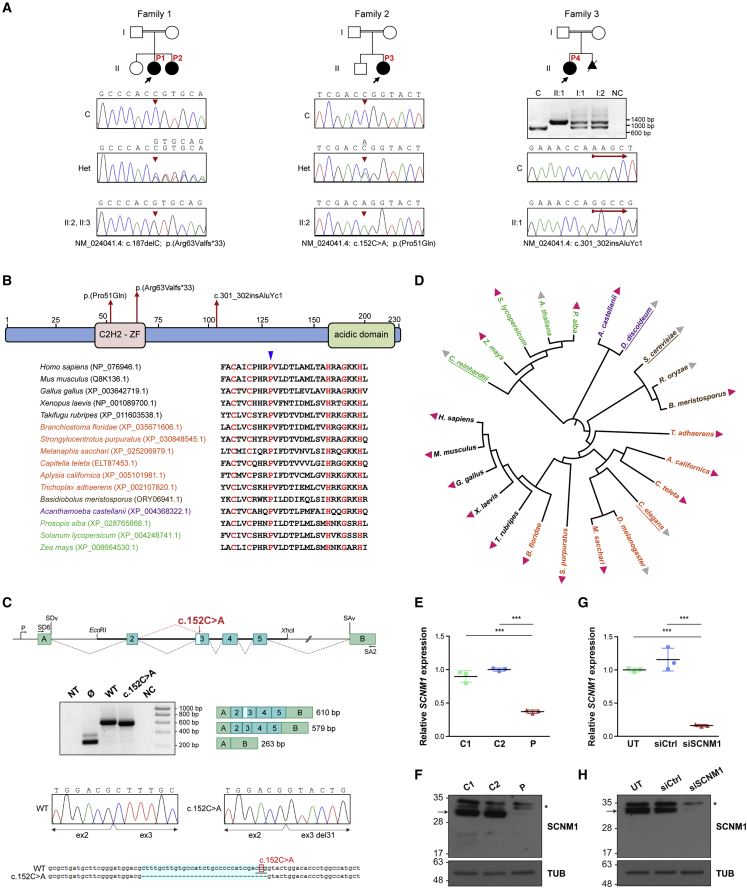
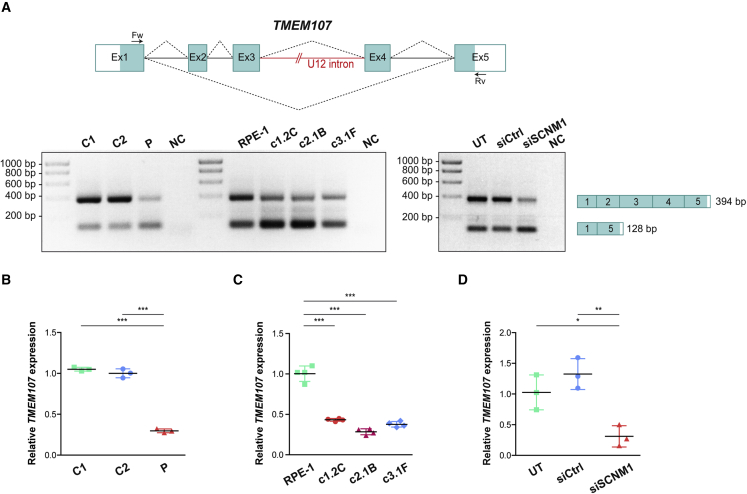
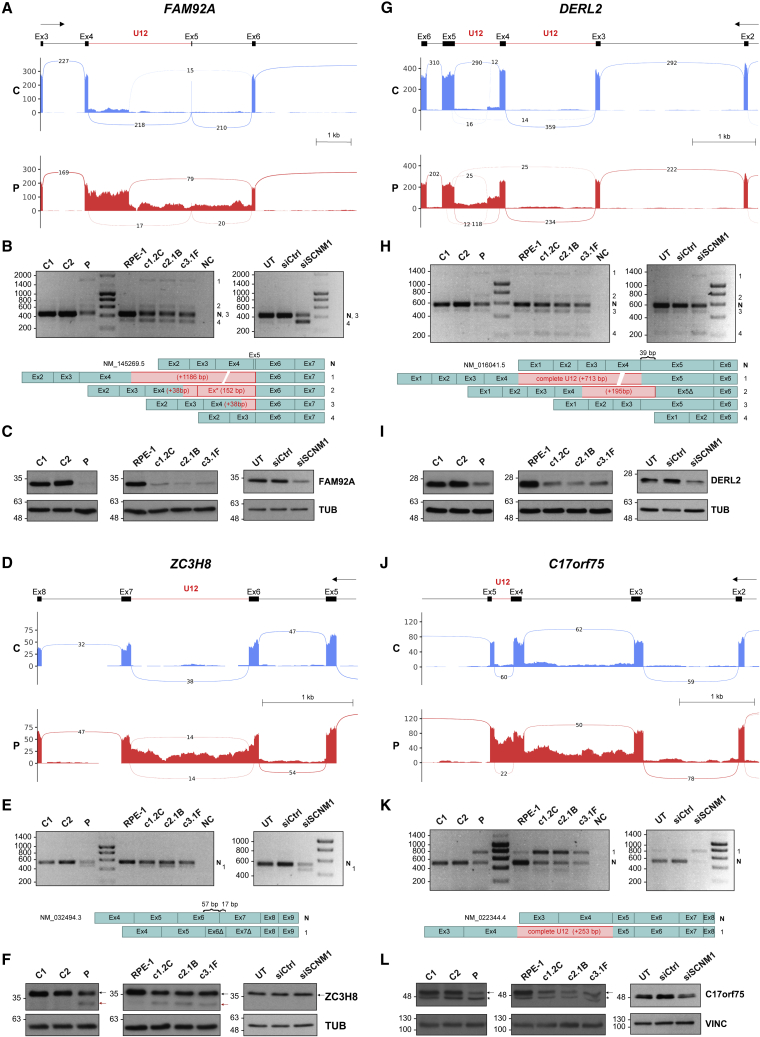
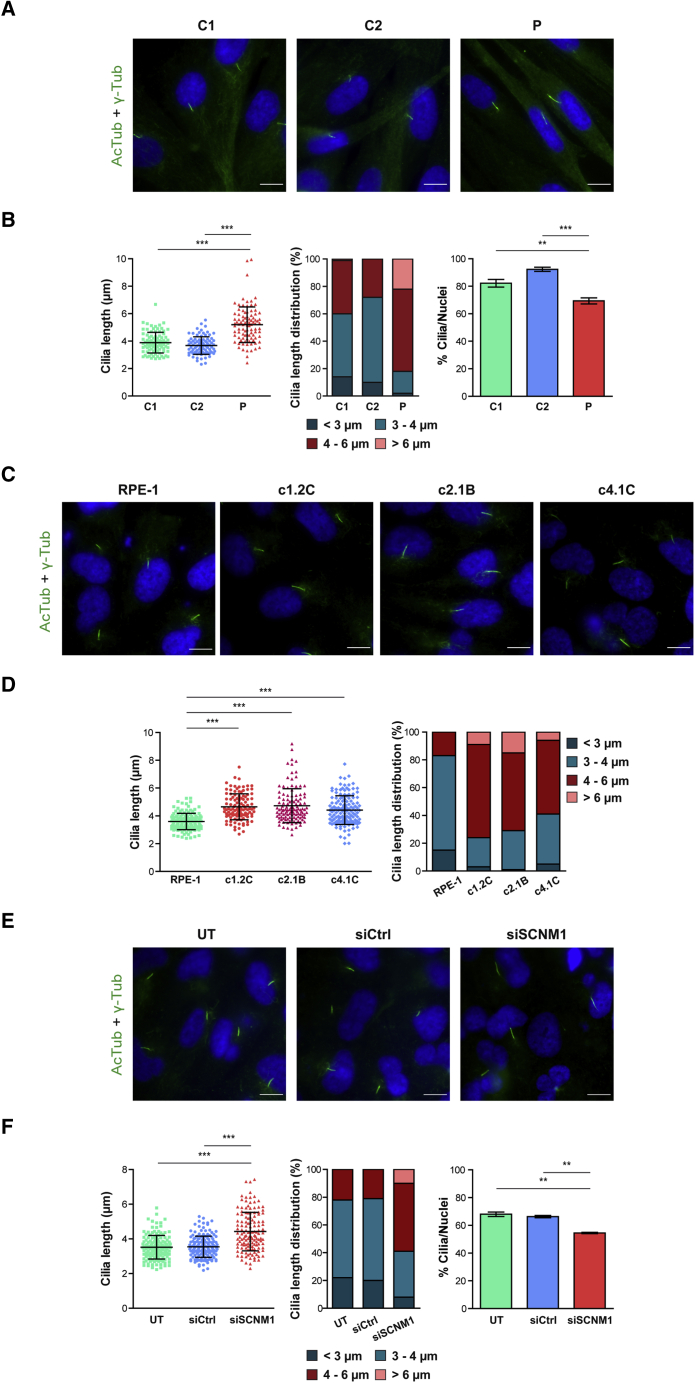
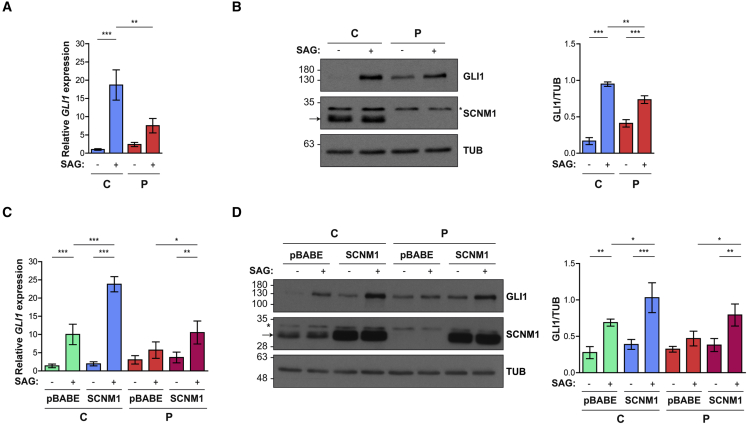
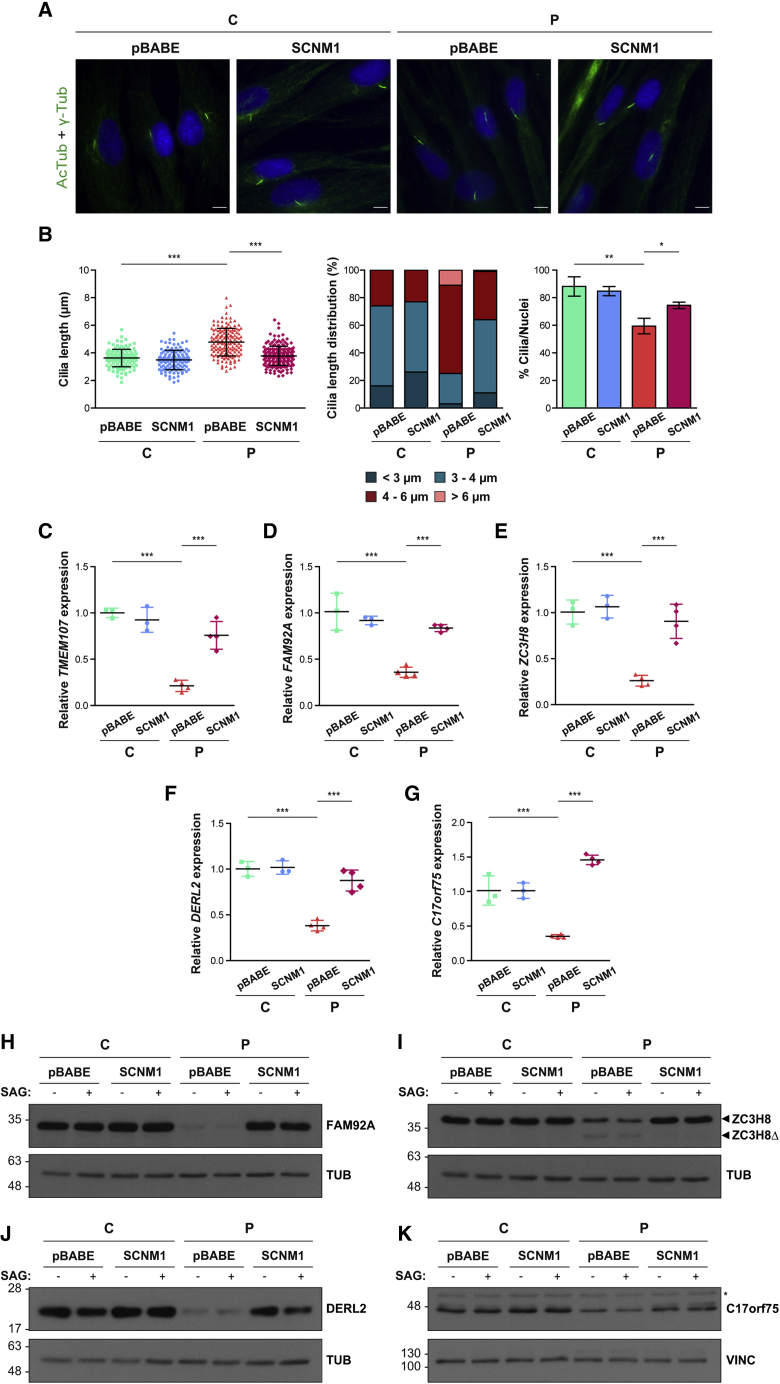
Orofaciodigital syndrome (OFD) is a genetically heterogeneous ciliopathy characterized by anomalies of the oral cavity, face, and digits. We describe individuals with OFD from three unrelated families having bi-allelic loss-of-function variants in SCNM1 as the cause of their condition. SCNM1 encodes a protein recently shown to be a component of the human minor spliceosome. However, so far the effect of loss of SCNM1 function on human cells had not been assessed. Using a comparative transcriptome analysis between fibroblasts derived from an OFD-affected individual harboring SCNM1 mutations and control fibroblasts, we identified a set of genes with defective minor intron (U12) processing in the fibroblasts of the affected subject. These results were reproduced in SCNM1 knockout hTERT RPE-1 (RPE-1) cells engineered by CRISPR-Cas9-mediated editing and in SCNM1 siRNA-treated RPE-1 cultures. Notably, expression of TMEM107 and FAM92A encoding primary cilia and basal body proteins, respectively, and that of DERL2, ZC3H8, and C17orf75, were severely reduced in SCNM1-deficient cells. Primary fibroblasts containing SCNM1 mutations, as well as SCNM1 knockout and SCNM1 knockdown RPE-1 cells, were also found with abnormally elongated cilia. Conversely, cilia length and expression of SCNM1-regulated genes were restored in SCNM1-deficient fibroblasts following reintroduction of SCNM1 via retroviral delivery. Additionally, functional analysis in SCNM1-retrotransduced fibroblasts showed that SCNM1 is a positive mediator of Hedgehog (Hh) signaling. Our findings demonstrate that defective U12 intron splicing can lead to a typical ciliopathy such as OFD and reveal that primary cilia length and Hh signaling are regulated by the minor spliceosome through SCNM1 activity.

Keywords: SCNM1; U12 introns; ciliopathy; hedgehog signaling; minor spliceosome; orofaciodigital syndrome; primary cilia.


Conflict of interest statement

Declaration of interests The authors declare no competing interests.

Figures

Figure 1
Figure 1
Clinical features of the OFD-affected individuals described in this study (A) Orodental characteristics of P1 with accessory frenula of the upper lip, hypodontia, median notching of the lower lip, and excessive dental caries. (B and C) Images showing lobulated tongue with nodules in P2 (B) and P3 (C). (D) Hypodontia in the form of congenital absence of lower central incisors and median notching of the upper lip in P4. (E) X-ray of the hands of P1 showing bilateral postaxial polydactyly (left, seven fingers; right, six fingers), left Y-shaped fifth metacarpal and severe mesophalangeal shortening. (F) Brachydactyly, broad hands, and interdigital webbing in P1. Extra digits were surgically removed. (G) Right hand of P2 demonstrating pre- and postaxial polydactyly (eight fingers) with syndactylous lateral three fingers. (H) Left hand radiograph of P2 showing polydactyly and Y-shaped fourth metacarpal. (I) Right foot of P2 showing broad duplicated hallux, syndactyly between toes, and triplicated fifth toe. (J) Brachydactyly, partial skin syndactyly, dystrophic nails, and broad halluces in P3 feet post-surgery. (K) X-ray (AP view) of the feet of P3 showing pre- and postaxial polydactyly, hypoplastic middle and distal phalanges, medially deviated extra preaxial metatarsals, and Y-shaped fifth metatarsal on the right foot. (L) Brachydactyly, partial cutaneous syndactyly of the toes, broad and medially deviated halluces, and small nails of P4. (M) Severe shortening of the legs of P2. (N) X-ray lower limbs of P3 showing bilateral coxa valga with mild shortening of tibiae.
Figure 2
Figure 2
Identification of loss-of-function mutations in SCNM1 in individuals with OFD (A) Family pedigrees of affected individuals P1–P4 described in this report. Probands are designated with black arrows. Genomic DNA sequence chromatograms of SCNM1 illustrating the homozygous mutation (red arrowheads) identified in each family are displayed underneath. The sequence of affected individuals, heterozygous carriers (Het), and a control sample (C) are shown. Nucleotide sequences corresponding to mutant (top) and normal (underneath) alleles are written on Het electropherograms. The agarose gel image below the pedigree of family 3 shows the PCR products resulting from the amplification of a genomic DNA fragment containing SCNM1 exon 4 in P4 (II:1), both of her parents (I:1, I:2), and in a control individual (C). NC, no DNA control. The red arrows in family 3 chromatograms designate the site of the AluYc1 insertion after which control and P4 DNA sequences diverge. (B) Schematic representation of the SCNM1 protein indicating the position of the C2H2 zinc finger (C2H2-ZF) domain and the acidic domain of this protein, and the location of the three mutations indicated in (A). A sequence alignment of the C2H2-ZF domain from different SCNM1 orthologs showing high degree of conservation of Pro51 (blue arrowhead), is also indicated. (C) SCNM1 minigene assay. Top: schematic representation of pSPL3/SCNM1 hybrid minigene. Boxes are exons and dotted lines connecting exons indicate normal (black) or altered (red) splicing events. The two artificial exons (A and B), promoter (P), donor (SDv), and acceptor (SAv) splice sites of pSPL3 are depicted. EcoRI and XhoI restriction sites used to clone the wild-type (WT) and c.152C>A SCNM1 genomic fragments as well as primers SD6 and SA2 used for RT-PCR are shown. Middle: representative gel electrophoresis image (n = 3) showing RT-PCR products obtained in cells transfected with the WT or the c.152C>A minigene or the empty vector (Ø). NT, non-transfected; NC, no cDNA control. Exon composition and sizes (WT [610 bp] and c.152C>A [579 bp]) of the amplified products are on the right. The light blue box in exon 3 of the WT PCR product represents the 31 bp that are missing in the c.152C>A PCR fragment. Sanger sequencing chromatograms of WT and c.152C>A RT-PCR products show the loss of the first 31 bp of SCNM1 exon 3 in the product from the mutant minigene. Bottom: DNA sequence alignment of WT and c.152C>A RT-PCR products highlighting (light blue) the 31 nucleotides missing in the c.152C>A sequence. Note the new CAG acceptor splice site (underlined nucleotides) created by the c.152C>A mutation (boxed nucleotide). (D) Common taxonomy tree of representative eukaryotic species from distantly related phylogenetic taxa. Presence and absence of SCNM1 is indicated with pink and gray triangles, respectively. Species previously reported with no minor introns are underlined. Protists, fungi, algae and plants, and invertebrate and vertebrate animals are indicated in different colors. Full names and taxa of species are listed in material and methods. (E) Relative quantification of SCNM1 expression by RT-qPCR in fibroblasts from controls (C1, C2) and affected individual P2 (P). Gene expression was normalized against the geometric mean of GAPDH and GUSB mRNA levels, and the ΔCt mean value of C2 was used as calibrator sample. Data are expressed as mean ± SD (n = 3). ∗∗∗p < 0.001. One-way ANOVA with Tukey’s multiple comparison test. (F) Representative anti-SCNM1 immunoblot (n = 3) showing absence of SCNM1 in fibroblasts from P2 (P). Control fibroblasts: C1, C2. SCNM1 is indicated with an arrow, and the asterisk designates nonspecific bands. Tubulin (TUB) was used as a loading control. (G) Relative quantification of SCNM1 expression (n = 3) by RT-qPCR in RPE-1 cells untransfected (UT) or transfected with non-targeting siRNA (siCtrl) or with siRNA against SCNM1 (siSCNM1). Gene expression analysis was performed as in (E) using the ΔCt mean value of UT cells as the calibrator sample. Data are expressed as mean ± SD (n = 3). ∗∗∗p < 0.001. One-way ANOVA with Tukey’s multiple comparison test. (H) Representative anti-SCNM1 immunoblotting (n = 4) showing reduced levels of the SCNM1 protein in SCNM1-KD RPE-1 cells (siSCNM1) compared to UT and siCtrl cells. SCNM1 is indicated with an arrow, and the asterisk designates a nonspecific band. Loading control: tubulin (TUB).
Figure 3
Figure 3
SCNM1 depletion reduces the expression of the coding transcript of TMEM107 (A) Schematic representation of TMEM107. Exons are depicted with blue boxes, and dotted lines indicate splicing events. White areas in exons 1 and 5 correspond to untranslated regions. TMEM107 U12 intron is represented as a red line, and RT-PCR primers used are denoted by arrows. Representative images of agarose gels corresponding to RT-PCR analysis of TMEM107 are underneath. Left: TMEM107 RT-PCR products from primary fibroblasts (controls: C1, C2; affected individual P2: P) and SCNM1-KO RPE-1 clones (SCNM1-KO clones: c1.2C, c2.1B, c3.1F; parental control cells: RPE-1) (n = 3). Right: TMEM107 RT-PCR products from RPE-1 cells untransfected (UT) or transfected with non-targeting siRNA (siCtrl) or with siRNA against SCNM1 (siSCNM1) (n = 3). NC, no cDNA control. RT-PCR product sizes and exon composition of the amplified bands are on the right. (B–D) Relative expression of TMEM107 determined by RT-qPCR in primary fibroblasts (B); SCNM1-KO RPE-1 clones (C); and siRNA-treated RPE-1 cells (D). Samples in (B)–(D) are labeled as in (A). Gene expression was normalized against the geometric mean of GAPDH and GUSB mRNA levels. The ΔCt mean value of C2, RPE-1, or UT was used as calibrator sample in (B), (C), and (D), respectively. Scatter plots show mean ± SD (n = 3 for B and D; and n = 4 for C). p < 0.05, ∗∗p < 0.01, ∗∗∗p < 0.001. One-way ANOVA with Tukey’s multiple comparison test.
Figure 4
Figure 4
SCNM1 deficiency causes defects in the splicing of a set of U12 intron-containing genes (A–L) Sashimi plot visualization of aligned RNA-seq reads, RT-PCR, and protein expression analysis of FAM92A (A–C), ZC3H8 (D–F), DERL2 (G–I), and C17orf75 (J–L). For (A), (D), (G), and (J), the diagram on top shows a schematic representation of the genomic region containing the U12 intron of each gene. Boxes indicate exons and lines introns. U12 introns are represented with a red line. The top arrow indicates transcription direction. Sashimi plots corresponding to the genomic region of interest from control (C; in blue) and affected individual P2 (P; in red) fibroblasts are underneath. In each sashimi plot, the mean of the counts from two independent RNA-seq experiments is represented. Splicing events supported by a minimum of ten reads are denoted with lines and the number of reads supporting each event is indicated. Note that in the case of DERL2, which contains two U12 introns, only the one between exons 4 and 5 was detected as significantly retained in fibroblasts from P2 by bioinformatics analysis. (B), (E), (H), and (K) Representative agarose gel images showing exon-exon RT-PCR products of the indicated genes in primary fibroblasts (controls [C1, C2] and affected individual P2 [P]), SCNM1-KO RPE-1 cells (SCNM1-KO clones: c1.2C, c2.1B, c3.1F; parental control cells: RPE-1), and siRNA-treated RPE-1 cells (untransfected [UT], transfected with non-targeting siRNA [siCtrl], or with siRNA against SCNM1 [siSCNM1]) (n = 2). NC, no cDNA control. Normal transcript isoforms are designated with an N and the numbers on the right of each gel denote abnormally spliced products detected in this assay. Schematic representation of the exon composition of RT-PCR products is underneath showing, in each case, partial or complete inclusion of the U12 intron (red) and/or complete or partial exclusion of different canonical exons (blue). Ex in (B) designates inclusion of a cryptic exon contained within the U12 intron of FAM92A. Exons with nucleotide deletions due to activation of internal cryptic splice sites (E and H) are identified with a Δ symbol and the number of deleted nucleotides is indicated with curly brackets in the normal transcript. (C), (F), (I), and (L) Representative immunoblots of FAM92A, ZC3H8, DERL2, and C17orf75 in protein extracts from primary fibroblasts, SCNM1-KO RPE-1 clones, and siRNA-treated RPE-1 cells (n = 3). Samples are labeled as in (B), (E), (H), and (K). In (F), the WT isoform of the ZC3H8 protein and the truncated variant resulting from defective U12 intron splicing are indicated with a black or a red arrow, respectively. In (L), the black arrow designates the band corresponding to the C17orf75 protein and the asterisk an unspecific band. Tubulin (TUB) or vinculin (VINC) were used as loading controls.
Figure 5
Figure 5
Loss of SCNM1 causes defects in primary cilia (A) Representative immunofluorescence images showing cilia with increased length in fibroblasts from affected individual P2 (P) compared to control fibroblasts (C1, C2). Green [acetylated tubulin (AcTub) + gamma tubulin (γ-Tub)]: cilia; blue (DAPI): nuclei. Scale bars: 10 μm. (B) From left to right, graphs correspond to cilia length, distribution of cilia length, and frequency of ciliated cells in fibroblasts from affected individual P2 (P) versus controls (C1, C2). For cilia length, a minimum of 90 cilia were measured per cell line (n = 3 independent experiments) and for cilia number calculation, at least 160 cells were analyzed (n = 3). Data are presented as mean ± SD. ∗∗p < 0.01, ∗∗∗p < 0.001. One-way ANOVA with Tukey’s multiple comparison test. (C) Representative immunofluorescence images showing elongated primary cilia in three independent SCNM1-KO RPE-1 clones (c1.2C, c2.1B, c4.1C) compared to RPE-1 control cells. Green (AcTub + γ-Tub): cilia; blue (DAPI): nuclei. Scale bars: 10 μm. (D) Cilia length and cilia length distribution in SCNM1-KO RPE-1 clones (c1.2C, c2.1B, c4.1C) and RPE-1 control cells. At least 110 cilia from three different experiments were measured per cell line. Data are presented as mean ± SD. ∗∗∗p < 0.001. Kruskal-Wallis test with Dunn’s multiple comparison test. Data from two additional SCNM1-KO clones are in Figure S6. (E) Representative immunofluorescence images showing extended primary cilia in RPE-1 cells transfected with SCNM1 siRNA (siSCNM1) compared to un-transfected (UT) or transfected with non-targeting siRNA (siCtrl) cells. Green (AcTub + γ-Tub): cilia; blue (DAPI): nuclei. Scale bars: 10 μm. (F) Data corresponding to cilia length, distribution of cilia length and frequency of ciliated cells in RPE-1 cells untransfected (UT) or transfected with non-targeting siRNA (siCtrl) or with siRNA against SCNM1 (siSCNM1). For cilia length, a minimum of 130 cilia were measured, and for the calculation of ciliated cells, at least 280 cells were analyzed per condition from two independent experiments. Data are presented as mean ± SD. ∗∗p < 0.01, ∗∗∗p < 0.001. Kruskal-Wallis test with Dunn’s multiple comparison test and one-way ANOVA with Tukey’s multiple comparison test were performed for cilia length and ciliation frequency, respectively.
Figure 6
Figure 6
SCNM1 positively regulates Hh signaling (A) Relative quantification of GLI1 mRNA levels by RT-qPCR in control C2 (C) and affected individual P2 (P) primary fibroblasts treated with SAG (+) or its vehicle DMSO (−). Data are mean ± SD (n = 3). Gene expression was normalized against the geometric mean of GAPDH and GUSB mRNA levels. The ΔCt mean value of C in DMSO was used as calibrator sample. ∗∗p < 0.01, ∗∗∗p < 0.001. One-way ANOVA with Tukey’s multiple comparison test. (B) Representative immunoblot showing GLI1 protein levels in response to SAG (+) or DMSO (−) in control (C) and affected individual (P) fibroblasts. Anti-SCNM1 immunoblotting is also included. Loading control: tubulin (TUB). The graph on the right shows densitometric values of GLI1 levels normalized to tubulin. Data are mean ± SD (n = 3). ∗∗p < 0.01, ∗∗∗p < 0.001. One-way ANOVA with Tukey’s multiple comparison test. (C) Relative quantification of GLI1 mRNA levels by RT-qPCR in control (C) and affected individual (P) primary fibroblasts transduced with SCNM1 or the empty retroviral vector pBABE-puro in response to SAG (+) or its vehicle DMSO (−). Data are mean ± SD (n = 3 [C], n = 4 [P]). Gene expression was normalized against the geometric mean of GAPDH and GUSB mRNA levels. The ΔCt mean value of DMSO-treated control cells transduced with pBABE was used as calibrator sample. p < 0.05, ∗∗p < 0.01, ∗∗∗p < 0.001. One-way ANOVA with Tukey’s multiple comparison test. (D) Representative immunoblot of GLI1 protein levels in response to SAG (+) or DMSO (−) in control (C) and affected individual (P) primary fibroblasts transduced with SCNM1 or the empty vector (pBABE). Anti-SCNM1 immunoblotting is also included. The arrow and the asterisk on anti-SCNM1 blots (B and D) designate SCNM1 and a nonspecific band, respectively. Tubulin (TUB) was used as loading control. The graph on the right shows densitometric values of GLI1 levels normalized to tubulin. Data are mean ± SD (n = 3 [C], n = 4 [P]). p < 0.05, ∗∗p < 0.01, ∗∗∗p < 0.001. One-way ANOVA with Tukey’s multiple comparison test.
Figure 7
Figure 7
Cilia length and U12 intron splicing are restored in cells derived from an affected individual upon reintroduction of SCNM1 (A) Representative immunofluorescence images showing normal cilia length in fibroblasts derived from P2 (P) retrotansduced with SCNM1 but not in P2 fibroblasts transduced with the empty viral vector (pBABE). No significant differences were observed in similarly retrotransduced normal control C2 (C) cells included in the same assay. Green [acetylated tubulin (AcTub) + gamma tubulin (γ-Tub)]: cilia; blue (DAPI): nuclei. Scale bars: 10 μm. (B) Graphs illustrating cilia length, distribution of cilia length, and frequency of ciliated cells in control (C) and affected individual (P) primary fibroblasts retrotransduced with SCNM1 or the empty vector (pBABE). For each cell line, the length of a minimum of 120 cilia was measured (n = 3 [C], n = 4 [P]), and at least 125 cells were analyzed to calculate the ratio of ciliated cells (n = 3 [C], n = 3 [P]). Data are presented as mean ± SD. p < 0.05, ∗∗p < 0.01, ∗∗∗p < 0.001. Kruskal-Wallis test with Dunn’s multiple comparison test and one-way ANOVA with Bonferroni’s post-hoc test for comparison of selected pairs were used for cilia length and ciliation frequency, respectively. (C–G) Relative quantification of TMEM107 (C), FAM92A (D), ZC3H8 (E), DERL2 (F), and C17orf75 (G) mRNA levels by RT-qPCR in control (C) and affected individual (P) cultured primary fibroblasts retrotransduced with SCNM1 or the empty retroviral vector (pBABE). RNA samples used were isolated from DMSO-treated cultures. Scatterplots show mean ± SD (n = 3 [C], n = 4 [P]). Gene expression for TMEM107, FAM92A, ZC3H8, and DERL2 was normalized against the geometric mean of GAPDH and GUSB mRNA levels. For C17orf75, GUSB expression was used for normalization. The ΔCt mean value of control cells (C) retrotransduced with pBABE was used as calibrator sample. ∗∗∗p < 0.001. One-way ANOVA with Tukey’s multiple comparison test. (H–K) Representative immunoblots of FAM92A (H), ZC3H8 (I), DERL2 (J), and C17orf75 (K) showing reestablishment of the normal levels of these proteins in affected individual (P) primary fibroblasts after SCNM1 retroviral delivery. Control fibroblasts are labelled as C. Blots were conducted in cell extracts from DMSO (−)- and SAG (+)-treated cells. (H and I): n = 3 (C), n = 4 (P); (J and K): n = 2 (C and P). In (I), arrowheads mark WT (ZC3H8) and truncated (ZC3H8Δ) ZC3H8 isoforms. In (K), the asterisk designates a non-specific band. Tubulin (TUB) and vinculin (VINC) served as a loading control.

References

    1. El Marabti E., Malek J., Younis I. Minor intron splicing from basic science to disease. Int. J. Mol. Sci. 2021;22:6062. - PMC - PubMed
    1. Verma B., Akinyi M.V., Norppa A.J., Frilander M.J. Minor spliceosome and disease. Semin. Cell Dev. Biol. 2018;79:103–112. - PubMed
    1. Sharp P.A., Burge C.B. Classification of Introns: U2-Type or U12-Type. Cell. 1997;91:875–879. - PubMed
    1. Turunen J.J., Niemela E.H., Verma B., Frilander M.J. Vol. 4. Wiley Interdiscip Rev RNA; 2013. The Significant Other: Splicing by the Minor Spliceosome; pp. 61–76. - PMC - PubMed
    1. Baumgartner M., Drake K., Kanadia R.N. An integrated model of minor intron emergence and conservation. Front. Genet. 2019;10:1113. - PMC - PubMed

Publication types