. 2022 Oct 6;29(10):1445-1458.e8.
doi: 10.1016/j.stem.2022.08.013. Epub 2022 Sep 8.

Mouse embryo model derived exclusively from embryonic stem cells undergoes neurulation and heart development

Affiliations

Mouse embryo model derived exclusively from embryonic stem cells undergoes neurulation and heart development

Kasey Y C Lau et al. Cell Stem Cell. .

Abstract

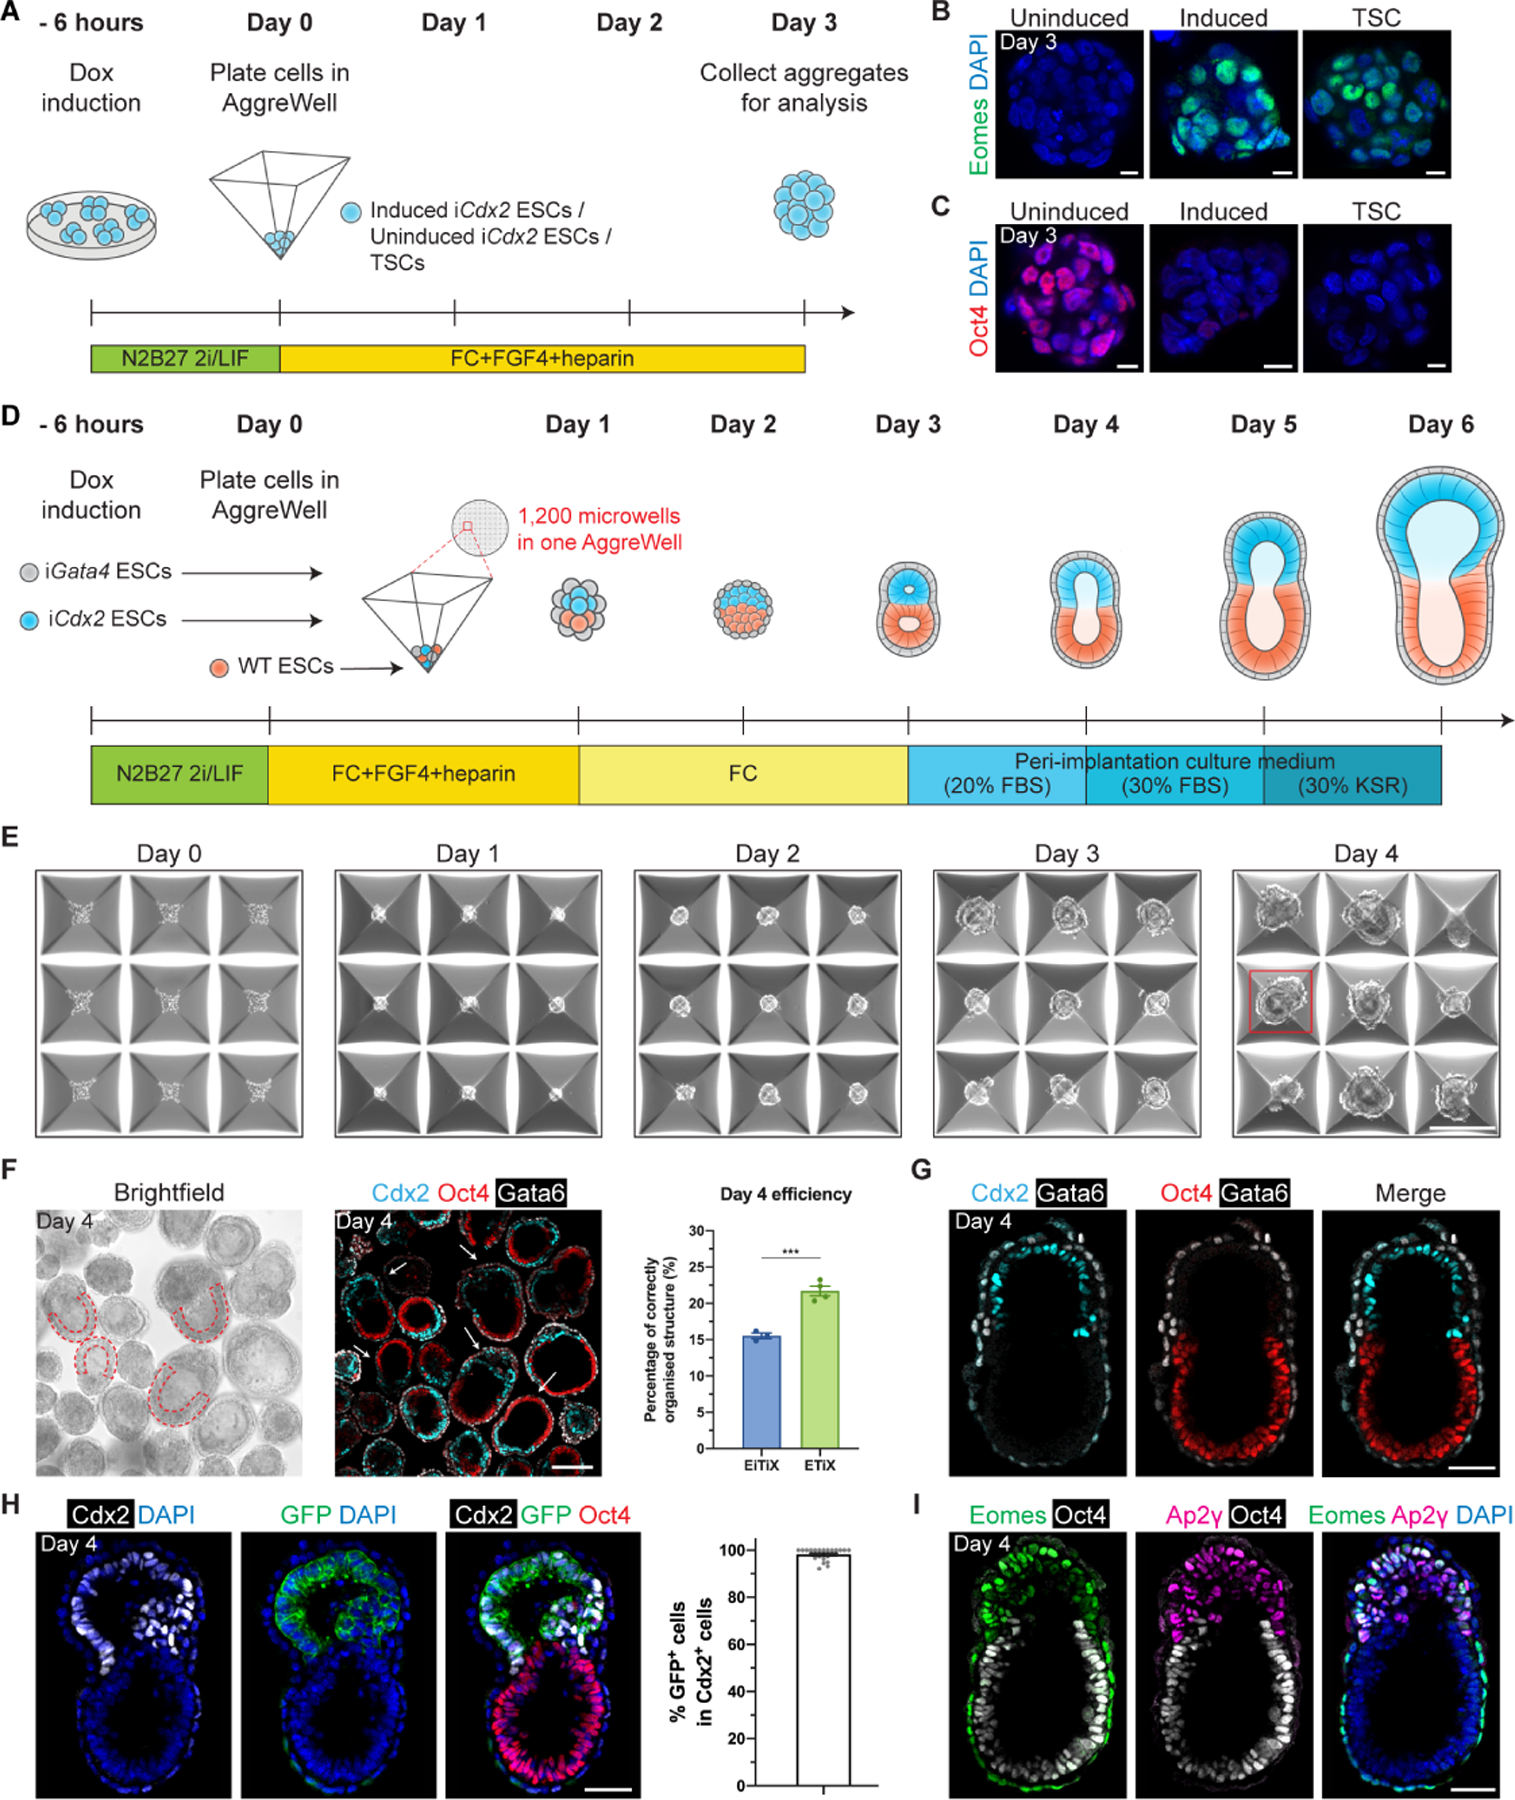
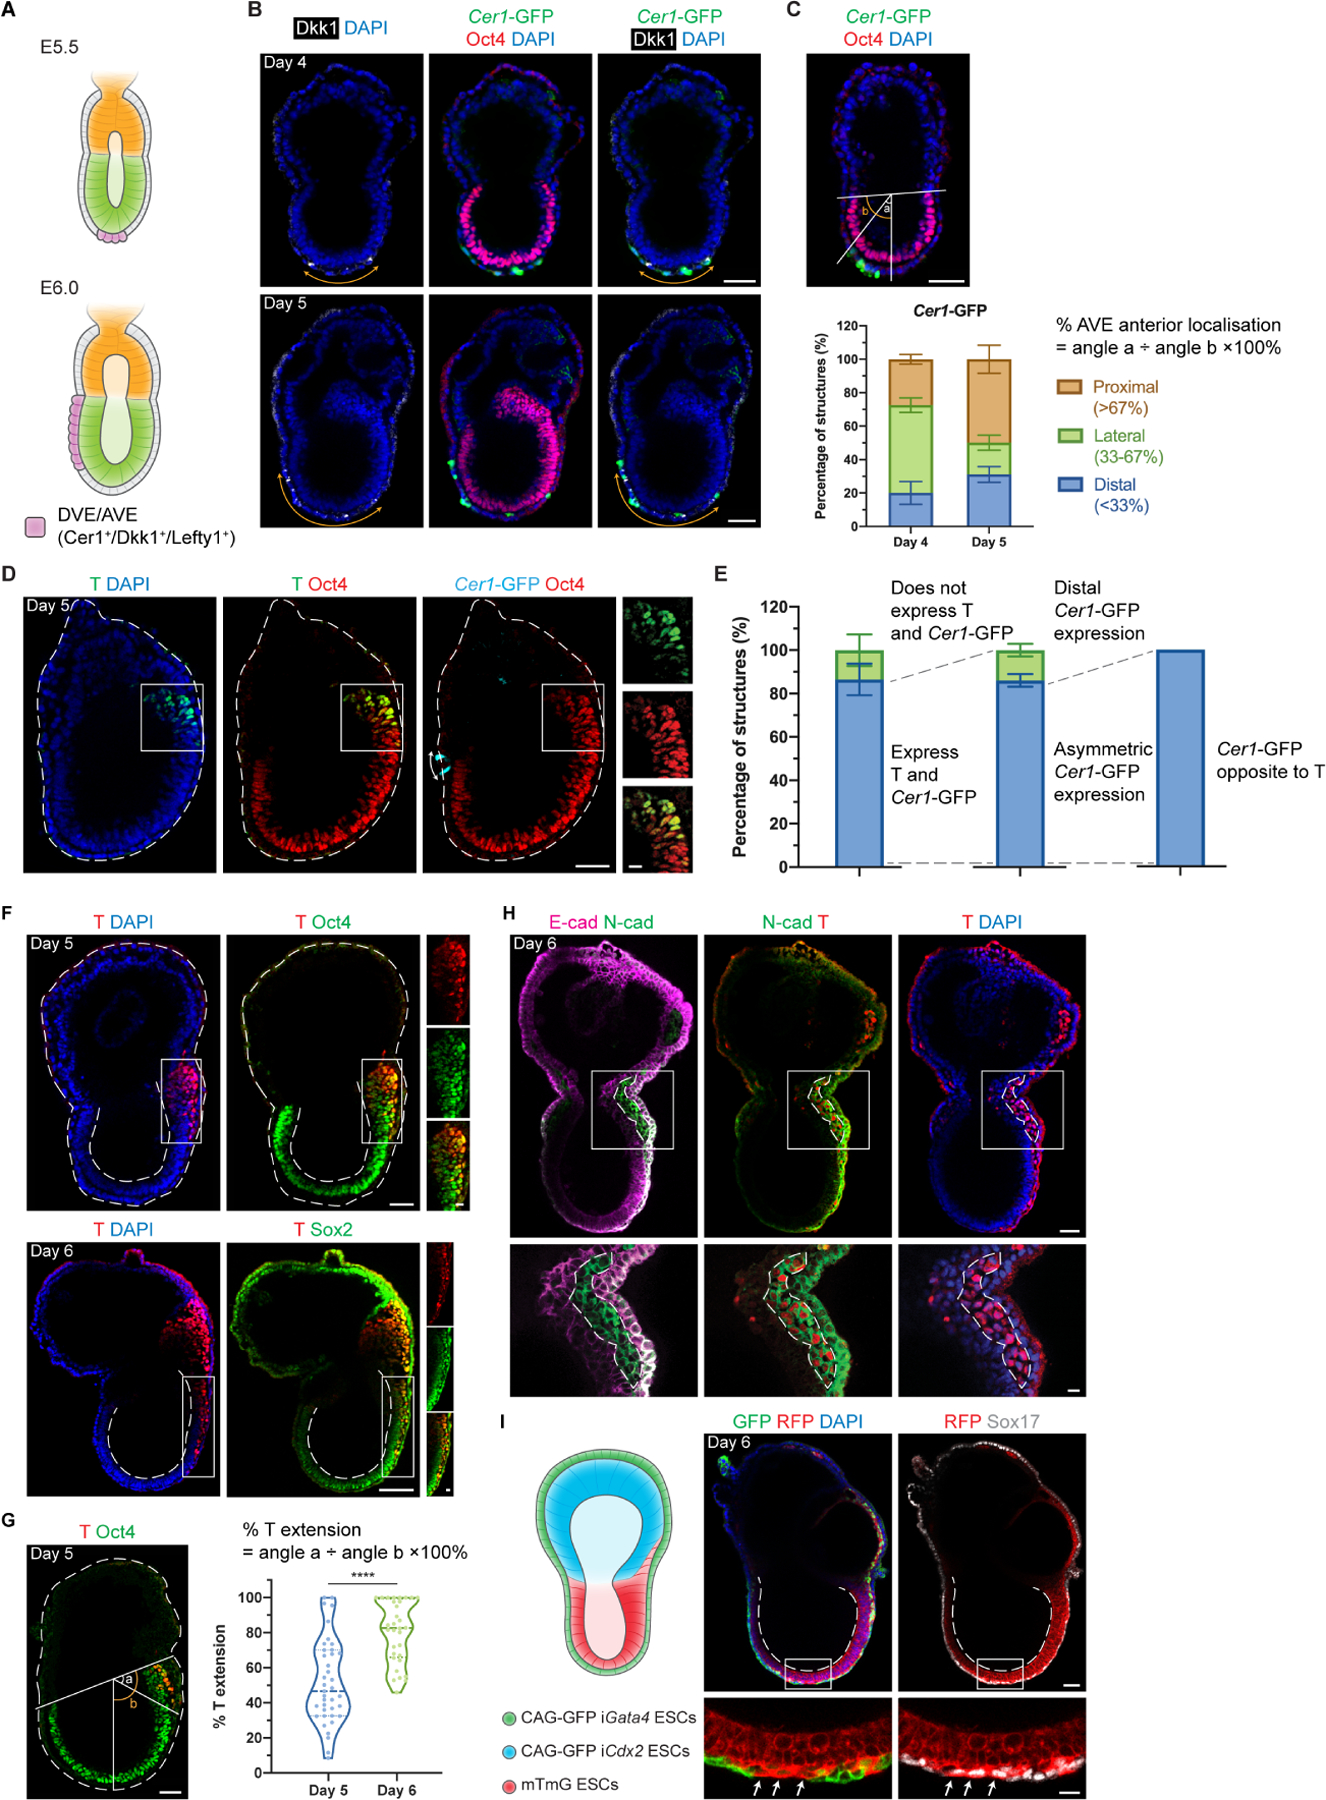
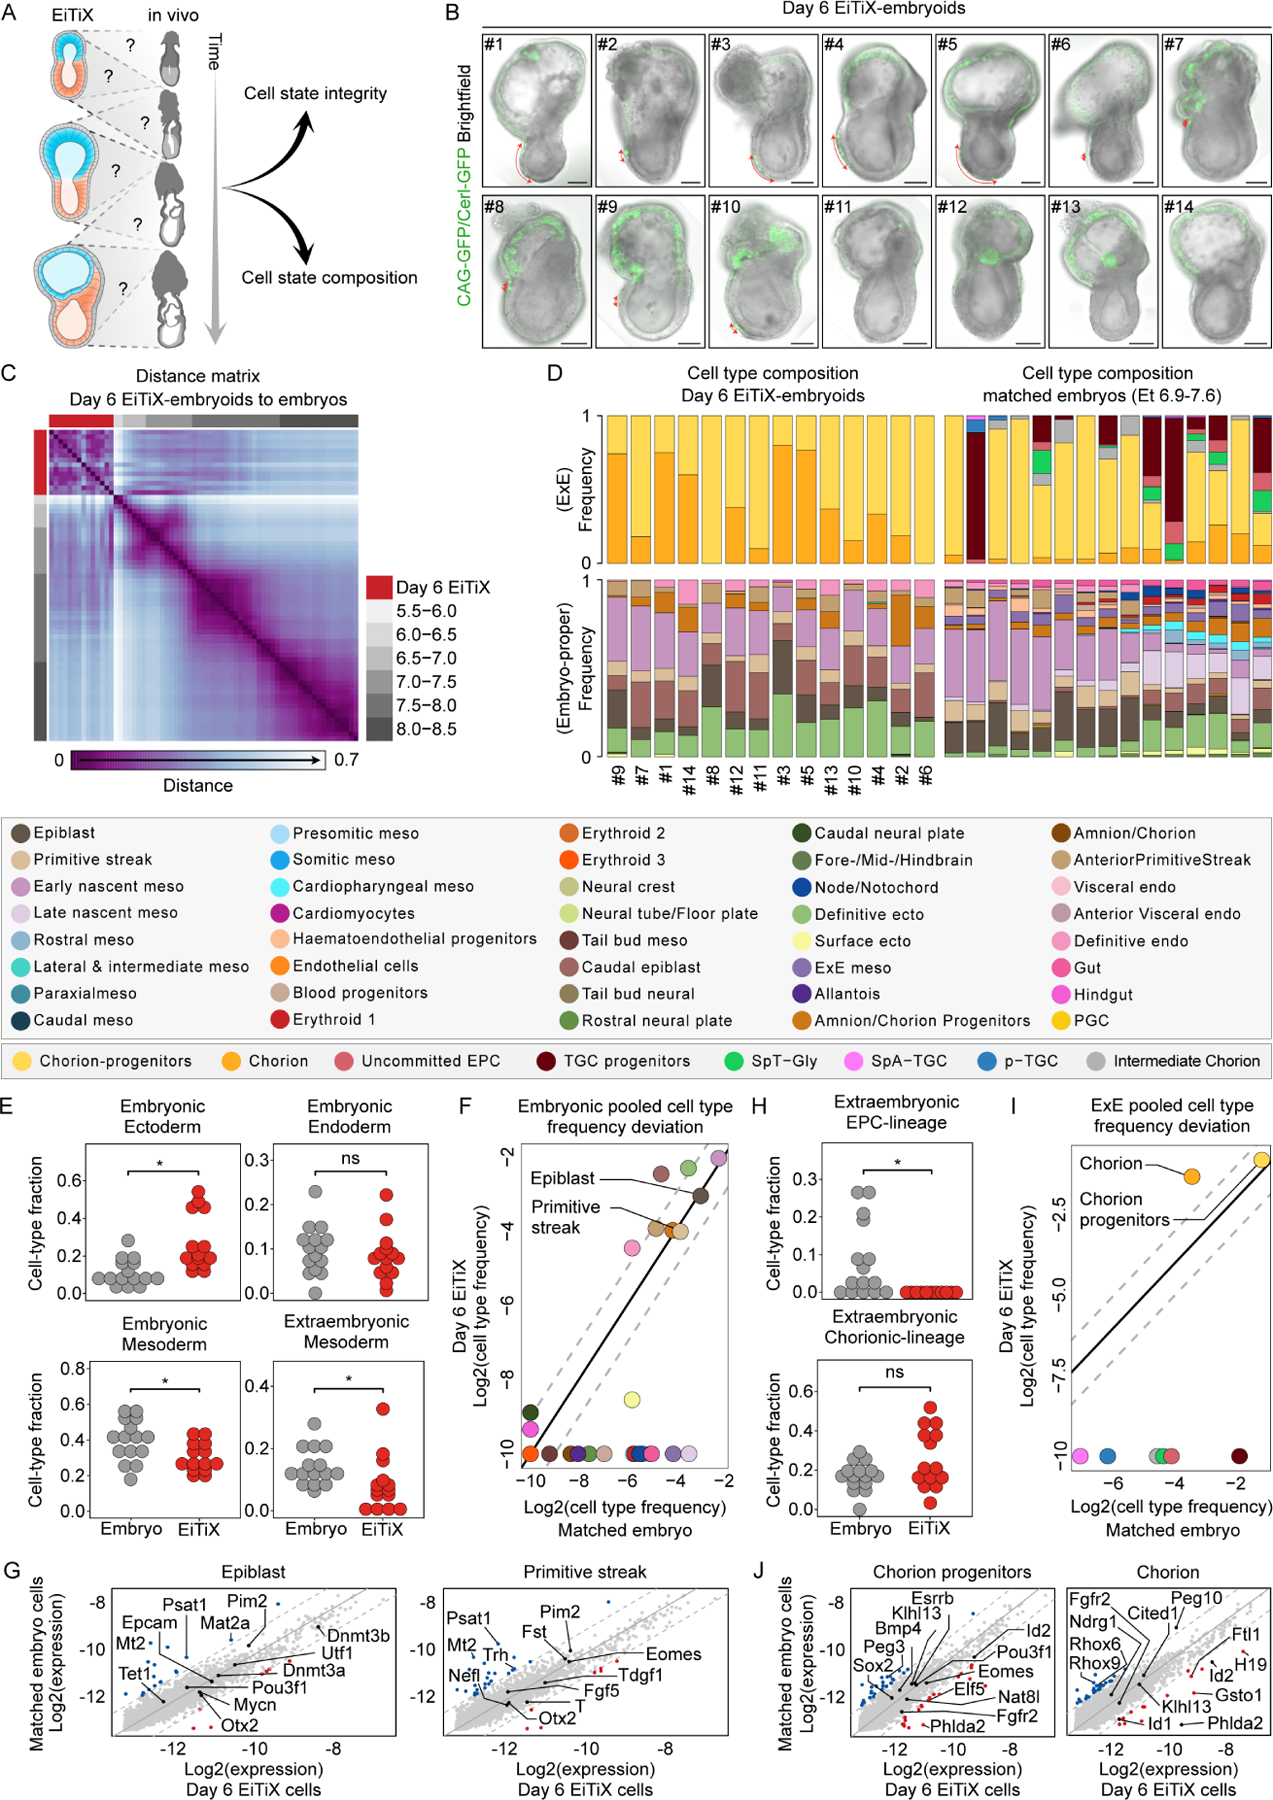
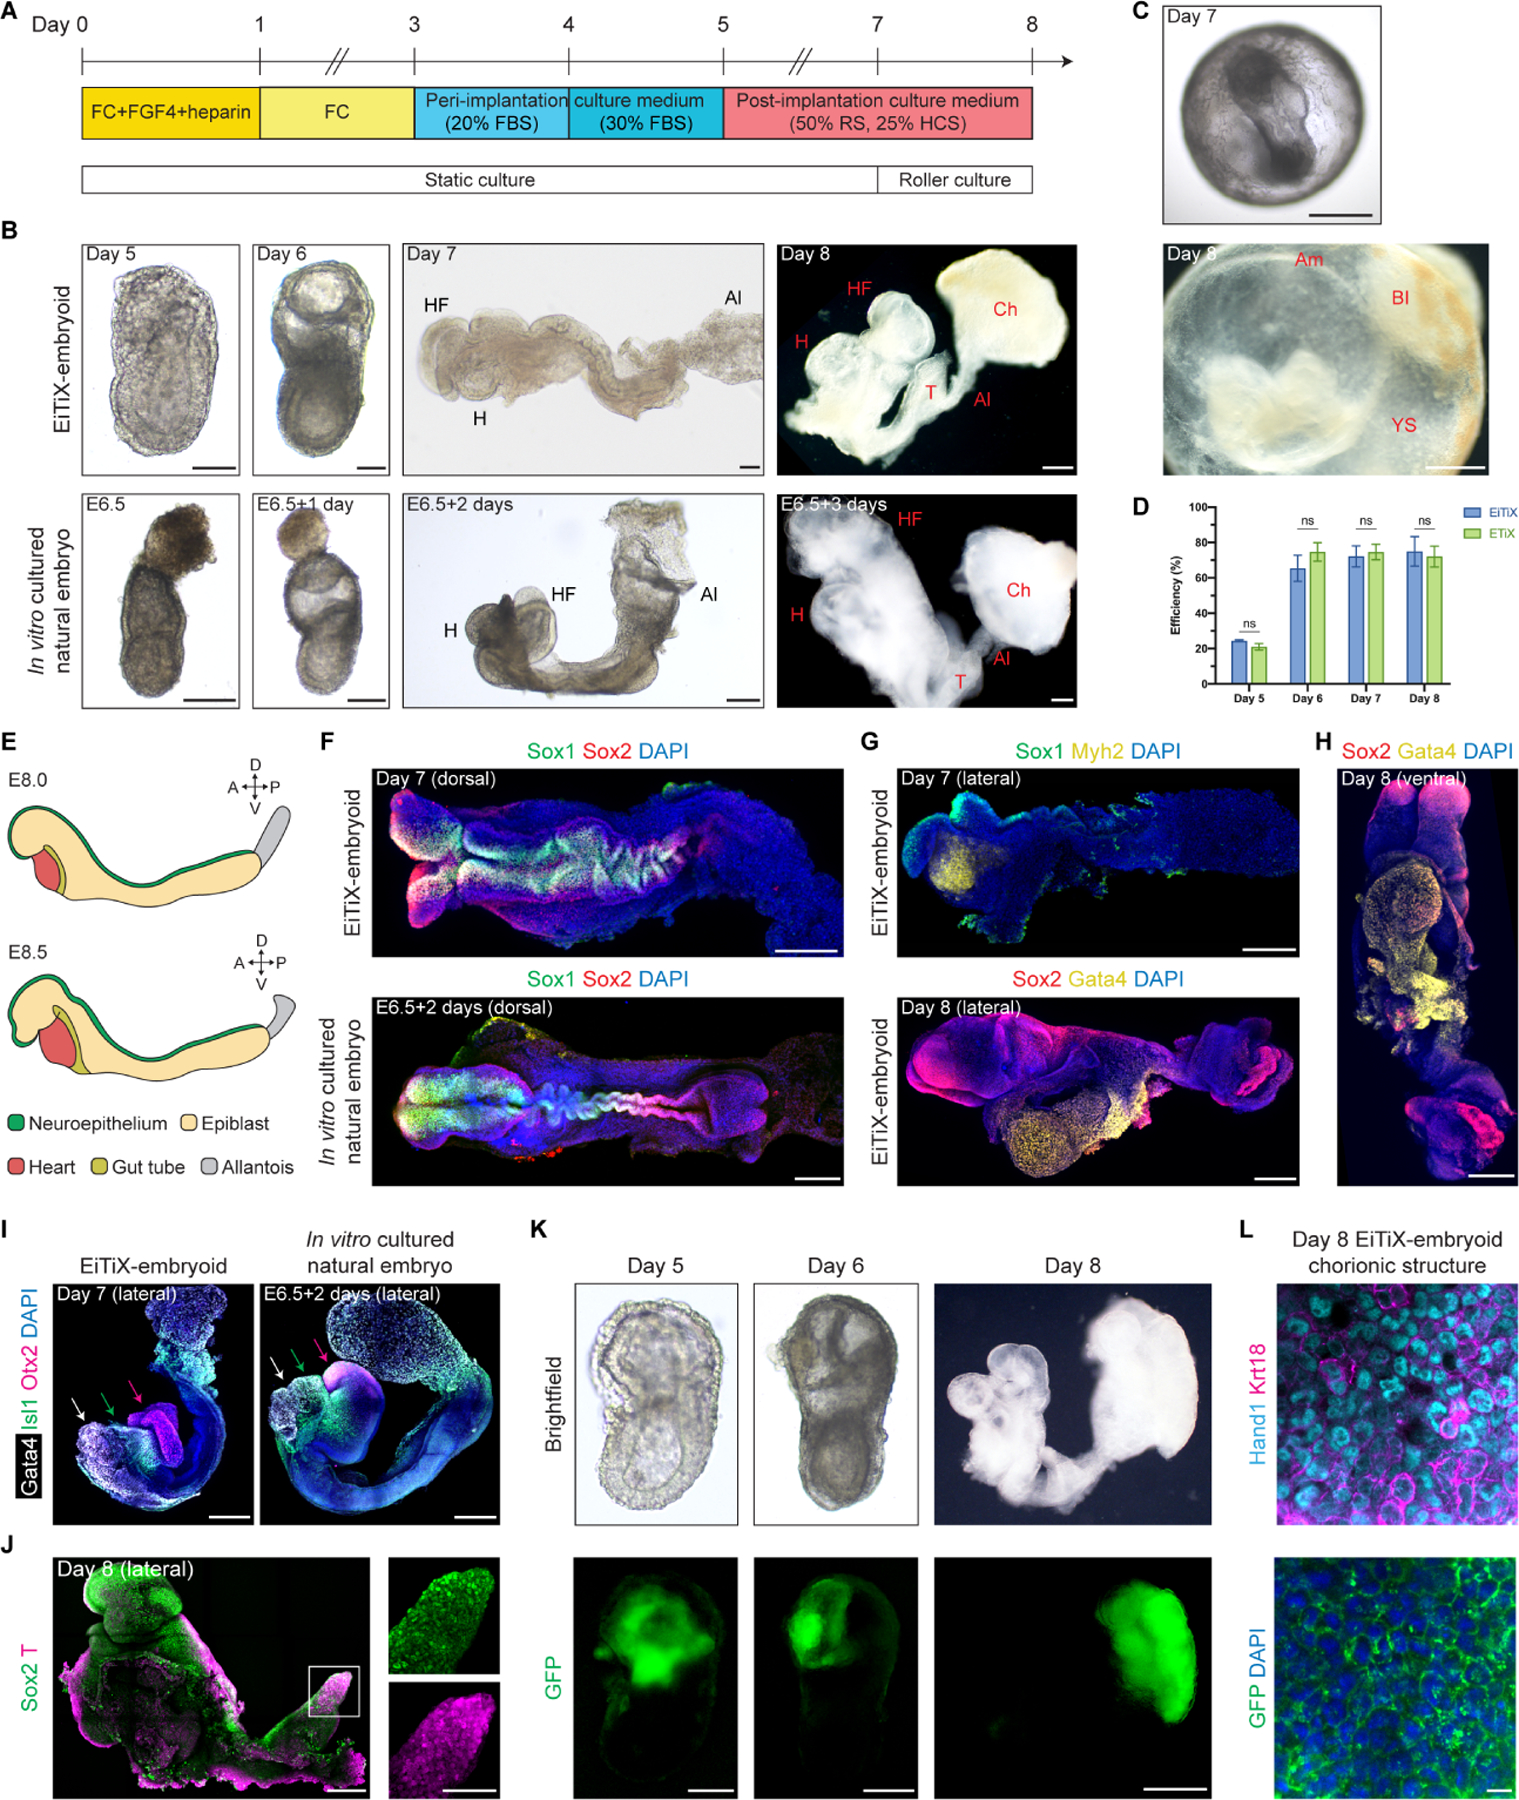
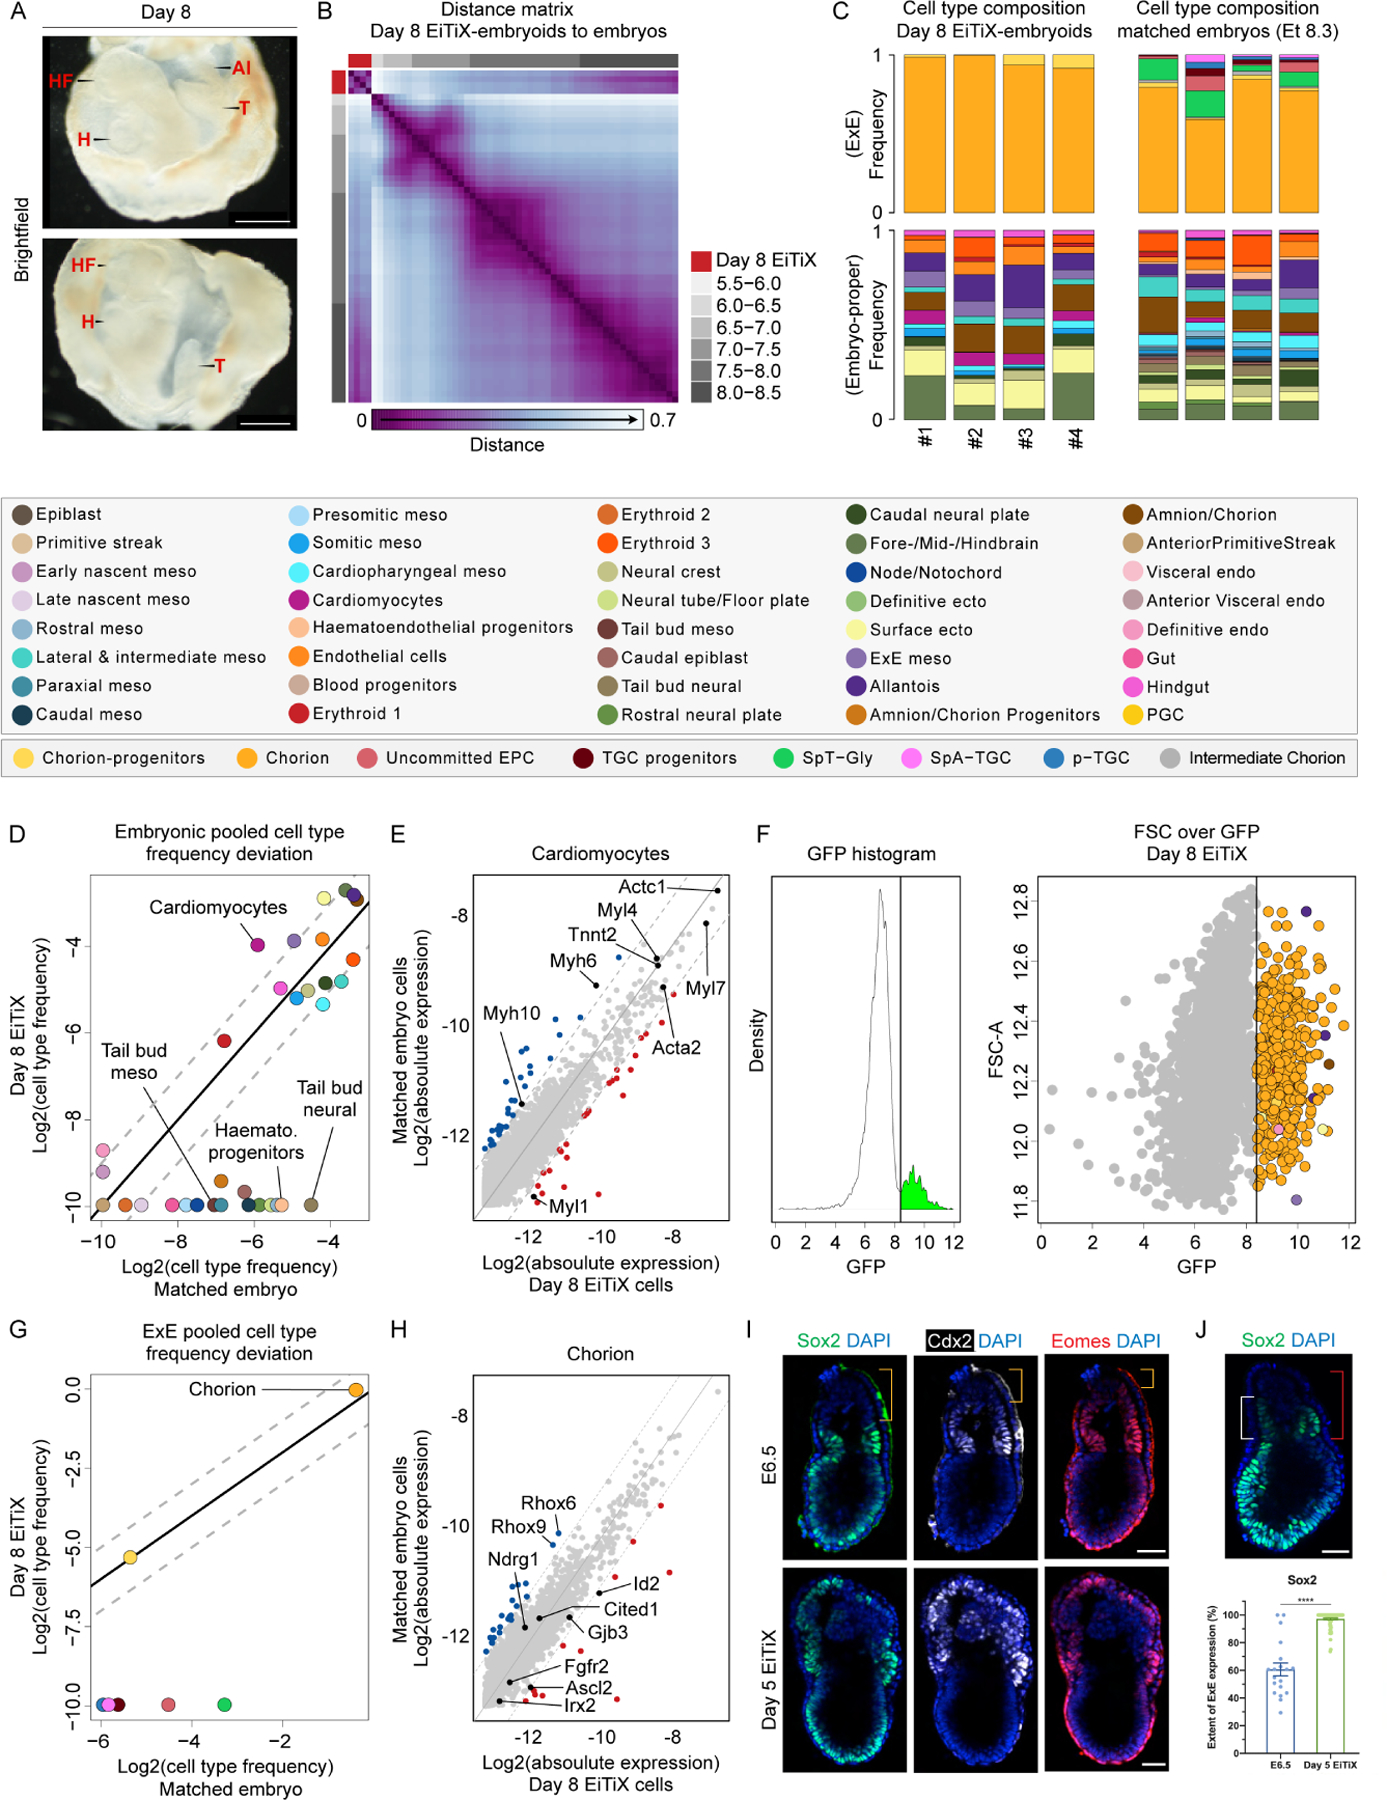
Several in vitro models have been developed to recapitulate mouse embryogenesis solely from embryonic stem cells (ESCs). Despite mimicking many aspects of early development, they fail to capture the interactions between embryonic and extraembryonic tissues. To overcome this difficulty, we have developed a mouse ESC-based in vitro model that reconstitutes the pluripotent ESC lineage and the two extraembryonic lineages of the post-implantation embryo by transcription-factor-mediated induction. This unified model recapitulates developmental events from embryonic day 5.5 to 8.5, including gastrulation; formation of the anterior-posterior axis, brain, and a beating heart structure; and the development of extraembryonic tissues, including yolk sac and chorion. Comparing single-cell RNA sequencing from individual structures with time-matched natural embryos identified remarkably similar transcriptional programs across lineages but also showed when and where the model diverges from the natural program. Our findings demonstrate an extraordinary plasticity of ESCs to self-organize and generate a whole-embryo-like structure.

Keywords: embryoid, embryogensis, in vitro model, gastrulation, neurulation, heart development, mouse embryonic stem cell.


Conflict of interest statement

Declaration of interests M.Z.-G. is an advisory board member of Cell Stem Cell. M.Z.-G. and G.A. wish to declare the filing of a patent on May 5(th), 2022 by Caltech and the University of Cambridge on the “Generation of synthetic embryos from multiple stem cell types.” The patent was filed under the following numbers: CIT File No.: CIT-8826-P and Serial Number: 63/344,251.

Figures

Figure 1.
Figure 1.. Cdx2-induced ESCs self-assemble with Gata4-induced ESCs and ESCs into post-implantation-like mouse embryoids.
(A) Schematic of the formation of cell aggregates in AggreWells. Day 3 iCdx2 ESC aggregates show elevated Eomes expression (B) and downregulated Oct4 (C) upon induction of Cdx2. (D) Schematic of EiTiX-embryoid generation. FBS: fetal bovine serum, KSR: knockout serum replacement. (E) Representative brightfield images of structures developing in AggreWells from Day 0 to Day 4. A structure resembling the early post-implantation mouse embryo can be seen on Day 4 in the well outlined in red. (F) All structures in the combined microwells from one AggreWell were collected at Day 4 and stained to reveal Cdx2 (cyan), Oct4 (red) and Gata6 (white). Arrows indicate structures considered to exhibit correct organisation. Such cylindrical structures with two cellular compartments and an epithelialised EPI-like cell layer (red dashed outline) were selected under brightfield microscopy. The efficiency of obtaining organised structures in EiTiX-embryoid system and ETiX-embryoid system is shown. Efficiency of ETiX-embryoid is taken from our previous publication (referring to these embryoids as iETX-embryoids, Amadei et al., 2021). (G) Day 4 EiTiX-embryoids stained to reveal Cdx2 (cyan), Oct4 (red) and Gata6 (white). (H) Day 4 EiTiX-embryoid stained to reveal Cdx2 (white), GFP (green) and Oct4 (red). The percentage of the Cdx2-positive cells that are also GFP-positive is shown. n = 49 structures. (I) Day 4 EiTiX-embryoids stained to reveal Eomes (green), Ap2γ (magenta) and Oct4 (white). n = 35/35 structures are positive for both Eomes and Ap2γ. All experiments were performed minimum 3 times. Scale bars: 10μm, (B-C); 150μm, (E-F); 50μm, (G-I). See also Figure S1.
Figure 2.
Figure 2.. EiTiX-embryoids establish an anterior-posterior axis and undergo gastrulation.
(A) Schematic showing the position of DVE/AVE in E5.5 and E6.5 mouse embryos. (B) Day 4 and Day 5 EiTiX-embryoids stained to reveal Cer1-GFP (green), Oct4 (red) and Dkk1 (white). Orange double-headed arrows indicate Dkk1-positive domains. (C) Localisation of Cer1-GFP in Day 4 and Day 5 EiTiX-embryoids (See Materials and Methods for quantification method). n = 57 Day 4 structures; 45 Day 5 structures. (D) Day 5 EiTiX-embryoids stained to reveal T (green), Oct4 (red) and Cer1-GFP (cyan). Double-headed arrow, Cer1-GFP-expressing domain; white box outline, T- and Oct4-positive domain. (E) Percentages of Day 5 EiTiX-embryoids showing 1) expression of both Cer1-GFP and T in same structure, 2) asymmetric Cer1-GFP expression, and 3) T expression on the opposite side from Cer1-GFP. n = 42 structures. (F) Day 5 and Day 6 EiTiX-embryoids stained to reveal T (red) and Oct4 (green) or Sox2 (green). White boxes enclose T-positive domain while dotted lines outline the structure and the lumen of ES compartment. n = 39/42 Day 5 structures and 32/32 Day 6 structures. (G) Percentage of T extension in Day 5 and Day 6 EiTiX-embryoids. See Materials and Methods for quantification method. n = 39 Day 5 structures and 32 Day 6 structures. ****p < 0.0001. (H) Day 6 EiTiX-embryoid stained to reveal E-cadherin (magenta), N-cadherin (green) and T (red). Dotted line indicates T- and N-cadherin-positive domain. n = 14/21 structures with N-cadherin upregulation and E-cadherin downregulation from 4 experiments. (I) Schematic of EiTiX-embryoids using CAG-GFP iGata4 ESCs (with membrane GFP) and mTmG ESCs (with membrane tdTomato) to construct the VE-like layer and EPI-like compartment, respectively. Day 6 EiTiX-embryoid stained to reveal GFP (green), RFP (red) and Sox17 (white). Dotted line indicates the lumen of ES compartment while arrows mark definitive endoderm-like cells intercalated into the VE-like layer. n = 8/12 structures. All experiments were performed minimum 3 times. Scale bars: 50μm; 15μm (zoomed). See also Figure S2.
Figure 3.
Figure 3.. Day 6 EiTiX-embryoids capture major cell types of gastrulation.
(A) Evaluation of cell state integrity and cell type composition of Day 6 EiTiX-embryoids using our recently established time-resolved model of mouse gastrulation. (B) Brightfield images of Day 6 EiTiX-embryoids (n = 14, annotated as S#1–14) collected for single-structure, single-cell RNA sequencing, overlaid with GFP expression (Cer1-GFP reporter in VE-like layer and membrane CAG-GFP from iCdx2 ESCs in ExE-like compartment). Red arrow indicates Cer1-GFP expression. Scale bar: 100μm. (C) Embryo-embryo cell type composition similarity matrix. Natural embryos are annotated based on embryonic age groups (grey), Day 6 EiTiX-embryoids (red). (D) Cell type composition bars of individual Day 6 EiTiX-embryoids (left) and matched natural embryos (right, annotated according to the key shown below). (E, H) Comparison of major embryonic germ layers frequency (E) and ExE lineages frequency (H) between Day 6 EiTiX-embryoids and matching natural embryos. Medians of frequencies were compared using a Wilcoxon-Mann-Whitney rank sum test after down sampling of cell state specific cells to corresponding number of Day 6 EiTiX cell state specific cells (i.e. for each cell state individually). q Values were calculated from p values according to the Benjamini-Hochberg procedure. ns, not significant; *, q value < 0.05. Major germ layers - Embryonic ectoderm; Forebrain/Midbrain/Hindbrain, Rostral neural plate, Surface ectoderm, Caudal neural plate, Definitive ectoderm. Embryonic endoderm; Definitive endoderm, Gut, Hindgut, Visceral and Anterior Visceral endoderm. Embryonic mesoderm; Tail bud-, Early and Late nascent-, Caudal-, Presomitic-, Somitic-, Paraxial-, Rostral-, Cardioparyngeal- and Lateral & intermediate-mesoderm. ExE Mesoderm; Amnion/Chorion progenitor, Amnion/Chorion, Allantois and ExE mesoderm. EPC-lineage; SpT-Gly, TGC progenitors, uncommitted EPC, pTGC and SpA-TGCs. Chorion-lineage; intermediate ExE, Chorion progenitors and Chorion. (F, I) Pooled embryonic (F) and ExE (I) cell type frequencies comparison between Day 6 EiTiX-embryoids and matched natural embryos. (G, J) Bulk differential gene expression per cell type of Day 6 EiTiX cells against matched embryo cells in embryonic cell types (G, EPI and primitive streak) and ExE cell types (J, chorion progenitors and chorion). Dots represent individual genes. Color annotated dots mark genes with a two-fold change in expression (blue – above two-fold decrease in Day 6 EiTiX cells, red – above two-fold increase in Day 6 EiTiX cells). See also Figure S3.
Figure 4.
Figure 4.. EiTiX-embryoids develop to late headfold stages with heart and chorion development.
(A) Schematic showing culture conditions of EiTiX-embryoids to Day 8. FBS: fetal bovine serum, RS: rat serum, HCS: human cord serum. (B) Representative brightfield images EiTiX-embryoids cultured from Day 5 to 8 and E6.5 natural embryo cultured in vitro for 3 days. Al: allantois, Ch: chorion, H: heart, HF: headfolds, T: tail. Scale bar, 100μm. (C) Brightfield images of Day 7 and Day 8 EiTiX-embryoids before dissecting yolk sac-like membrane. Am: amnion, BI: blood island, YS: yolk sac. Scale bar, 200μm (Day 7); 500μm (Day 8). (D) Efficiency of EiTiX-embryoid and ETiX-embryoid progression from Day 4 to 5, Day 5 to 6, Day 6 to 7, and Day 7 to 8. Efficiency of ETiX-embryoid is taken from our publication (Amadei et al., 2022). Embryoids were selected on each day for further culture and experiments were performed minimum 3 times. Multiple t-tests. ns, non-significant. (E) Schematic showing major cell types in E8.0 and E8.5 embryos. (F) Dorsal view of Day 7 EiTiX-embryoid and E6.5 natural embryo cultured in vitro for 2 days and stained to reveal Sox1 (green) and Sox2 (red). Scale bar, 200μm. (G) Lateral view of Day 7 and Day 8 EiTiX-embryoids stained to reveal neuroepithelial markers Sox1 (green) or Sox2 (red) and heart markers Myh2 or Gata4 (yellow). Scale bar, 200μm. (H) Ventral view of Day 8 EiTiX-embryoid stained to reveal Sox2 (red) and Gata4 (yellow), resembling the linear heart tube stage. Scale bar, 200μm. (I) Lateral view of Day 7 EiTiX-embryoid and E6.5 natural embryo cultured in vitro for two days stained to reveal heart marker Gata4 (white), pharyngeal mesoderm marker Isl1 (green), and forebrain marker Otx2 (magenta). Scale bar, 200μm. (J) Lateral view of Day 8 EiTiX-embryoids stained to reveal Sox2 (green) and T (red). Magnified panel showing co-expression in tail region (white square). Scale bar, 200μm; 100μm (zoomed). (K) Representative brightfield and GFP fluorescence image of Day 5 to 8 EiTiX-embryoids to track the contribution of CAG-GFP iCdx2 ESCs. Structures show GFP expression in chorion-like region. Scale bar, 50μm (Day 5); 200μm (Day 6); 500μm (Day 8). (L) Dissected chorionic structure from Day 8 EiTiX-embryoid stained to reveal GFP (green), Hand1 (cyan) and Keratin18 (magenta). Scale bar, 100μm. See also Figure S4 and Movie S1–2.
Figure 5.
Figure 5.. Cell state and composition analysis of neurulating embryoids using scRNA-seq.
(A) Brightfield images of Day 8 EiTiX-embryoids collected for single-structure, single-cell RNA sequencing. The yolk sac-like membrane was partially opened to reveal embryonic structures. Al: allantois, H: heart, HF: headfolds, T: tail. Scale bar: 500μm. (B) Embryo-embryo cell type composition similarity matrix. Natural embryos are annotated based on embryonic age groups (grey), Day 8 EiTiX-embryoids (red). (C) Cell type composition bars of individual Day 8 EiTiX-embryoids (left) and matched natural embryos (right, annotated according to the legend below). (D, G) Pooled embryonic (D) and ExE (G) cell type frequencies comparison between Day 8 EiTiX-embryoids and matched natural embryos. (E, H) Bulk differential gene expression per cell state of Day 6 EiTiX cells against matched embryo cells in embryonic cell type (E, cardiomyocyte) and ExE cell type (H, chorion). Dots represent individual genes. Colour annotated dots mark genes with a two-fold change in expression (blue – above two-fold decrease in Day 6 EiTiX cells, red – above two-fold increase in Day 6 EiTiX cells). (F) GFP channel bimodal distribution (left) with threshold use to define GFP+ cell population shown as dots, annotated accordingly to cell type (right). (I) Day 5 EiTiX-embryoids and E6.5 natural embryos stained to reveal trophoblast stem markers Sox2 (green), Cdx2 (white) and Eomes (red). Orange brackets show the absence of trophoblast stem markers in the tip of ExE in E6.5 embryos. Scale bar: 50μm. (J) Quantification of the extent of ExE expression of Sox2. It was determined by dividing the height of the expression domain (white bracket) by the height of ExE (red bracket), multiplied by 100%. n = 19 E6.5 embryos from 2 experiments and 78 Day 5 EiTiX-embryoids from 3 experiments; ****p < 0.0001. Scale bar: 50μm. See also Figure S5.

Comment in

References

    1. Aguilera-Castrejon A et al. (2021) ‘Ex utero mouse embryogenesis from pre-gastrulation to late organogenesis’, Nature, 593(7857), pp. 119–124. doi: 10.1038/s41586-021-03416-3. - DOI - PubMed
    1. Amadei G et al. (2021) ‘Inducible Stem-Cell-Derived Embryos Capture Mouse Morphogenetic Events In Vitro’, Developmental Cell, pp. 1–17. doi: 10.1016/j.devcel.2020.12.004. - DOI - PMC - PubMed
    1. Amadei G et al. (2022) ‘Synthetic embryos derived from mouse embryonic and extra-embryonic stem cells recapitulate gastrulation, neurulation and early organogenesis’, Nature doi: 10.1038/s41586-022-05246-3. - DOI
    1. Arnold SJ and Robertson EJ (2009) ‘Making a commitment: Cell lineage allocation and axis patterning in the early mouse embryo’, Nature Reviews Molecular Cell Biology, 10(2), pp. 91–103. doi: 10.1038/nrm2618. - DOI - PubMed
    1. Baran Y et al. (2019) ‘MetaCell: Analysis of single-cell RNA-seq data using K-nn graph partitions’, Genome Biology, 20(1). doi: 10.1186/s13059-019-1812-2. - DOI - PMC - PubMed

Publication types

LinkOut - more resources