. 2022 Sep 9;14(1):103.
doi: 10.1186/s13073-022-01108-9.

Single-cell transcriptomics reveals common epithelial response patterns in human acute kidney injury

Affiliations

Single-cell transcriptomics reveals common epithelial response patterns in human acute kidney injury

Christian Hinze et al. Genome Med. .

Abstract

Background: Acute kidney injury (AKI) occurs frequently in critically ill patients and is associated with adverse outcomes. Cellular mechanisms underlying AKI and kidney cell responses to injury remain incompletely understood.

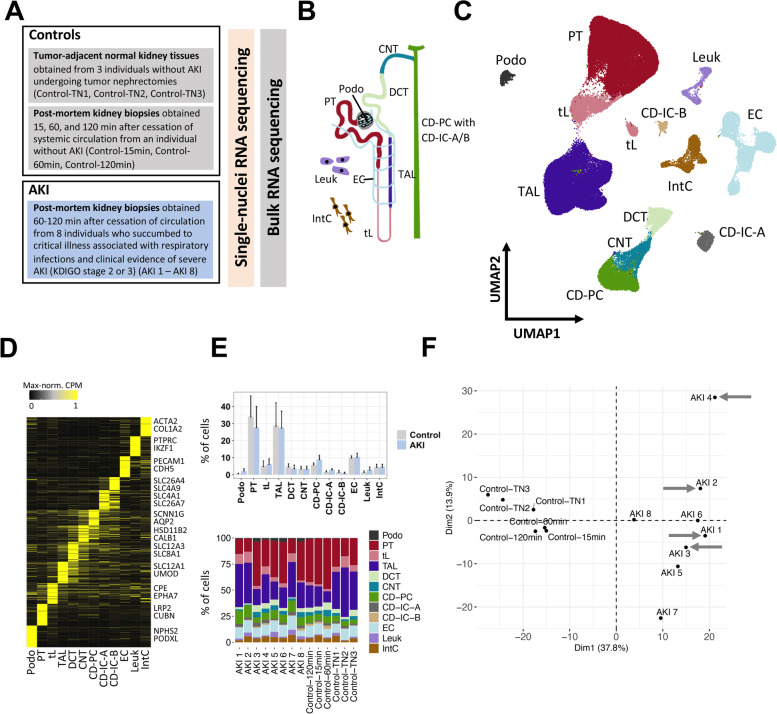
Methods: We performed single-nuclei transcriptomics, bulk transcriptomics, molecular imaging studies, and conventional histology on kidney tissues from 8 individuals with severe AKI (stage 2 or 3 according to Kidney Disease: Improving Global Outcomes (KDIGO) criteria). Specimens were obtained within 1-2 h after individuals had succumbed to critical illness associated with respiratory infections, with 4 of 8 individuals diagnosed with COVID-19. Control kidney tissues were obtained post-mortem or after nephrectomy from individuals without AKI.

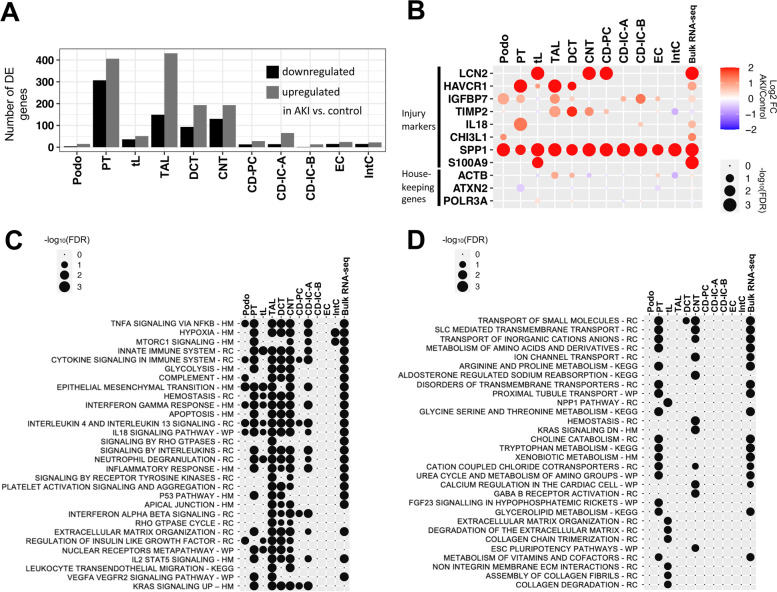
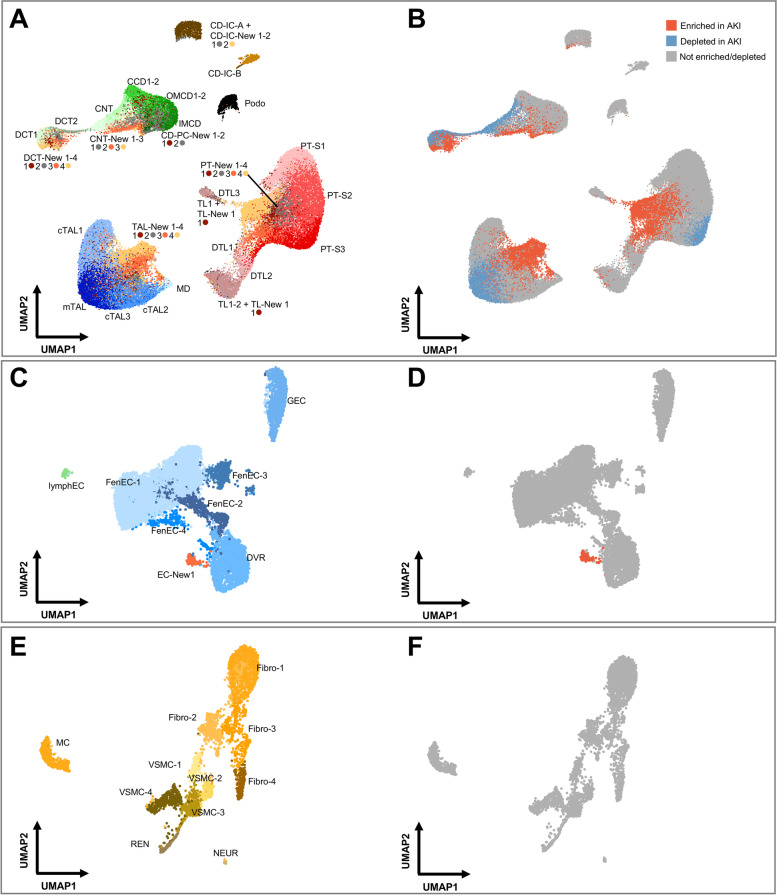
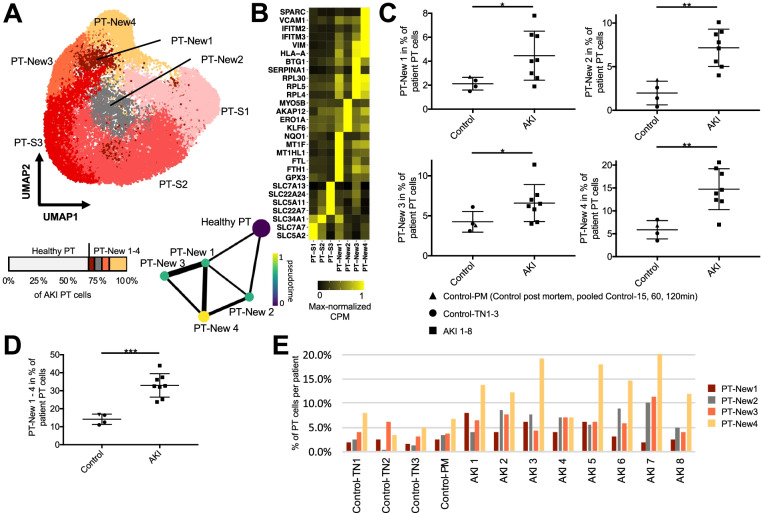
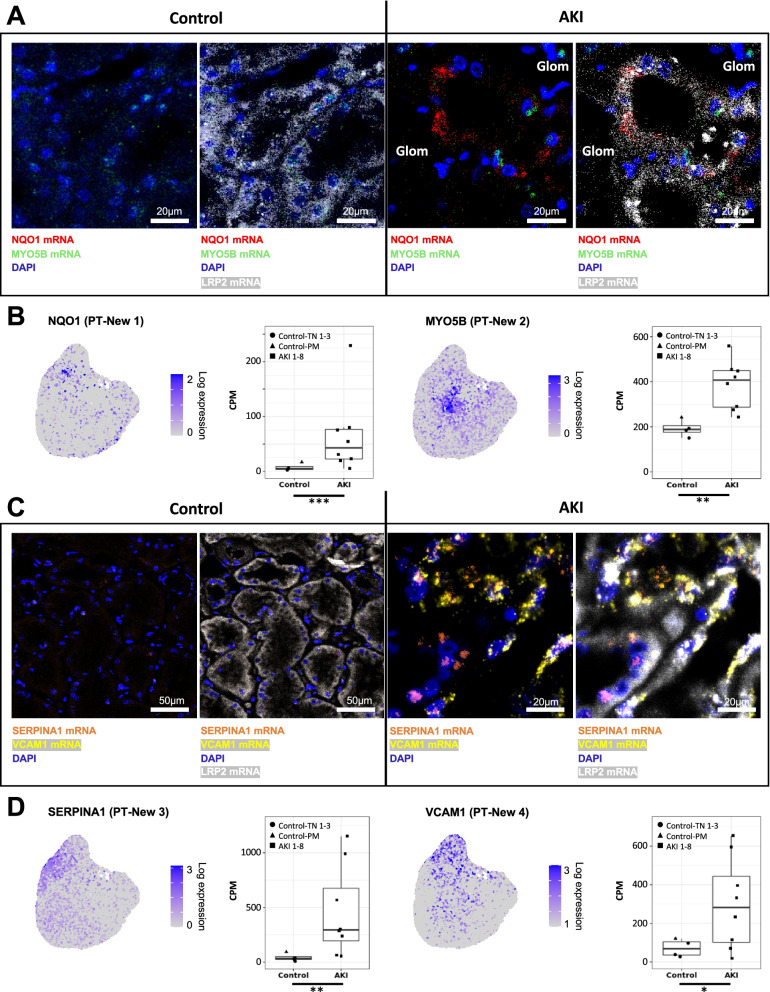
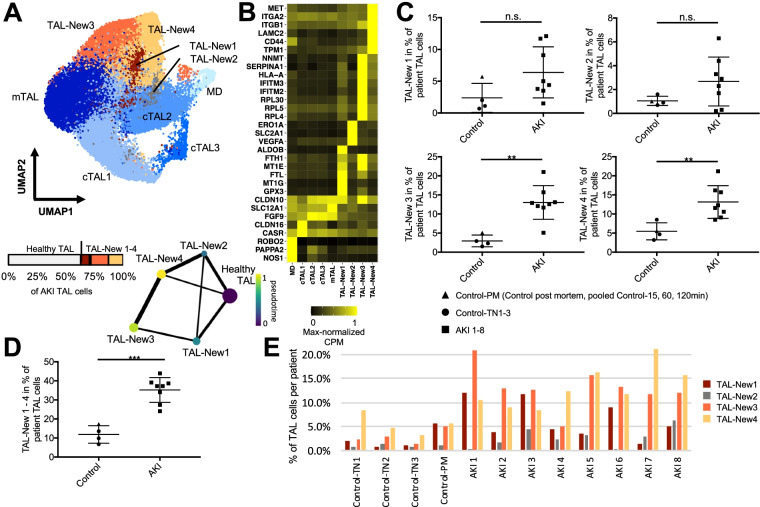
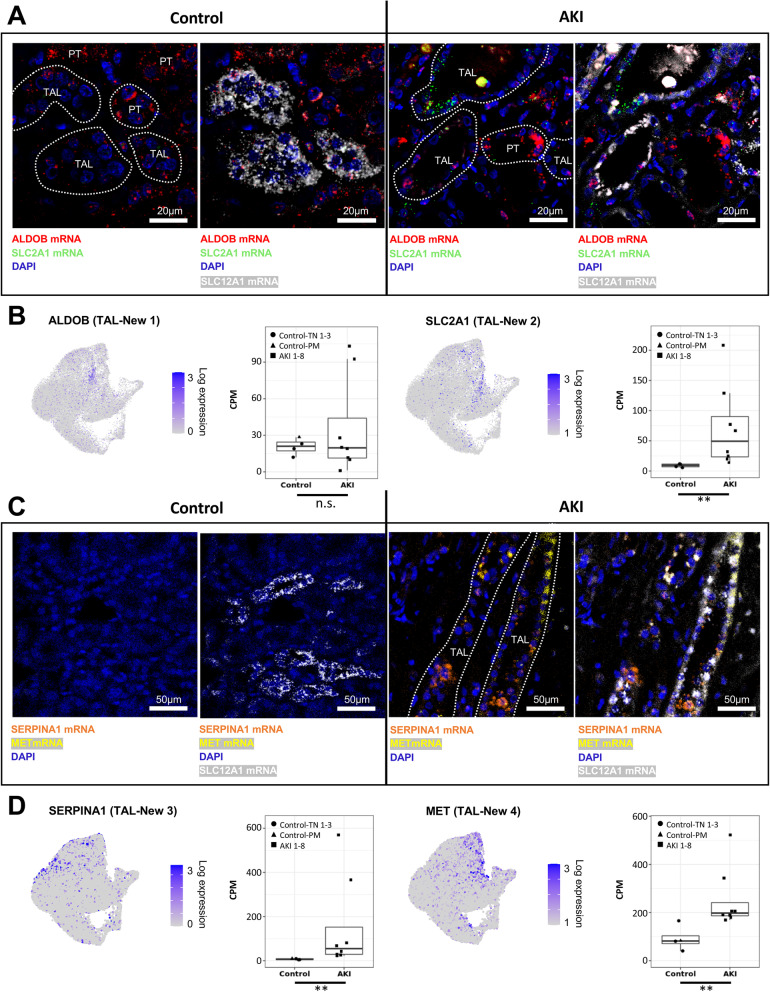
Results: High-depth single cell-resolved gene expression data of human kidneys affected by AKI revealed enrichment of novel injury-associated cell states within the major cell types of the tubular epithelium, in particular in proximal tubules, thick ascending limbs, and distal convoluted tubules. Four distinct, hierarchically interconnected injured cell states were distinguishable and characterized by transcriptome patterns associated with oxidative stress, hypoxia, interferon response, and epithelial-to-mesenchymal transition, respectively. Transcriptome differences between individuals with AKI were driven primarily by the cell type-specific abundance of these four injury subtypes rather than by private molecular responses. AKI-associated changes in gene expression between individuals with and without COVID-19 were similar.

Conclusions: The study provides an extensive resource of the cell type-specific transcriptomic responses associated with critical illness-associated AKI in humans, highlighting recurrent disease-associated signatures and inter-individual heterogeneity. Personalized molecular disease assessment in human AKI may foster the development of tailored therapies.

Keywords: Acute kidney injury; Critical illness; Single-cell sequencing.


Conflict of interest statement

The authors declare no competing interests.

Figures

Fig. 1
Fig. 1
A single-cell census of human AKI. A Overview of the study and samples subjected to snRNA-seq and bulk RNA-seq. B Major cell types of the human kidney (Podo, podocytes; PT, proximal tubule; tL, thin limb; TAL, thick ascending limb; DCT, distal convoluted tubule; CNT, connecting tubule; CD-PC/IC-A/IC-B, collecting duct principal/intercalated cells type A and B; Leuk, leukocytes; IntC, interstitial cells). C Uniform manifold approximation and projection (UMAP) of all kidney cells from snRNA-seq from individuals with AKI and controls. D Heatmap of marker genes of each major cell type. Examples of known cell type marker genes are indicated. Expression values are shown as per-gene maximum-normalized counts per million (CPM). E Relative abundances of major cell types in individuals with AKI and controls (mean and standard deviation) (upper panel) and stacked bar plots for all individuals and major cell types (lower panel). F Principal component analysis of all study individuals using pseudobulk data per individual from all proximal tubule (PT) cells and PT-specific highly variable genes (see Additional file 1: Fig. S2 for other cell types and whole tissue). COVID-associated AKI cases are highlighted by gray arrows
Fig. 2
Fig. 2
Cell type-specific responses of kidney cells to acute injury. A Absolute numbers of differentially expressed (DE) genes upregulated and downregulated in AKI versus controls within major kidney cell types. B Dot plot displaying the degree of differential expression for known injury marker genes and housekeeping control genes (actin beta (ACTB), ataxin 2 (ATXN2), and RNA polymerase III subunit A (POLR3A)). C, D Dot plots for top enriched pathways (defined by FDR) in genes upregulated (C) and downregulated (D) in AKI versus controls. Note that although the number of DE genes varied strongly between the cell types (e.g., Podo vs. PT), we observed similar enrichment results in several cell types. HM – Molecular Signatures Database (MSigDB) hallmark gene sets, MSigDB canonical pathway gene sets derived from RC, Reactome; WP, WikiPathways; and KEGG, Kyoto Encyclopedia of Genes and Genomes
Fig. 3
Fig. 3
AKI leads to depletion of differentiated cell states and enrichment of “New” cell states within the kidney epithelium. A, B UMAP plot of subclustered kidney tubular epithelial cells (A) and their enrichment or depletion in AKI based on statistical testing of relative abundances within the respective major cell type (B) (see the “Methods” section for details). In A, cellular subtypes of the kidney tubule are annotated as indicated. To enhance visibility, color code is indicated below the respective labeling. In B, the same UMAP plot as in A is color-coded based on enrichment (red) or depletion (blue) in AKI individuals. C, D Analogous plots for subclustering of endothelial cells (ECs). Please note the emergence of one AKI-associated subcluster, EC-New 1. E, F Analogous plots for subclusterings of interstitial cells. PT-S1-3, PT S1-3 segments; c/mTAL, cortical/medullary TAL; TL, DTL, thin limb and descending thin limb; CCD, OMCD, IMCD, cortical/outer and inner medullary collecting duct principal cell; lymphEC, lymphatic EC; GEC, glomerular EC; FenEC 1–4, fenestrated endothelial cell types; DVR, descending vasa recta; MC, mesangial cells; VSMC, vascular smooth muscle cells; REN, renin-transcribing cells; Fibro, fibroblasts; NEUR, neuronal cells
Fig. 4
Fig. 4
PT AKI-enriched cell states reveal four distinct injury response patterns. A UMAP plot of subclustering of the PT with the anatomical PT segments S1-3 (PT-S1-3) and the AKI-associated cell states PT-New 1–4 (also depicted in Fig. 3A). Below the UMAP are a bar plot displaying the relative abundances of PT-New 1–4 with respect to all AKI PT cells and a trajectory analysis using partition-based graph abstraction (PAGA) highlighting diffusion pseudotime. Line widths of the connecting edges represent statistical connectivity between the nodes [56]. Healthy PT-S1-3 were summarized to healthy PT for this analysis. B Heatmap of selected marker genes for the identified PT cell subpopulations from marker gene analysis (Additional file 7: Table S6) and published markers for the anatomical segments PT-S1-3. C Plots display relative abundance of PT-New 1–4 as percentage of all PT cells. D Plot displays relative abundance of combined PT-New 1–4 as percentage of all PT cells. E Individual abundances of PT-New 1–4 for control and AKI individuals. P-value: * < 0.05, ** < 0.01, *** < 0.001; n.s., not significant. Control-PM, pooled samples (Control15 min, Control60 min, Control120 min) of post mortem non-AKI control individual
Fig. 5
Fig. 5
Multi-channel in situ hybridizations confirm the presence of the four “New” cell states in PTs. A In situ hybridizations for oxidative stress-related gene NQO1 (marker gene for PT-New 1), hypoxia-associated gene MYO5B (marker gene for PT-New 2) and canonical PT marker gene LRP2. Note that some MYO5B expression is observed in control samples as expected from the CPM values presented in B. B Feature plots highlighting the expression of NQO1 and MYO5B in PTs (compare to Fig. 4A) as well as box plots showing the expression of the respective gene in PTs in control versus AKI samples. C In situ hybridizations for inflammation response gene SERPINA1 (marker gene for PT-New 3), EMT-associated gene VCAM1 (marker gene for PT-New 4), and canonical PT marker gene LRP2. Scale bars as indicated. P-value: * < 0.05, ** < 0.01, *** < 0.001. CPM, counts per million
Fig. 6
Fig. 6
AKI-associated cell states within the thick ascending limb (TAL). A UMAP plot of TAL subclustering with the anatomical segments cTAL 1–3 and mTAL and the AKI-associated cell states TAL-New 1–4. Below the UMAP are a bar plot displaying the relative abundances of TAL-New 1–4 with respect to all AKI TAL cells and a trajectory analysis using partition-based graph abstraction (PAGA) highlighting diffusion pseudotime. Line widths of the connecting edges represent statistical connectivity between the nodes [56]. Healthy cTAL 1–3 and mTAL were summarized to healthy TAL for this analysis. B Heatmap of selected marker genes for the identified TAL cell subpopulations. C Plot displaying relative abundances of TAL-New 1–4 with respect to the individual’s TAL cells. D Relative abundances of combined TAL-New 1–4 cells with respect to the individual’s TAL cells. E Individual abundances of TAL-New 1–4 for control and AKI individuals. P-value: * < 0.05, ** < 0.01, *** < 0.001; n.s., not significant. Control-PM, pooled samples (Control15 min, Control60 min, Control120 min) of post mortem non-AKI control individual
Fig. 7
Fig. 7
Multi-channel in situ hybridizations confirm the presence of the four “New” cell states in TALs. A In situ hybridizations for oxidative stress-related gene ALDOB (marker gene of TAL-New 1), hypoxia-induced gene SLC2A1 (marker gene of TAL-New 2), and canonical TAL marker gene SLC12A1. Note that the TAL-New 1 abundance is not significantly different between AKI and control samples (compare to Fig. 6B). TAL-New 1 cells based on ALDOB expression are therefore also present in control samples. Moreover, ALDOB is also expressed in PT cells. B Feature plots highlighting the expression of ALDOB and SLC2A1 in TALs (compare to Fig. 6A) as well as box plots showing the expression of the respective genes in TALs in control versus AKI samples. C In situ hybridizations for inflammation response gene SERPINA1 (marker gene of TAL-New 3), EMT-associated gene MET (marker gene of TAL-New 4), and canonical TAL marker gene SLC12A1. Scale bars as indicated. P-value: * < 0.05, ** < 0.01, *** < 0.001. CPM, counts per million

Similar articles

Cited by

References

    1. Lafrance JP, Miller DR. Acute kidney injury associates with increased long-term mortality. J Am Soc Nephrol. 2010;21:345–352. doi: 10.1681/ASN.2009060636. - DOI - PMC - PubMed
    1. Wang HE, Muntner P, Chertow GM, Warnock DG. Acute kidney injury and mortality in hospitalized patients. Am J Nephrol. 2012;35:349–355. doi: 10.1159/000337487. - DOI - PMC - PubMed
    1. Sawhney S, et al. Intermediate and long-term outcomes of survivors of acute kidney injury episodes: a large population-based cohort study. Am J Kidney Dis. 2017;69:18–28. doi: 10.1053/j.ajkd.2016.05.018. - DOI - PMC - PubMed
    1. Chertow GM, Burdick E, Honour M, Bonventre JV, Bates DW. Acute kidney injury, mortality, length of stay, and costs in hospitalized patients. J Am Soc Nephrol. 2005;16:3365–3370. doi: 10.1681/ASN.2004090740. - DOI - PubMed
    1. Chertow GM, et al. Mortality after acute renal failure: models for prognostic stratification and risk adjustment. Kidney Int. 2006;70:1120–1126. doi: 10.1038/sj.ki.5001579. - DOI - PubMed

Publication types