. 2023 Jul;48(8):1133-1143.
doi: 10.1038/s41386-022-01442-x. Epub 2022 Sep 9.

An ensemble recruited by α2a-adrenergic receptors is engaged in a stressor-specific manner in mice

Affiliations

An ensemble recruited by α2a-adrenergic receptors is engaged in a stressor-specific manner in mice

Jordan A Brown et al. Neuropsychopharmacology. 2023 Jul.

Abstract

α2a-adrenergic receptor (α2a-AR) agonists are candidate substance use disorder therapeutics due to their ability to recruit noradrenergic autoreceptors to dampen stress system engagement. However, we recently found that postsynaptic α2a-ARs are required for stress-induced reinstatement of cocaine-conditioned behavior. Understanding the ensembles recruited by these postsynaptic receptors (heteroceptors) is necessary to understand noradrenergic circuit control. We utilized a variety of approaches in FosTRAP (Targeted Recombination in Active Populations) mice to define an ensemble of cells activated by the α2a-AR partial agonist guanfacine ("Guansembles") in the bed nucleus of the stria terminalis (BST/BNST), a region key to stress-induced reinstatement of drug seeking. We define BNST "Guansembles" and show they differ from restraint stress-activated cells. Guanfacine produced inhibition of cAMP-dependent signaling in Guansembles, while chronic restraint stress increased cAMP-dependent signaling. Guanfacine both excited and inhibited aspects of Guansemble neuronal activity. Further, while some stressors produced overall reductions in Guansemble activity, active coping events during restraint stress and exposure to unexpected shocks were both associated with Guansemble recruitment. Using viral tracing, we define a BNST Guansemble afferent network that includes regions involved in the interplay of stress and homeostatic functions. Finally, we show that activation of Guansembles produces alterations in behavior on the elevated plus maze consistent with task-specific anxiety-like behavior. Overall, we define a population of BNST neurons recruited by α2a-AR signaling that opposes the behavioral action of canonical autoreceptor α2a-AR populations and which are differentially recruited by distinct stressors. Moreover, we demonstrate stressor-specific physiological responses in a specific neuronal population.


Conflict of interest statement

The authors declare no competing interests.

Figures
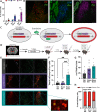
Fig. 1
Fig. 1. Guanfacine activates a heterogeneous cell population in the BNST.
A cFos colocalization with corticotrophin releasing factor (CRF), somatostatin (SOM), and protein kinase C delta (PKCδ, p < 0.0001) in the BNST following saline (n = 2–4) or guanfacine (n = 3–7) injection. B Immunohistochemistry results showing cFos colocalization with cell markers including corticotrophin (CRF), Somatostatin (SOM) and Protein Kinase C delta (PKCδ). C Schematic of tamoxifen-inducible activity-driven expression of Cre-dependent viruses in FosTRAP mouse model. D Experimental design to investigate reproducibility and specificity of Guansembles by comparing repeated exposure to guanfacine (guanfacine-guanfacine) or guanfacine- and saline-activated cells (saline-saline, guanfacine-saline). E Representative images of mCherry and cFos labeled cells in the BNST from saline-saline, guanfacine-saline, and guanfacine-guanfacine experimental groups. AC anterior commissure. F Quantification of cells colabeled with mCherry and cFos after saline-saline (n = 6, p = 0.0081), guanfacine-saline (n = 8, p = 0.0043), and guanfacine-guanfacine (n = 7) injections (Averaged left and right BNST of single section). G Total number of TRAPed (mCherry + ) calls in saline-saline (n = 6, p = 0.0081), guanfacine-saline (n = 8, p = 0.0043), and guanfacine-guanfacine (n = 7) injections. H Dual labeled cells as percentage of total mCherry cells after saline-saline (n = 6, p < 0.0001), guanfacine-saline (n = 8, p < 0.0001), and guanfacine-guanfacine (n = 7) injections. All error bars are mean ± SEM. Post-hoc p values derived from ordinary two-way ANOVA followed by Šídák’s multiple comparisons test (A, F) or ordinary one way ANOVA followed by Tukey’s multiple comparison test (E). *p < 0.05, **p < 0.01, ***p < 0.001, ****p < 0.0001. Statistical tests and results can be found in Table S1.
Fig. 2
Fig. 2. Guanfacine decreases PKA and increases calcium activity in BNST Guansembles.
A Experimental design and timeline for recording PKA activity in Guansembles in the BNST using FosTRAP. B Representative image of Guansembles in the BNST expressing FLIM-AKAR. C Decrease in PKA activity recorded in Guansembles following guanfacine injection (1 mg/kg, n = 6). D Quantification of average fluorescence lifetime of PKA sensor in Guansembles following guanfacine injection (p = 0.0459, n = 6). E Experimental design and timeline for recording calcium activity in Guansembles in the BNST using FosTRAP. F Representative trace of calcium transients in Guansembles following guanfacine injection. G Representative image of FLEX-GCaMP7f expression in Guansembles in the BNST. H Average Z-scores (p = 0.0002) and peaks per minute (p = 0.2996) in BNST Guansembles following guanfacine injection (1 mg/kg, n = 16). I Average Z-score and peaks per minute recorded in Guansembles following saline injection (n = 4, p = 0.0221). J Average Z-score and peaks per minute recorded in Guansembles following novel object exposure (n = 8, p < 0.0001). All error bars are mean ± SEM. Post-hoc p-values derived from two-tailed paired t-test (D, H, I, J). *p < 0.05, **p < 0.01, ***p < 0.001, ****p < 0.0001.
Fig. 3
Fig. 3. Guansemble neuronal activity filtered by stress exposure.
A Experimental design and timeline for recording calcium activity in Guansembles using FosTRAP. B Average Z-score and peaks per minute recorded in Guansembles during repeated restraint stress (day 1: n = 16, p = 0.0004 day 2: n = 12, p = 0.0126, day 3: n = 8, day 4: n = 8). C Calculated fold change in Z-score and peaks per minute across repeated days of restraint stress (day 1: n = 8, day 2: n = 8, p = 0.0034, day 3: n = 8, p = 0.0217, day 4: n = 8, p = 0.0005). D Combined average calcium activity before and during whole body bouts across 4 days of repeated restraint stress (day 1: n = 16, p = 0.0031, day 2: n = 12, day 3: n = 8, day 4: n = 8). E Calcium activity time locked to the onset of whole body struggling bouts on first (n = 16), second (n = 12), third (n = 8) and fourth day (n = 8) of repeated restraint stress. F Experimental design to investigate the overlap between guanfacine- and stress-activated neurons in the BNST. G Representative image of guanfacine- and stress-activated neurons in the BNST. H Quantification of cells activated by guanfacine, restraint, or both (n = 6) (p = 0.0034, p = 0.0324; and p < 0.0001). I Experimental design and timeline for recording PKA activity in Guansembles during restraint stress using FosTRAP. J Individual curves showing change in fluorescence of PKA activity over 3 days of repeated restraint stress (day1–2: n = 6, day 3: n = 4). K Average fluorescence lifetime calculated over 3 days of restraint stress (day1–2: n = 6, day 3: n = 4 p = 0.0209). L Experimental design and timeline for recording calcium activity in Guansembles during exposure to unpredictable foot shocks using FosTRAP. M Combined average changes in calcium activity before and after foot shock (n = 6, p = 0.00043). N Calcium activity timelocked to onset of foot shock on day 1 (n = 6) and day 2 (n = 6) of exposure. All error bars are mean ± SEM. Post-hoc p values derived from repeated measures one way ANOVA followed by Dunnett’s multiple comparison test (C), mixed-effects analysis followed by Šídák’s multiple comparisons test (B, D), ordinary one-way ANOVA followed by Tukey’s multiple comparison test (H, K), or two way repeated measures ANOVA followed by Šídák’s multiple comparisons test (M). *p < 0.05, **p < 0.01, ***p < 0.001, ****p < 0.0001.
Fig. 4
Fig. 4. Guanfacine leads to an overall increase in ex vivo calcium activity in Guansembles.
A Experimental design and timeline for ex vivo imaging followed by CNMF-E analysis in FosTRAP2. B Time course of spikes per minute for aCSF and guanfacine wash on (aCSF: n = 467 neurons, Guan: n = 431 neurons; N = 5 mice). C Calculated change in spikes per minute compared to baseline for aCSF and guanfacine wash on (p < 0.0001). D Heat map showing change in spikes per minute of individual cell response to aCSF or 10 μm guanfacine. Each horizontal line corresponds to the response of an individual cell across recording. E Pie charts showing representative number of cells that increased by 20%, decreased by 20% or did not change their calcium activity during wash on of aCSF or guanfacine. All error bars and shading (B) are mean ± SEM. Post-hoc p-values were derived from a two-way ANOVA followed by Šídák’s multiple comparison test (C). *p < 0.05, **p < 0.01, ***p < 0.001, ****p < 0.0001.
Fig. 5
Fig. 5. Anatomical and functional characterization of BNST Guansembles.
A Experimental design of rabies injection and SHIELD clearing to investigate the afferent inputs onto Guansembles in the BNST using FosTRAP. B Light sheet image showing BNST injection site verification. C Individual neurons image showing fine detail of light sheet microscopy. D Sagittal view of light sheet image of whole cleared brain. E Transverse view of light sheet image of whole cleared brain. F Plot showing total cell count of top regions from cell registration of saline- and guanfacine- TRAPed brains (saline: n = 4, guanfacine: n = 8). G Experimental design and timeline of optogenetic activation of Guansembles in FosTRAP2. H Representative image of Channelrhodopsin (ChR2) or eYFP expression in FosTRAP2. I Optogenetic validation of ChR2 activity in Guansemble cell responding to blue light. J Effects of optogenetic stimulation of Guansembles on elevated plus maze (eYFP: n = 4, ChR2: n = 7, p = 0.0044 and p = 0.0314). All error bars are mean ± SEM. Post-hoc p-values are derived from two-way ANOVA followed by Šídák’s multiple comparisons test or unpaired t-test (J). *p < 0.05, **p < 0.01, ***p < 0.001, ****p < 0.0001.

References

    1. Buffalari DM, Baldwin CK, See RE. Treatment of cocaine withdrawal anxiety with guanfacine: relationships to cocaine intake and reinstatement of cocaine seeking in rats. Psychopharmacol (Berl) 2012;223:179–90. doi: 10.1007/s00213-012-2705-1. - DOI - PubMed
    1. Gowing L, Farrell M, Ali R & White JM. Alpha2 adrenergic agonists for the management of opioid withdrawal. in Cochrane Database of Systematic Reviews (ed. The Cochrane Collaboration) CD002024.pub2 (John Wiley & Sons, Ltd, 2004). 10.1002/14651858.CD002024.pub2. - PubMed
    1. Simpson TL, et al. A pilot trial of prazosin, an alpha-1 adrenergic antagonist, for comorbid alcohol dependence and posttraumatic stress disorder. Alcohol Clin Exp Res. 2015;39:808–17. doi: 10.1111/acer.12703. - DOI - PMC - PubMed
    1. Simpson TL, et al. Double-blind randomized clinical trial of prazosin for alcohol use disorder. Am J Psychiatry. 2018;175:1216–24. doi: 10.1176/appi.ajp.2018.17080913. - DOI - PMC - PubMed
    1. Pergolizzi JV, Annabi H, Gharibo C, LeQuang JA. The role of lofexidine in management of opioid withdrawal. Pain Ther. 2019;8:67–78. doi: 10.1007/s40122-018-0108-7. - DOI - PMC - PubMed

Publication types