. 2022 Sep 9;13(1):5320.
doi: 10.1038/s41467-022-32553-0.

Inhibition of the Niemann-Pick C1 protein is a conserved feature of multiple strains of pathogenic mycobacteria

Affiliations

Inhibition of the Niemann-Pick C1 protein is a conserved feature of multiple strains of pathogenic mycobacteria

Yuzhe Weng et al. Nat Commun. .

Abstract

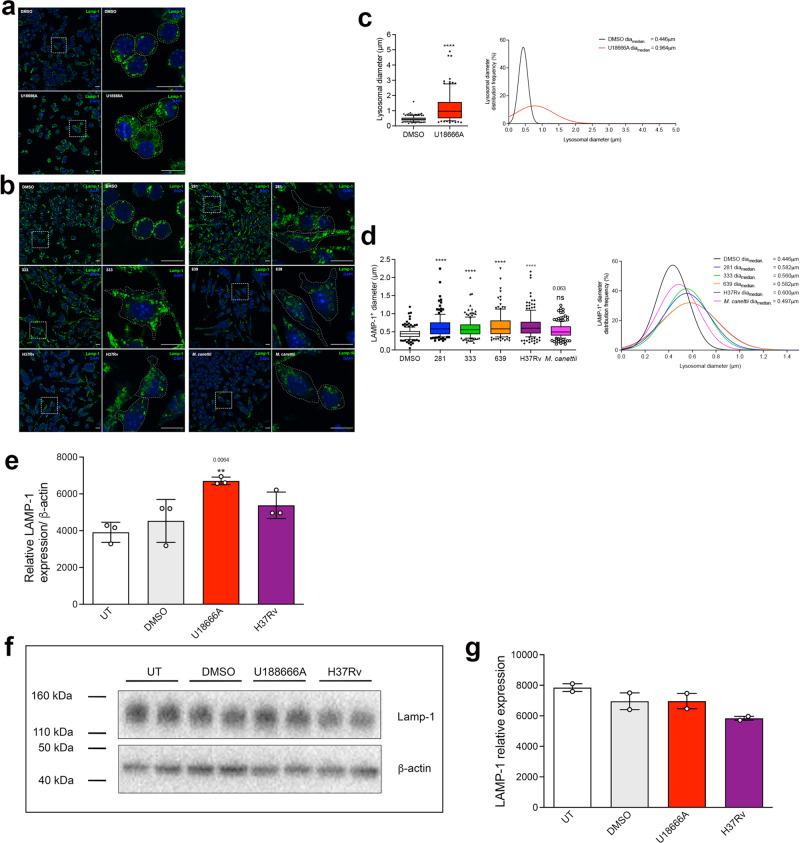
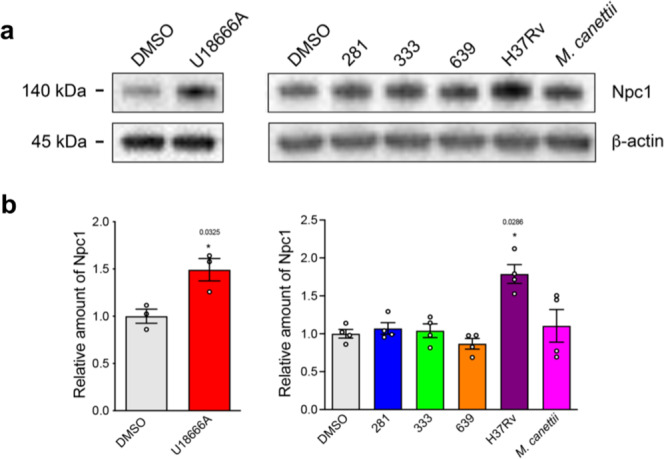
Mycobacterium tuberculosis (Mtb) survives and replicates within host macrophages (MΦ) and subverts multiple antimicrobial defense mechanisms. Previously, we reported that lipids shed by pathogenic mycobacteria inhibit NPC1, the lysosomal membrane protein deficient in the lysosomal storage disorder Niemann-Pick disease type C (NPC). Inhibition of NPC1 leads to a drop in lysosomal calcium levels, blocking phagosome-lysosome fusion leading to mycobacterial survival. We speculated that the production of specific cell wall lipid(s) that inhibit NPC1 could have been a critical step in the evolution of pathogenicity. We therefore investigated whether lipid extracts from clinical Mtb strains from multiple Mtb lineages, Mtb complex (MTBC) members and non-tubercular mycobacteria (NTM) inhibit the NPC pathway. We report that inhibition of the NPC pathway was present in all clinical isolates from Mtb lineages 1, 2, 3 and 4, Mycobacterium bovis and the NTM, Mycobacterium abscessus and Mycobacterium avium. However, lipid extract from Mycobacterium canettii, which is considered to resemble the common ancestor of the MTBC did not inhibit the NPC1 pathway. We conclude that the evolution of NPC1 inhibitory mycobacterial cell wall lipids evolved early and post divergence from Mycobacterium canettii-related mycobacteria and that this activity contributes significantly to the promotion of disease.


Conflict of interest statement

F.M.P. is a consultant to and co-founder of IntraBio. The other authors declare no competing interests.

Figures

Fig. 1
Fig. 1. Mycobacterial lipids that can significantly increase LysoTracker™ staining of RAW 264.7 MΦ are widely distributed across Mtb clinical strains, members of the Mtb complex (MTBC) and non-tuberculous mycobacteria.
a LysoTracker™ staining intensity of RAW 264.7 MΦ treated with 100 μg/ml lipid extract of clinical Mtb strains representative of Mtb lineages, 1, 2, and 4, Mtb complex species and non-tuberculous mycobacteria for 48 h. Data are mean ± SEM, N = minimum of 2 replicates per sample. Statistical analysis, 1-way ANOVA, ****p <0.0001, other significance values as indicated. Data are representative of three independent experiments. b Mean LysoTracker™ staining intensity of RAW 264.7 MΦ treated with lipid from Mtb lineages, 1, 2, and 4. Data are mean ± SEM, N = 5–7 strains tested per lineage. Statistical analysis, 1-way ANOVA, ****p < 0.0001, other p values as indicated. Data are representative of three independent experiments. c LysoTracker™ staining of RAW 264.7 MΦ treated with 200 μg/ml lipid extract of clinical Mtb strains from lineages 1, 2, 3, and 4 and M. canettii. Data are mean ± SEM, N = minimum of 3 replicates per sample. Statistical analysis, 1-way ANOVA, ****p < 0.0001, other p values as indicated. Data are representative of two independent experiments. Source data are provided as a Source data file.
Fig. 2
Fig. 2. Expansion of the lysosomal compartment in RAW 264.7 MΦ in response to treatment with mycobacterial lipid (100 μg/ml for 48 h) visualized with LysoTracker™-Red staining.
a Representative confocal microscopy images of RAW 264.7 MΦ either untreated, DMSO or U18666A treated or incubated with lipid extracts of Mtb clinical strains 281, 333, 639 or H37Rv or M. canettii stained with LysoTracker™-Red. The right image of each pair is a higher magnification of the region indicated in the left image. Nucleus is stained with Hoechst 33342 (blue). Scale bar represents 10 μm. Exposure times for all images was equivalent, except for DMSO indicated as a longer exposure. b Quantification of lysosome frequency per cell in vehicle or U18666A (left histogram) or DMSO and Mtb lipid or M. canettii lipid treated cells (right histogram). Data are means ± SEM, N = 4 replicates per sample comprising a minimum of 50 cells per random field. Statistical analysis, unpaired t test with Welch’s correction for DMSO and U18666A, two-tailed; 1-way ANOVA with Dunnett test, F = 1.945 for DMSO or lipid treated. ****p < 0.0001, other p values as indicated. Data are representative of two independent experiments. c Box-and-whisker plot of lysosome diameters (μm) and statistical distribution of lysosome diameters in vehicle or U18666A treated RAW 264.7 MΦ. Left histogram, data are means ± SEM, N = minimum of 100 lysosomes within four random fields. DMSO: min: 0.149 μm, max: 0.709 μm, center: 0.377 μm; U18666A: min: 0.216 μm, max:1.791 μm, center: 0.793 μm. Box contains 90% of all events. Statistical analysis, unpaired t test with Welch’s correction, two-tailed. ****p < 0.0001. Statistical distribution values indicated are median diameter (μm). d Box-and-whisker plot of lysosome diameter (μm) and statistical distribution of lysosome diameters in DMSO or lipid treated RAW 264.7 MΦ. Data are means ± SEM, N = minimum of 100 lysosomes within four random fields. DMSO: min: 0.149 μm, max: 0.709 μm, center: 0.377 μm; 281: min: 0.081 μm, max: 0.941 μm, center: 0.470 μm; 333: min: 0.204 μμm, max: 0.975 μm, center: 0.456 μm; 639: min: 0.161 μm, max: 1.124 μm, center: 0.436 μm; H37Rv: min: 0.180 μm, max: 1.052 μm, center: 0.456 μm; M. canettii: min: 0.149 μm, max: 1.047 μm, center: 0.383 μm. Box contains 90% of all events. Statistical analysis, 1-way ANOVA with Kruskal–Wallis test, Kruskal–Wallis statistics: 79.61. ****p < 0.0001, other p values as indicated. Statistical distribution values indicated are median diameter (μm). Data are representative of two independent experiments. Source data are provided as a Source data file.
Fig. 3
Fig. 3. Expansion of the lysosomal compartment in RAW 264.7 MΦ in response to treatment with mycobacterial lipid (100 μg/ml for 48 h) visualized with anti-LAMP-1 staining.
a Confocal microscopy images of RAW 264.7 MΦ treated with vehicle or U18666A and stained with anti-LAMP-1 antibody (green). b Images of RAW 264.7 MΦ treated with DMSO or Mtb lipids or M. canettii lipid. The right image for each pair is a higher magnification of the region indicated in the left image. Nucleus is stained with DAPI (blue). Scale bar represents 10 μm. c Box-and-whisker plot of LAMP-1 positive compartment diameters (μm) and statistical distribution of LAMP-1 positive compartment diameters in vehicle or U18666A treated RAW 264.7 MΦ. Left histogram, data are means ± SEM, N = minimum of 100 lysosomes within four random fields. DMSO: min: 0.051 μm, max: 1.190 μm, center: 0.446 μm; U18666A: min: 0.216 μm, max:4.894 μm, center: 0.964 μm. Box contains 90% of all events. Statistical analysis, Mann-Whitney test, two-tailed, ****p < 0.0001. Indicated statistical distribution, values are median diameter (μm). d Box-and-whisker plot of LAMP-1 positive compartment diameters (μm) and statistical distribution of LAMP-1 positive compartment diameters in DMSO or lipid treated RAW 264.7 MΦ. Data are means ± SEM, N = minimum of 100 lysosomes within four random fields. DMSO: min: 0.051 μm, max: 1.190 μm, center: 0.446 μm; 281: min: 0.255 μm, max: 2.243 μm, center: 0.582 μm; 333: min: 0.204 μm, max: 2.000 μm, center: 0.560 μm; 639: min: 0.253 μm, max: 2.247 μm, center: 0.582 μm; H37Rv: min: 0.180 μm, max: 2.166 μm, center: 0.600 μm; M. canettii: min: 0.161 μm, max: 1.232 μm, center: 0.497 μm. Box contains 90% of all events. Statistical analysis, 1-way ANOVA with Kruskal–Wallis test, Kruskal–Wallis statistics: 87.02. ****p < 0.0001. MΦ statistical distribution, values indicated are median diameter (μm). Data are representative of two independent experiments. e Q-PCR of relative LAMP-1 transcript expression in RAW 264.7 MΦ, normalized to β-actin. Data are mean ± SEM, N = 5 replicates per sample. Statistical analysis, t test with Welch’s correction, two tailed; and Mann–Whitney test, two-tailed. significance value as indicated. f Left, Western blot of LAMP-1 and β-actin protein expression in untreated, vehicle, U18666A and H37Rv lipid treated RAW 264.7 MΦ. g Quantification of LAMP-1 protein expression relative to β-actin Data are mean ± SEM, N = 2 replicates per sample. Statistical analysis, t test with Welch’s correction No statistically significant differences, two-tailed. Data shown are representative of two independent experiments. Source data are provided as a Source data file.
Fig. 4
Fig. 4. Exposure to lipid extract of strain H37Rv significantly increases the expression of NPC1 in RAW 264.7 MΦ.
a Western blot of protein lysates of RAW 264.7 MΦ that had been incubated with vehicle or mycobacterial lipid extracts for 48 h. Upper band, blot probed for Npc1 and lower band, blot re-probed for β-actin. b Quantification of Npc1 protein bands normalized to β-actin, relative to vehicle treatment. Data are mean ± SEM, N = 2 or 3. Statistical analysis, t test with Welch’s correction, two-tailed. p values as indicated, otherwise not significant. The blot is representative of three independent experiments. Source data are provided as a Source data file.
Fig. 5
Fig. 5. Mtb lipids induce a partial redistribution of cholesterol to intracellular puncta in RAW 264.7 MΦ.
a Confocal microscopy images of vehicle (DMSO) or U18666A treated RAW 264.7 MΦ stained with filipin. For each pair, the right image is a higher magnification of the region outlined in the left image. Scale bar represents 5 μm. b Quantitation of the frequency of vehicle or U18666A treated cells with filipin positive intracellular puncta. Data are mean ± SEM, N = 3, each representing a minimum of 100 cells in randomly selected fields. Statistical analysis, unpaired t test with Welch’s correction, two-tailed. ****p < 0.0001. c Confocal microscopy images of RAW 264.7 MΦ treated with vehicle (DMSO), Mtb strains or M. canettii lipids stained with filipin. For each pair, the right image is a higher magnification of the region outlined in the left image. Scale bar represents 5 μm. d Quantitation of the frequency of DMSO, Mtb lipids, or M. canettii lipid treated cells with filipin positive intracellular puncta. Data are mean ± SEM, N = 3, each representing a minimum of 100 cells in randomly selected fields. Statistical analysis, unpaired t test with Welch’s correction, two-tailed. p values as indicated. e Amplex red quantitation of cholesterol content of RAW 264.7 MΦ treated with vehicle (DMSO) or U18666A. Data are mean ± SEM, N = 3 replicates per sample. Statistical analysis, unpaired t test with Welch’s correction, two-tailed. Significance value as indicated. f Amplex red quantitation of cholesterol content of RAW 264.7 MΦ treated with vehicle (DMSO) or mycobacterial lipids. Data are mean ± SEM, N = 5. Statistical analysis, unpaired t test with Welch’s correction, two-tailed. No statistically significant differences. Data are representative of three independent experiments. Source data are provided as a Source data file.
Fig. 6
Fig. 6. Mtb lipids affect GM1 trafficking in RAW 264.7 MΦ.
a Confocal microscopy images of RAW 264.7 MΦ treated with vehicle (DMSO), U18666A, or mycobacterial lipids and pulse-chased with cholera toxin B subunit (green). Nucleus is stained with DAPI (blue). For each pair, right image is a higher magnification of the region outlined in the left image. Untreated, vehicle and M. canettii lipid treated cells show a predominantly Golgi pattern of staining, indicated by the white arrows. U18666A and lipids from Mtb strains induce a punctate pattern, consistent with lysosomal distribution (white arrowheads). Scale bar represents 10 μm. b Percentage of vehicle and U18666A treated cells with lysosomal cholera toxin B localization. Data are mean ± SEM, N = 3, each representing a minimum of 100 cells in randomly selected fields. Statistical analysis, unpaired t test with Welch’s correction, two-tailed. ****p < 0.0001. c Percentage of the vehicle and mycobacterial lipid-treated cells with lysosomal cholera toxin B localization. Data are mean ± SEM, N = 3, each representing a minimum of 100 cells in randomly selected fields per sample. Statistical analysis, unpaired t test with Welch’s correction, two-tailed. ****p < 0.0001, other p values as indicated. Data are representative of two independent experiments. Source data are provided as a Source data file.
Fig. 7
Fig. 7. Mtb lipids, but not M. canettii lipids cause GSL accumulation in RAW 264.7 MΦ.
a Representative HPLC trace of GSLs from vehicle (DMSO) and U18666A treated cells are overlaid with individual GSL peaks annotated. The table summarizes the percent area of each peak and the fold increase induced by U18666A. b Quantitation of total GSLs in DMSO or U18666A treated cells. Data are mean ± SEM, N = replicates per sample. Statistical analysis, unpaired t test with Welch’s correction, two-tailed. ***p < 0.0007. c Overlays of representative HPLC traces of extracts of RAW 264.7 cells treated with vehicle (DMSO) and lipid extracts of Mtb strains or M. canettii. d Quantitation of individual GSL species and total GSLs in DMSO or mycobacterial lipid treated cells. Data are mean ± SEM, N = 4–5 replicates per sample. Statistical analysis, unpaired t test with Welch’s correction, two-tailed ****p < 0.0001, other p values as indicated. Source data are provided as a Source data file.

References

    1. Gagneux S. Ecology and evolution of Mycobacterium tuberculosis. Nat. Rev. Microbiol. 2018;16:202–213. doi: 10.1038/nrmicro.2018.8. - DOI - PubMed
    1. Frieden TR, Sterling TR, Munsiff SS, Watt CJ, Dye C. Tuberculosis. Lancet. 2003;362:887–899. doi: 10.1016/S0140-6736(03)14333-4. - DOI - PubMed
    1. Cambier CJ, Falkow S, Ramakrishnan L. Host evasion and exploitation schemes of Mycobacterium tuberculosis. Cell. 2014;159:1497–1509. doi: 10.1016/j.cell.2014.11.024. - DOI - PubMed
    1. Stewart GR, Robertson BD, Young DB. Tuberculosis: a problem with persistence. Nat. Rev. Microbiol. 2003;1:97–105. doi: 10.1038/nrmicro749. - DOI - PubMed
    1. Russell DG, Cardona PJ, Kim MJ, Allain S, Altare F. Foamy macrophages and the progression of the human tuberculosis granuloma. Nat. Immunol. 2009;10:943–948. doi: 10.1038/ni.1781. - DOI - PMC - PubMed

Publication types

Supplementary concepts

LinkOut - more resources