. 2022 Sep 9;13(1):5312.
doi: 10.1038/s41467-022-32738-7.

In vivo tumor immune microenvironment phenotypes correlate with inflammation and vasculature to predict immunotherapy response

Affiliations

In vivo tumor immune microenvironment phenotypes correlate with inflammation and vasculature to predict immunotherapy response

Aditi Sahu et al. Nat Commun. .

Abstract

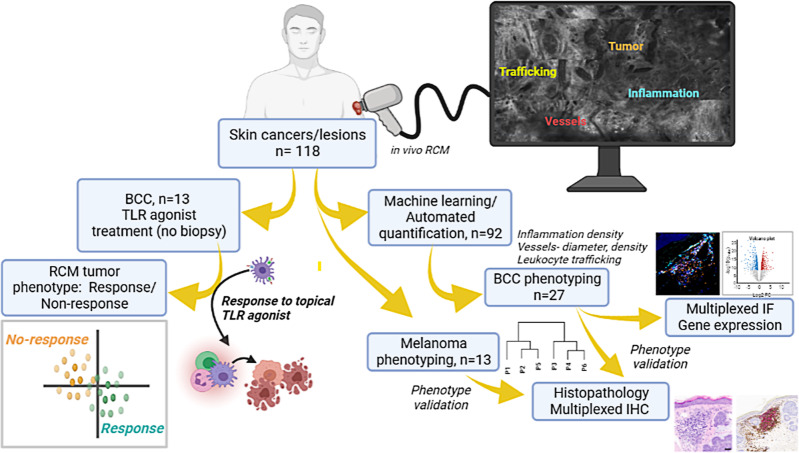
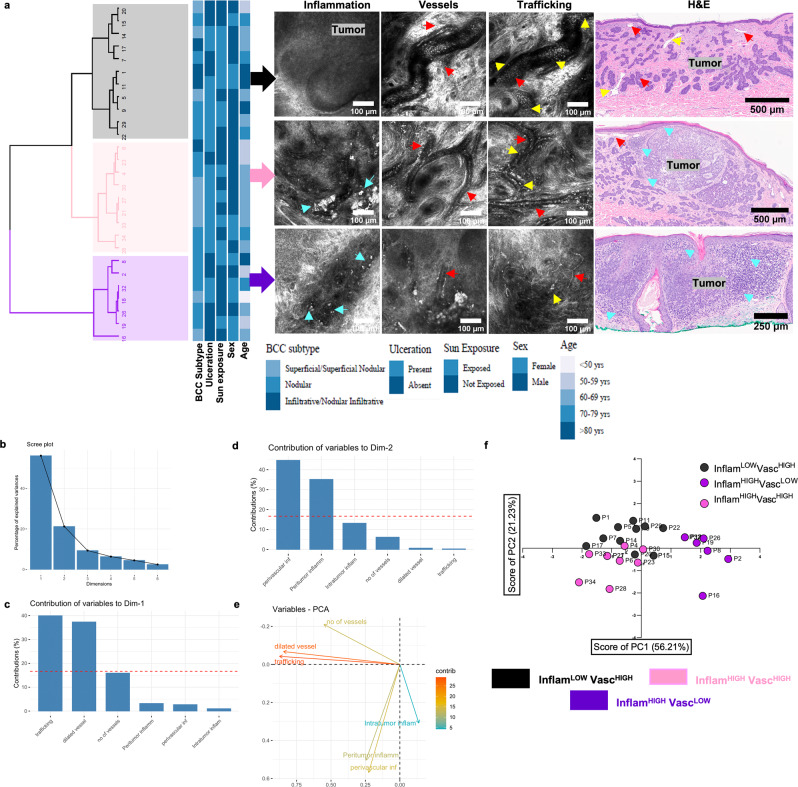
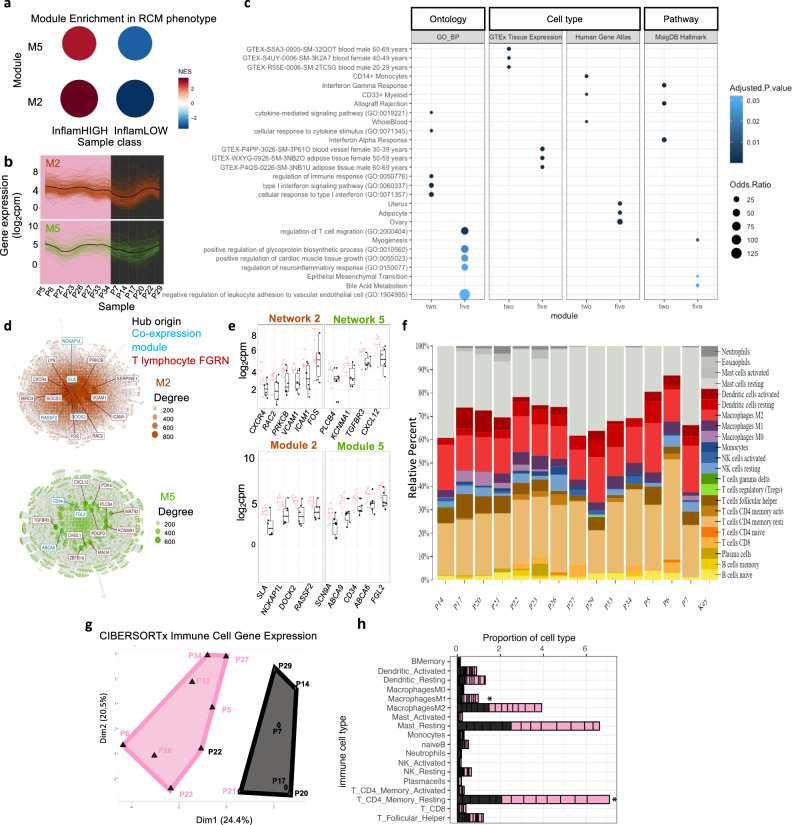
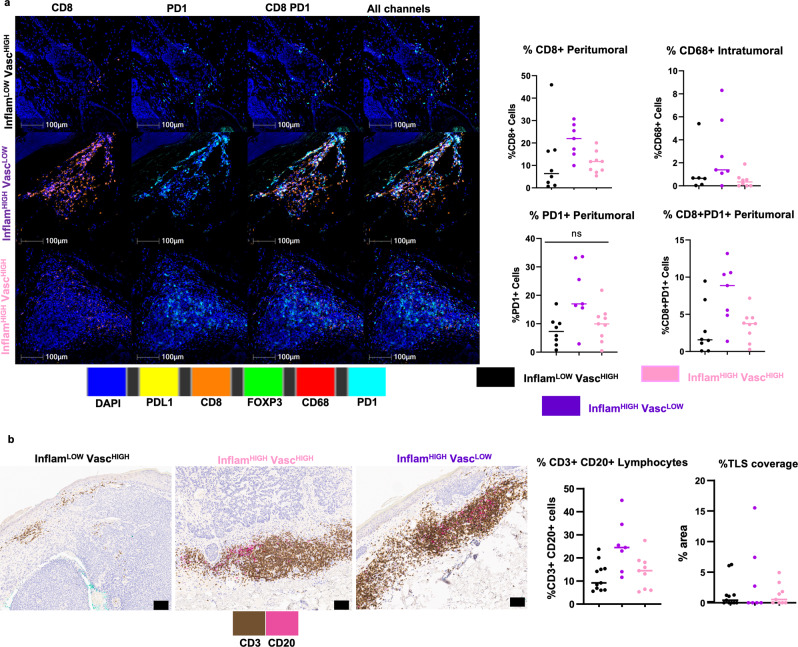
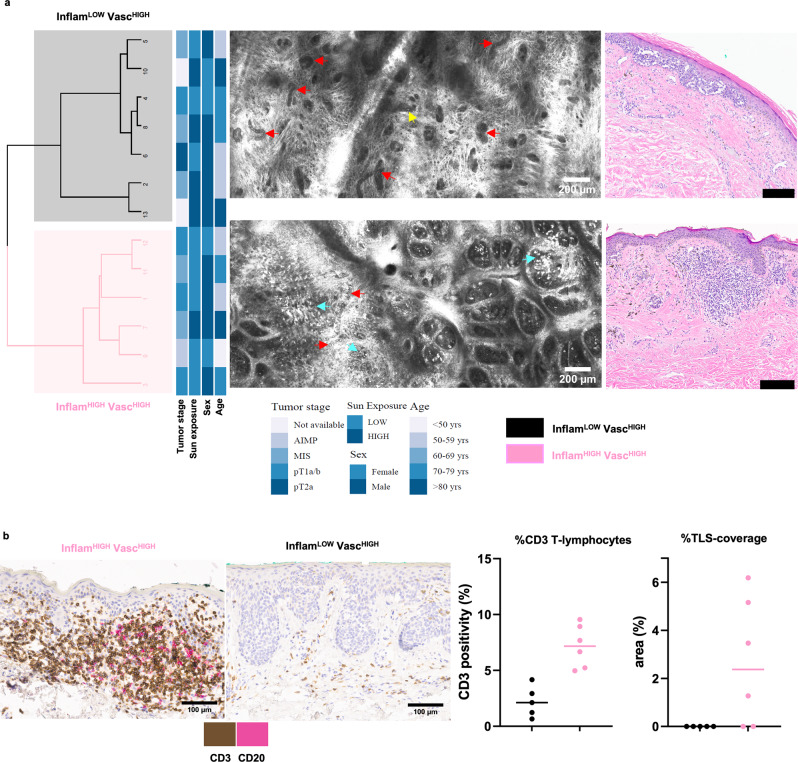
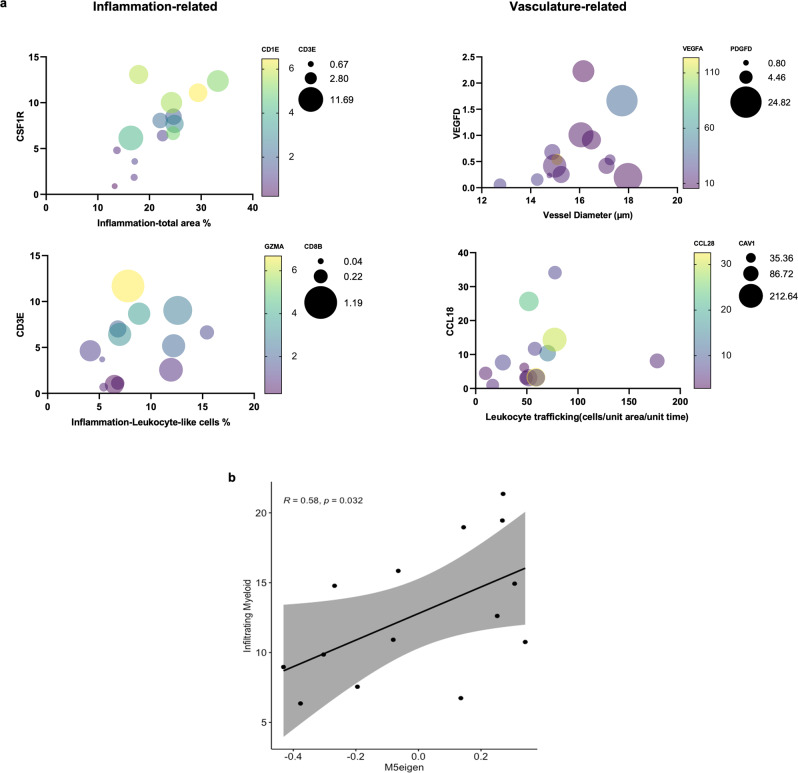
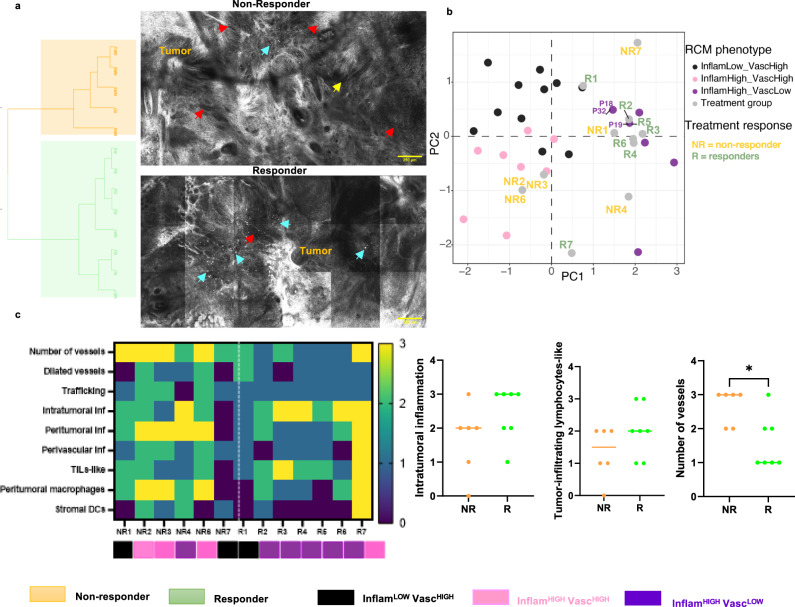
Response to immunotherapies can be variable and unpredictable. Pathology-based phenotyping of tumors into 'hot' and 'cold' is static, relying solely on T-cell infiltration in single-time single-site biopsies, resulting in suboptimal treatment response prediction. Dynamic vascular events (tumor angiogenesis, leukocyte trafficking) within tumor immune microenvironment (TiME) also influence anti-tumor immunity and treatment response. Here, we report dynamic cellular-level TiME phenotyping in vivo that combines inflammation profiles with vascular features through non-invasive reflectance confocal microscopic imaging. In skin cancer patients, we demonstrate three main TiME phenotypes that correlate with gene and protein expression, and response to toll-like receptor agonist immune-therapy. Notably, phenotypes with high inflammation associate with immunostimulatory signatures and those with high vasculature with angiogenic and endothelial anergy signatures. Moreover, phenotypes with high inflammation and low vasculature demonstrate the best treatment response. This non-invasive in vivo phenotyping approach integrating dynamic vasculature with inflammation serves as a reliable predictor of response to topical immune-therapy in patients.


Conflict of interest statement

M.G. is a consulting investigator for DBV technologies; research consultant: Dermatology Service, MSKCC. Christi Alessi-Fox: employee of and owns equity in Caliber I.D., manufacturer of the VivaScope RCM. Dr. Rossi: Mavig (travel accommodation), Merz, DynaMed, Canfield Scientific, Evolus, Biofrontera, QuantiaMD, Lam Therapeutics, Cutera (consultant); Allergan (advisory board). A.H. : consultant to Canfield Scientific and an advisory board member of Scibase. L.D. : cofounder and holds equity in IMVAQ Therapeutics, patents on applications related to work on oncolytic viral therapy (US 20220056475 A1: recombinant poxviruses for cancer immunotherapy; US 20180236062 A1: use of inactivated nonreplicating modified vaccinia virus ankara (mva) as monoimmunotherapy or in combination with immume checkpoint blocking agents for solid tumors). A. M.: honorarium for dermoscopy lectures (3GEN), royalties for books/book chapters, dermoscopy equipment for testing, payment for organizing and lecturing (American Dermoscopy Meeting). C-S.J.C. : research funding from Apollo Medical Optics, Inc. Milind Rajadhyaksha: was employee of and owns equity in Caliber I.D. VivaScope is the commercial version of a laboratory prototype he developed at Massachusetts General Hospital, Harvard Medical School. T.M. has acted as a consultant for Immunogenesis, Immunos Therapeutics, Daiichi Sankyo, Leap therapeutics and Pfizer, has received research support from Adaptive Biotechnologies, Aprea, Bristol Myers Squibb, Infinity Pharmaceuticals, Kyn Therapeutics, Leap Therapeutics, Peregrine Pharmaceuticals and Surface Oncology, is a cofounder of and holds an equity in IMVAQ Therapeutics and is listed as a co-inventor on patents relating to the use of oncolytic viral therapy, alphavirus-based vaccines, antibodies targeting CD40, GITR, OX40, PD-1 and CTLA-4 and neo-antigen modelling (US 20220056475 A1: recombinant poxviruses for cancer immunotherapy; US 20210179714 A1: Inhibition of CTLA-4 and/or PD-1 For Regulation of T Cells; US 20200232040 A1: neoantigens and uses thereof for treating cancer; US 20200113984 A1: Alphavirus Replicon Particles Expressing TRP2; US 20180236062 A1: use of inactivated nonreplicating modified vaccinia virus ankara (mva) as monoimmunotherapy or in combination with immume checkpoint blocking agents for solid tumors). The remaining authors declare no competing interests.

Figures

Fig. 1
Fig. 1. TiME phenotypes were derived from RCM imaging and correlated with underlying biology and treatment response to topical toll-like receptor agonist (TLRA) imiquimod.
In vivo RCM imaging was performed on patients with clinically suspected skin cancers or rashes visiting the Dermatology Service at MSKCC. Imaging on the lesion was performed to span large field-of-view (FOV) for exhaustive sampling in tumor, peritumoral and adjacent normal areas. Tumor, inflammation, vasculature and trafficking were imaged within each lesion. Data was used for machine learning and automated quantification of inflammation density, vessel diameter and density, and frequency of leukocyte trafficking. RCM-TiME phenotypes were investigated using unsupervised analysis for basal cell carcinoma (BCC), and melanoma cohorts. The RCM phenotypes were correlated with pathology and dual immunohistochemistry (IHC) for CD3+ (T-cell) and CD20+ (B-cell) labeling of tertiary lymphoid structures. BCC phenotyping was additionally validated using multiplexed immunofluorescence (CD8+, FOXP3, CD68+, PD-1+, PD-L1+) and bulk RNA sequencing. A subset of patients with confirmed BCC diagnoses on RCM undergoing treatment with a TLRA agonist were enrolled. The patients were imaged 6 months after end of treatment to confirm tumor clearance and were classified as responders (complete tumor regression) or non-responders (incomplete or no tumor regression). Treatment response was correlated with TiME features and phenotypes. Created with www.Biorender.com RCM: reflectance confocal microscopy; BCC: basal cell carcinoma; IHC: immunohistochemistry; TLRA: toll-like receptor agonist.
Fig. 2
Fig. 2. Unsupervised clustering identifies three main RCM TiME phenotypes and assigns groups based on inflammation and vasculature.
a Unsupervised statistical clustering on major RCM features (inflammation, vasculature, trafficking) on n = 27 distinct BCCs yields 3 main phenotypes. No phenotypic association with any clinical features was observed. Representative RCM features within each phenotype and corresponding H&E are shown (cyan arrow-immune cells, yellow arrow- trafficking, red arrow-blood vessels, H&E scale bar- 500 μm). b Scree plot showing percentage contribution to variance for each PC. Top 2 PCs encompassing ~77% variance were used for elucidating phenotype nomenclature. c Vascular features- trafficking, dilated vessel and number of vessels- show predominant contribution in dimension 1 (PC1). d Inflammation features- perivascular, peritumor and intratumor inflammation mainly contribute to dimension 2 (PC2). e Contribution of variables to the PCs. f Scatter plot using contribution from PC1 and PC2 highlights 3 clusters in the principal component analysis (PCA). The phenotypes were assigned as InflamLOWVascHIGH (black), InflamHIGHVascLOW (purple) and InflamHIGHVascHIGH (pink) since PC1 classifies phenotypes based on vascular features while PC2 classified phenotypes on the basis of inflammation. RCM images were selected after reviewing images in the entire dataset. The selected images are the most representative based on PC contribution within each group. Source data are provided as a Source Data file. RCM reflectance confocal microscopy, PCA principal component analysis, PC principal components, BCC basal cell carcinoma.
Fig. 3
Fig. 3. Molecular signatures reveal inflammatory signatures predominantly correspond to InflamHIGH phenotype.
a Significant enrichment of gene modules in RCM phenotypes from n = 14 BCC lesions (M2 NES = 3.5, adj. p value = 0.00061; M5 NES = 2.9, adj.pvalue=0.00061). b Profile plots of genes in modules 2 and 5. Colored lines show expression levels for individual genes and the black line represents mean expression (log2cpm) of all genes in the module. Individual samples are displayed on x axis and colored by RCM phenotype (high-inflammatory= pink, low-inflammatory = black). c Gene ontology (GO) enrichment of biological processes (BP) along with genes associated with cell type specificity (GTEx Tissue Expression and Human Gene Atlas) and cellular pathways (MsigDB Hallmark) are shown for modules 2 and 5 (adj.pvalue < 0.05 with multiple testing correction using BH; top 5 terms for ontology and top 3 for cell type and pathways when applicable). d Gene networks of M2 and M5 in T-lymphocytes. Top 10 most connected genes (Hub) in network are labeled (interaction = red). Module hub genes identified in network are indicated in blue (co-expression). Nodes indicate genes (size is proportional to degree) and edges represent connections to genes in network. e Box plots for expression of network hub genes (top) and module hub genes (bottom). Individual points represent patient samples (pink = InflamHIGH, n = 8 biologically independent samples; black = InflamLOW, n = 6 biologically independent samples; differential expression was not significant at FDR < 0.05). Upper and lower whiskers extend from hinge to largest and smallest value no further than 1.5 * IQR. The lower and upper hinges correspond to 25th and 75th percentiles. Horizontal line represents median expression. f Relative proportions of the 22 immune cell types identified from CIBERSORTx in individual patients. g k-means clustering of transcript abundance in patient samples for genes assigned with immune cells deconvoluted from bulk RNA-seq with CIBERSORTx (n = 547 genes). h Relative proportions of individual immune cells in the InflamHIGH (pink) and InflamLOW (black) groups (individual patient samples indicated by black lines in bar chart) feature CD4+ memory T-cells (p-value = 0.001) and M1 macrophages (p-value=0.012) as significant determinants of differences across the 2 groups using unpaired two-tailed Mann-Whitney test. Source data are provided as a Source Data file.
Fig. 4
Fig. 4. Immunophenotyping through multiplexed staining correlates with RCM phenotypes.
a Representative images from multiplexed IF analysis (CD8+, FOXP3, CD68+, PD-1+ and PD-L1+) on n = 24 BCC specimens show presence of CD8+ T-cells, T-regs and macrophages in peritumoral infiltrates, along with PD-1 and PD-L1 expression in all three phenotypes: InflamLOWVascHIGH (black), InflamHIGHVascLOW (purple) and InflamHIGHVascHIGH (pink). Most abundant numbers of CD8+ cells (p-value= 0.031), PD1+ cells (p-value = 0.036), and highest fraction of CD8+ PD1+ cells (p-value= 0.030) was found in the InflamHIGHVascLOW phenotype, indicating an inflamed but exhausted phenotype. Distribution of CD68+ macrophages in intratumoral infiltrates was also highest in InflamHIGHVascLOW (p-value= 0.055). Data are presented as column scatter plots and median analyzed with Kruskal-Wallis test adjusted for multiple comparisons using Dunn’s method. In peritumor analysis, n = 8, n = 7, n = 9 biologically independent specimens were analyzed from InflamLOWVascHIGH, InflamHIGHVascLOW and InflamHIGHVascHIGH groups, respectively. In Intratumoral analysis, n = 6, n = 7, n = 8 biologically independent specimens were analyzed from InflamLOWVascHIGH, InflamHIGHVascLOW and InflamHIGHVascHIGH groups, respectively. b Dual IHC staining for tertiary lymphoid structures using CD3+ T-cells (brown) and CD20+ B-cells (pink) in n = 27 BCC specimens demonstrate abundance in the InflamHIGHVascLOW and lowest values in the InflamLOWVascHIGH groups (p-value = 0.039). No clear phenotypic association with TLS coverage was found (p-value = 0.988). Data are presented as column scatter plots and median and median analyzed with Kruskal–Wallis test adjusted for multiple comparisons using Dunn’s method. In this analysis, n = 11, n = 7, n = 9 biologically independent samples were analyzed from InflamLOWVascHIGH, InflamHIGHVascLOW and InflamHIGHVascHIGH groups, respectively. Source data are provided as a Source Data file. IF: immunofluorescence; IHC: immunohistochemistry.
Fig. 5
Fig. 5. Identical RCM TiME phenotypes in melanoma correlate with immune signatures.
a Unsupervised clustering of RCM features (inflammation, vasculature, trafficking) identifies two main phenotypes in melanoma lesions (n = 13) that are annotated as InflamHIGHVascHIGH and InflamLOWVascHIGH as shown in representative RCM and corresponding H&E images. (red arrows- vessels, cyan arrows- inflammation, yellow arrow-trafficking). b Dual IHC staining for tertiary lymphoid structures using CD3+ T-cells (brown) and CD20+ B-cells (pink) in melanoma specimens (n = 11) demonstrate higher abundance of CD3+ T-cells (p-value=0.004) and TLS (p-value =0.060) in the InflamHIGHVascHIGH group. Data are presented as column scatter plots and median analyzed with two-tailed unpaired Mann-Whitney test. In this analysis, n = 5 and n = 6 biologically independent samples were analyzed from InflamLOWVascHIGH and InflamHIGHVascHIGH groups, respectively. RCM images were selected after reviewing images in the entire dataset. The selected images are the most representative based on PC contribution within each group. Source data are provided as a Source Data file. RCM: reflectance confocal microscopy; IHC: immunohistochemistry.
Fig. 6
Fig. 6. Quantified RCM TiME features correlate with gene expression.
a Automated features correlated with corresponding gene expression in n = 14 BCC lesions shows moderate to high correlation between total inflammation area with CSF1R (r = 0.73, CI: 0.32 to 0.91, p-value = 0.002), CD1E (r = 0.64, CI: 0.15 to 0.87, p-value= 0.008) and CD3E (r = 0.51, CI:−0.04 to 0.82, p-value = 0.032) and between total leukocyte-like cells area with CD3E (r = 0.6, CI: −0.13 to 0.79, p-value = 0.013), CD8B (r = 0.6, CI: 0.1 to 0.86, p-value = 0.012) and GZMA (r = 0.53, CI: −0.01 to 0.83, p-value = 0.026). Similarly, vessel diameter and leukocyte trafficking were correlated with VEGFD (r = 0.459, CI: −0.1 to 0.80, p-value = 0.050), VEGFA (r = −0.477, CI: −0.81 to 0.09, p-value = 0.044), PDGFD (r = 0.538, CI: 0 to 0.84, p-value= 0.025), and trafficking with CCL18 (r = 0.561, CI: 0.019 to 0.84, p-value= 0.042), CAV-1 (r = 0.468, CI: −0.10 to 0.80, p-value= 0.046) and CCL28 (r = −0.42, CI: −.016 to 0.78, p-value= 0.137), respectively. Non-parametric two-tailed Spearman correlation was computed across each dataset. b Automated features correlated with gene co-expression modules show total myeloid cells on RCM (dendritic cells+macrophages) were significantly correlated with eigengene values for M5 module(Spearman method, p-values estimated using t-distributions). Confidence interval at 95% indicated in gray along with linear regression line and correlation coefficient (p-value = 0.032). Source data are provided as a Source Data file. CSF1R: colony stimulating factor 1-receptor; CD: cluster of differentiation; GZMA: granzyme A; VEGF: vascular endothelial growth factor; PDGFD: platelet derived growth factor D; CCL: CC-chemokine ligand; CAV: caveolin.
Fig. 7
Fig. 7. InflamHIGHVascLOW phenotype corresponds to highest response in TLRA treated patients.
a Unsupervised statistical clustering on n = 13 BCC lesions receiving TLRA treatment yields two major clusters of mainly non-responders (orange) and responders (green), attributed to the presence of differential TiME features shown in representative RCM images (red arrows- vessels, cyan arrows- inflammation, yellow arrow-trafficking). b TiME phenotyping of TLRA patients predicted by overlaying on the original BCC phenotype PCA plot (Fig. 2b) suggest that most responders (R) belonged to the InflamHIGHVascLOW group. c Comparison of major TiME features across responders (n = 7)and non-responders (n = 6) demonstrate inflammation features (intratumoral inflammation, TILs-like cells) are insufficient to stratify patients based on response. However, stromal vessels can differentiate between responders and non-responders (p-value= 0.035). Data are presented as column scatter plots and median analyzed using two-tailed Mann-Whitney test. RCM images were selected after reviewing images in the entire dataset. Selection was based on the features most prominently observed within each class. Source data are provided as a Source Data file. TLRA: toll-like receptor agonist, BCC: basal cell carcinoma, PCA: principal component analysis; TiME: tumor-immune microenvironment; RCM: reflectance confocal microscopy.

References

    1. Topalian SL, Drake CG, Pardoll DM. Immune checkpoint blockade: a common denominator approach to cancer therapy. Cancer Cell. 2015;27:450–461. doi: 10.1016/j.ccell.2015.03.001. - DOI - PMC - PubMed
    1. Wolchok JD, et al. Overall survival with combined nivolumab and ipilimumab in advanced melanoma. N. Engl. J. Med. 2017;377:1345–1356. doi: 10.1056/NEJMoa1709684. - DOI - PMC - PubMed
    1. Ribas A, Wolchok JD. Cancer immunotherapy using checkpoint blockade. Science. 2018;359:1350–1355. doi: 10.1126/science.aar4060. - DOI - PMC - PubMed
    1. Darvin P, Toor SM, Nair VS, Elkord E. Immune checkpoint inhibitors: recent progress and potential biomarkers. Exp. Mol. Med. 2018;50:1–11. doi: 10.1038/s12276-018-0191-1. - DOI - PMC - PubMed
    1. Friedman CF, Postow MA. Emerging tissue and blood-based biomarkers that may predict response to immune checkpoint inhibition. Curr. Oncol. Rep. 2016;18:21. doi: 10.1007/s11912-016-0509-x. - DOI - PMC - PubMed

Publication types

Substances