. 2022 Sep 9;13(1):5303.
doi: 10.1038/s41467-022-33027-z.

CtIP-dependent nascent RNA expression flanking DNA breaks guides the choice of DNA repair pathway

Affiliations

CtIP-dependent nascent RNA expression flanking DNA breaks guides the choice of DNA repair pathway

Daniel Gómez-Cabello et al. Nat Commun. .

Abstract

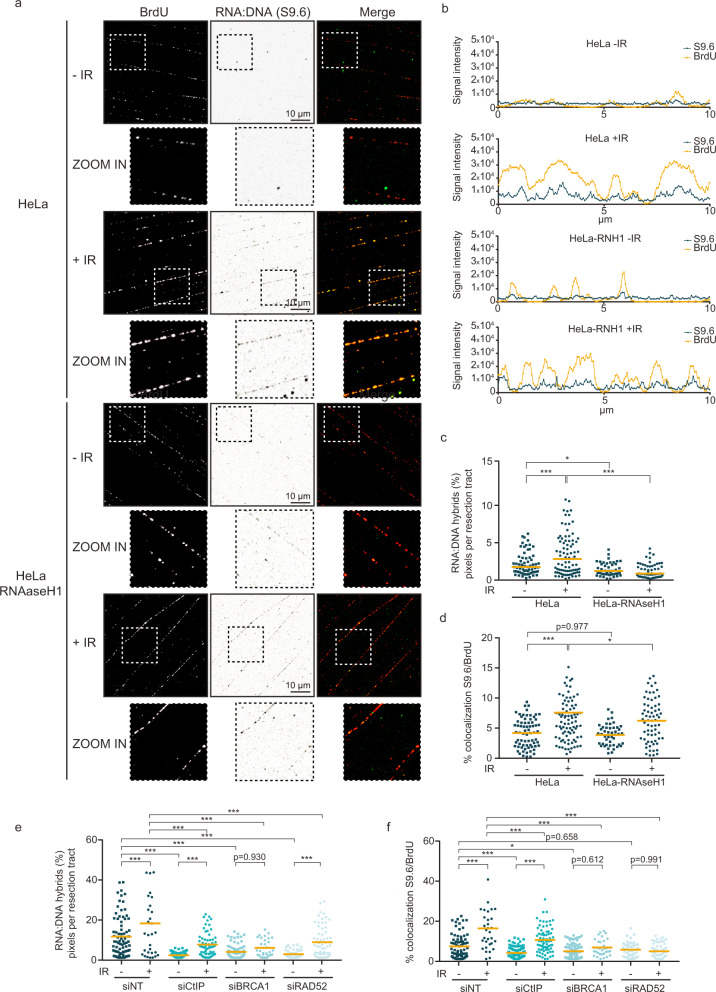
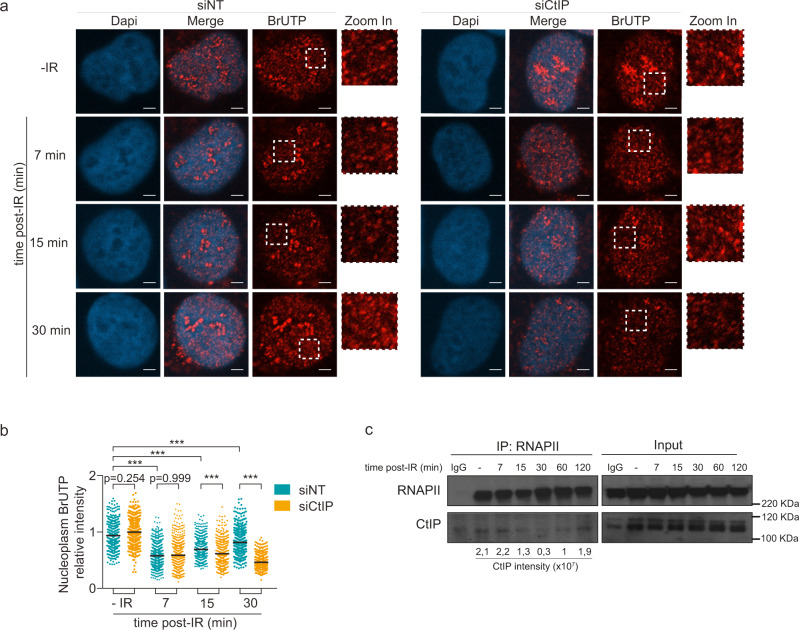
The RNA world is changing our views about sensing and resolution of DNA damage. Here, we develop single-molecule DNA/RNA analysis approaches to visualize how nascent RNA facilitates the repair of DNA double-strand breaks (DSBs). RNA polymerase II (RNAPII) is crucial for DSB resolution in human cells. DSB-flanking, RNAPII-generated nascent RNA forms RNA:DNA hybrids, guiding the upstream DNA repair steps towards favouring the error-free Homologous Recombination (HR) pathway over Non-Homologous End Joining. Specific RNAPII inhibitor, THZ1, impairs recruitment of essential HR proteins to DSBs, implicating nascent RNA in DNA end resection, initiation and execution of HR repair. We further propose that resection factor CtIP interacts with and helps re-activate RNAPII when paused by the RNA:DNA hybrids, collectively promoting faithful repair of chromosome breaks to maintain genomic integrity.


Conflict of interest statement

The authors declare no competing interests.

Figures

Fig. 1
Fig. 1. DNA resection (ssDNA) correlates with nascent RNA synthesis.
a Representative immunofluorescence images of EU, BrdU, PCNA and DAPI staining in U2OS cells depleted for the indicated DDR factors, irradiated with 5 Gy and stained upon 30-minute labeling with EU and BrdU that started immediately after IR exposure. Scale bar: 10 μm. b Graph shows nucleoplasm (non-nucleolar) EU intensity in different cell cycle phases in non- and irradiated-U2OS cells. EU component was added upon DNA damage using 5 Gy in irradiated cells and labeled for 30 min in both cellular conditions. c Graph shows EU intensity in different cell cycle phases in control U2OS cells irradiated and labeled for 30 min as in (a). d Graph shows intensity of BrdU staining under non-denaturing conditions to visualize stretches of ssDNA, as a DNA resection marker in cell cycle phases of U2OS cells irradiated (5 Gy). e Bar graph represents nucleoplasm (non-nucleolar) EU intensity in cells treated by siRNAs against indicated genes in non- and irradiated cells. EU component was added upon DNA damage using 5 Gy in irradiated U2OS cells and labeled for 30 min in both cellular conditions. Mean values and ± s.e.m are represented from at least 500 cells of 3 independent experiments. Irradiated samples comparison show **p = 0.0062 (siNT vs siCtIP), **p = 0.0018 (siNT vs siBRCA1) and ***p = 0.0001 (siNT vs siRAD52) using multiple comparison with Ordinary Two-Ways ANOVA. f Nascent RNA synthesis in U2OS cells depleted for the indicated DDR proteins, labeled with EU for 30 min starting after irradiation with 5 Gy. g Quantification of BrdU staining under non-denaturing conditions to mark ssDNA as a DNA resection marker in U2OS cells depleted for CtIP, BRCA1 and RAD52, respectively, and stained after 30 min BrdU labeling started after exposure to 5 Gy. Statistical data at (bd) and (f, g) showing mean data from 3 independent experiments. Bar plots show the median (center), 25–75 percentile (box), and 5–95 percentile (whisker) from at least 500 cells. P values were calculated using multiple comparison with Ordinary One-Way ANOVA. ***p < 0.001. Source data are provided as a Source data file.
Fig. 2
Fig. 2. Nascent RNAs colocalize with DNA resection tracts in irradiated HeLa cells.
a Schematic representation of the developed R-SMART technique. b Representative images of DNA resection tracts (black background) and nascent RNAs (white background) upon 5 Gy irradiation, using non-denaturing conditions for BrdU staining and EU labeling, respectively. n = 3 biologically independent experiments. Scale: 10 μm. c Representative quantification of fiber profiles for EU and BrdU intensities from non- and irradiated HeLa cells. n = 3 biologically independent experiments. d Dot graph shows percentage of BrdU and EU signal colocalization on resection tracts generated in non- and 5 Gy-irradiated HeLa and HeLa-RNAseH1 cells. At least n = 60 fields from 3 independent experiments were quantified. P values were calculated using multiple comparison with Ordinary One-Way ANOVA. ***p < 0.0001. Source data are provided as a Source data file.
Fig. 3
Fig. 3. DNA damage generates high frequency of RNA:DNA hybrids on resection tracts.
a Representative images showing ssDNA (resection tracts) and RNA:DNA hybrids upon non- and 5 Gy-irradiated HeLa cells: non-denaturing BrdU staining and S9.6 staining, respectively. n = 3 biologically independent experiments. Scale 10μM b Representative quantifications of fiber profiles for DNA resected track (BrdU) and RNA:DNA hybrids (S9.6) staining intensities from non- and irradiated HeLa and HeLa-RNAseH1 cells. c Dot graph shows percentages of RNA:DNA hybrids (S9.6) staining signal on resection tracts generated in non- and 5 Gy-irradiated HeLa and HeLa-RNAseH1 cells. P values were calculated using multiple comparison with Ordinary One-Way ANOVA. ***p = 0.0006 (HeLa −IR vs HeLa +IR), *p = 0.047 (HeLa −IR vs HeLa-RNAseH1 −IR) and ***p < 0.0001 (HeLa +IR vs HeLa-RNAseH1 +IR). d Dot graph shows mean of percentages of RNA:DNA hybrids (S9.6) and ssDNA (BrdU) signal colocalization on resection tracts generated in non- and 5 Gy-irradiated HeLa and HeLa-RNAseH1 cells. P values were calculated using multiple comparison with Ordinary One-Way ANOVA. *p = 0.044 (HeLa +IR vs HeLa-RNAseH1 +IR) and ***p < 0.0001 (HeLa −IR vs HeLa +IR). e HeLa cells transfected with siRNA against CtIP, BRCA1, RAD52, and NT (Non-Target) for 48 h, were assessed for RNA:DNA hybrids (S9.6) quantification by RL-SMART as in (c). P value were calculated using multiple comparison with Ordinary One-Way ANOVA. ***p < 0.001 f HeLa cells transfected with siRNA against CtIP, BRCA1, RAD52, and NT (Non-Target) for 48 h were assessed for RNA:DNA hybrids (S9.6) and ssDNA (BrdU) and quantify the percentage of colocalization as (d). *p = 0.048, ***p < 0.001 using multiple comparison with Ordinary One-Way ANOVA. bf At least 30 fields from n = 3 independent experiments were quantified. Source data are provided as a Source data file.
Fig. 4
Fig. 4. Inhibition of RNAPII impairs DDR protein recruitment to DSBs.
a Representative time-lapse images of CtIP-GFP recruitment to DNA damage in RNAPII -inhibited (THZ1, 1 µM during 2 h) and DMSO as control during 600 s post microlaser irradiation in U2OS cells. n = 3 biologically independent experiments. Scale bar: 1 μm b Effect of THZ1 treatment (1 µM during 2 h) on the kinetics of CtIP-GFP recruitment to DNA damage by measuring relative fluorescence intensity of CtIP-GFP during 600 s post microlaser irradiation in U2OS cells. The analysis represents the average on n = 30 (Ctrl) and n = 15 (THZ1) nuclei from 3 biologically independent experiments. p values were calculated using two-tailed paired t test. ***p < 0.0001 c Representative images of 53BP1-GFP recruitment to DNA damage after THZ1 treatment (1 µM during 2 h), assessed as in (a). n = 3 biologically independent experiments. Scale bar: 1 μm d Kinetics of 53BP1-GFP intensity in U2OS cells treated with DMSO or THZ1 (1 µM during 2 h) prior microlaser irradiation, measured as in (b). The analysis represents the average on n = 17 (Ctrl) and n = 18 (THZ1) nuclei from 3 biologically independent experiments. p values were calculated using two-tailed paired t test. ***p < 0.0001. eh Kinetics of recruitment to laser-induced DNA damage, for DDR factors MRE11 (e), BRCA1 (f), RAD52 (g) and RPA (h) treated or not with RNAPII inhibitor (THZ1, 1 µM during 2 h) prior microlaser irradiation, and measured as in (b). The analysis represents the average of nuclei from 3 biologically independent experiments. MRE11, n = 31 (Ctrl) and n = 29 (THZ1); BRCA1, n = 18 (Ctrl) and n = 14 (THZ1), RAD52, n = 26 (Ctrl) and n = 8 (THZ1), RPA, n = 17 (Ctrl) and n = 16 (THZ1). p values were calculated using two-tailed t test in all graphs. ***p < 0.0001. b, d, eh, two-tailed paired t test was analyzed for all kinetics. ***p < 0.001. In the graphs the mean of mobile fractions and the ±SD (bottom right) are shown for each sample. Source data are provided as a Source data file.
Fig. 5
Fig. 5. Defective recruitment of HR factors after RNAPII inhibition favors NHEJ repair.
a Representative images of 53BP1 foci upon 5 Gy irradiation in U2OS cells treated with DMSO or THZ1 (1 µM during 2 h), (left). Scatter dot blot for 53BP1 foci quantification at 0, 30, 60, and 120 min after irradiation (right). b Same as in (a), but measuring γH2AX foci. c Same as in (a), but measuring BRCA1 foci. ac At least n = 500 cells examined over 3 independent experiments were quantified. Data are presented as mean values ± s.e.m. p values were calculated using multiple comparison with Ordinary One-Way ANOVA. **p = 0.002 and ***p < 0.0001 Scale bar: 10 μm. d Dot graph of RL-SMART assay shows mean of percentages of RNA:DNA hybrids (S9.6) and ssDNA (BrdU) signal colocalization on resection tracts generated in non- and 5 Gy-irradiated HeLa cells. p value were calculated using multiple comparison with Ordinary One-Way ANOVA. *p = 0.036 and **p = 0.002. At least n = 15 fields examined over 3 independent experiments were quantified. e Representative quantifications of fiber profiles for DNA resected track (BrdU) and RNA:DNA hybrids (S9.6) staining intensities from non- and irradiated HeLa cells treated with RNAPII inhibitor, THZ1 (1 μM 2 h). N = 3 independent experiments. Scale bar: 1 μm. Source data are provided as a Source data file.
Fig. 6
Fig. 6. DNA resection deficiency prevents transcription re-start after DNA damage.
a Representative images of de novo transcription based on BrUTP incorporation assay at 7, 15 and 30 min post-IR (5 Gy) in CtIP-depleted U2OS cells. Zoom in pictures are shown. n = 3 biologically independent experiments. Scale bar: 1 μm. b Dot graph shows nucleoplasm (non-nucleolar) quantification of BrUTP incorporation under the experimental conditions cued in (a). At least n = 200 cells examined over 3 independent experiments were quantified. Data are represented as mean value. P value were calculated using multiple comparison with Ordinary One-Way ANOVA. ***p < 0.0001. c RNAPII immunoprecipitation from extracts of non- and irradiated U2OS cells at 7, 15, 30, 60 and 120 min post-IR (5 Gy). Immunoblot detection of CtIP and RNAPII proteins in immunoprecipitated and input samples, as indicated. Quantification of CtIP co-immunoprecipitated with RNAPII is shown below. N = 3 independent experiments. Source data are provided as a Source data file.
Fig. 7
Fig. 7. Schematic model of the regulation and role of RNAPII-generated nascent RNA to guide DNA end resection and DSB repair by HR.
Transcriptionally active RNAPII is more prominent in S-G2 cell cycle phases (showed in Fig.1) when HR is known to repair DSBs. RNAPII recruitment to DSBs, that involves the pre-initiation complex (PIC), favors nascent RNA transcription, leading to generation of small RNA:DNA hybrid structures that cause RNAPII pausing (showed in Figs.2, 3). RAD52 and XPG are capable of rescuing the transiently paused RNAPII activity (8), allowing for 5’DNA strand displacement. Experimental inhibition of transcription impairs recruitment of the DNA resection factors CtIP, MRE11 and BRCA1 (showed in Figs.4, 5) to DSBs. MRE11 initiates 5’strand degradation, while the CtIP-BRCA1 axis is essential to regulate the speed of resection by controlling transcription upon DNA damage (showed in Fig.6). We show that CtIP and BRCA1 are factors promoting and/or re-starting the locally paused RNAPII-mediated transcription. These upstream events guide the DSB repair choice towards HR through initiation and progression of DNA end resection, in a feedback loop in which proper CtIP and BRCA1 recruitment are stimulated by the RNAPII at the DSB site, at least in part through complex formation between CtIP and RNAPII. Additional proteins and auxiliary processes such as exosomes RNA splicing and Drosha/Dicer contribute to regulation of RNA:DNA hybrids along the initiated HR pathway to adjust this process in a cell context- and time-dependent manner to safeguard genomic integrity.

References

    1. Higgs PG, Lehman N. The RNA World: molecular cooperation at the origins of life. Nat. Rev. Genet. 2015;16:7–17. doi: 10.1038/nrg3841. - DOI - PubMed
    1. Dethoff EA, Chugh J, Mustoe AM, Al-Hashimi HM. Functional complexity and regulation through RNA dynamics. Nature. 2012;482:322–330. doi: 10.1038/nature10885. - DOI - PMC - PubMed
    1. Gomez-Cabello D, et al. Regulation of the microRNA processor DGCR8 by the tumor suppressor ING1. Cancer Res. 2010;70:1866–1874. doi: 10.1158/0008-5472.CAN-09-2088. - DOI - PubMed
    1. Aguilera A, Garcia-Muse T. R loops: from transcription byproducts to threats to genome stability. Mol. Cell. 2012;46:115–124. doi: 10.1016/j.molcel.2012.04.009. - DOI - PubMed
    1. Hawley BR, Lu WT, Wilczynska A, Bushell M. The emerging role of RNAs in DNA damage repair. Cell Death Differ. 2017;24:1989. doi: 10.1038/cdd.2017.146. - DOI - PMC - PubMed

Publication types