. 2022 Dec;16(12):2752-2762.
doi: 10.1038/s41396-022-01308-6. Epub 2022 Sep 9.

Plant-associated fungi support bacterial resilience following water limitation

Affiliations

Plant-associated fungi support bacterial resilience following water limitation

Rachel Hestrin et al. ISME J. 2022 Dec.

Abstract

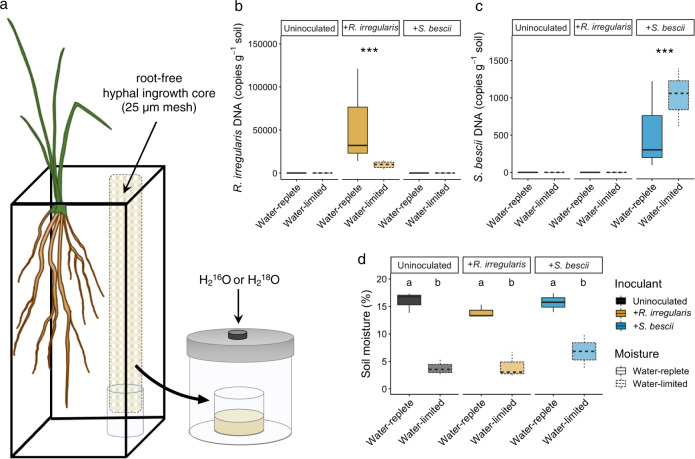
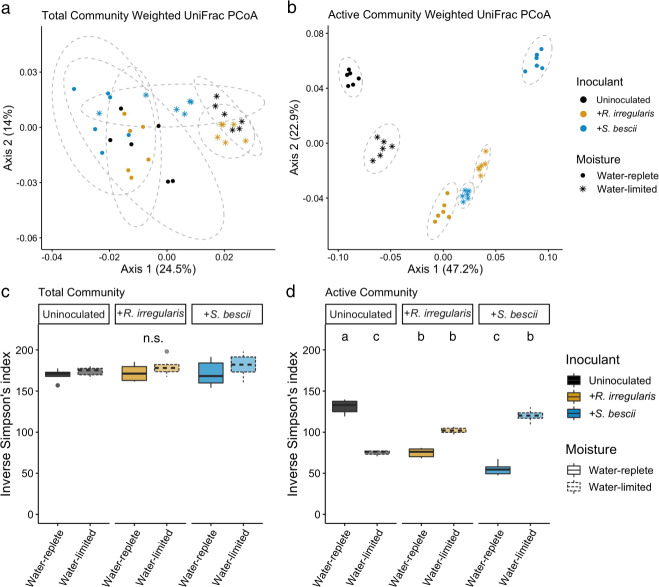
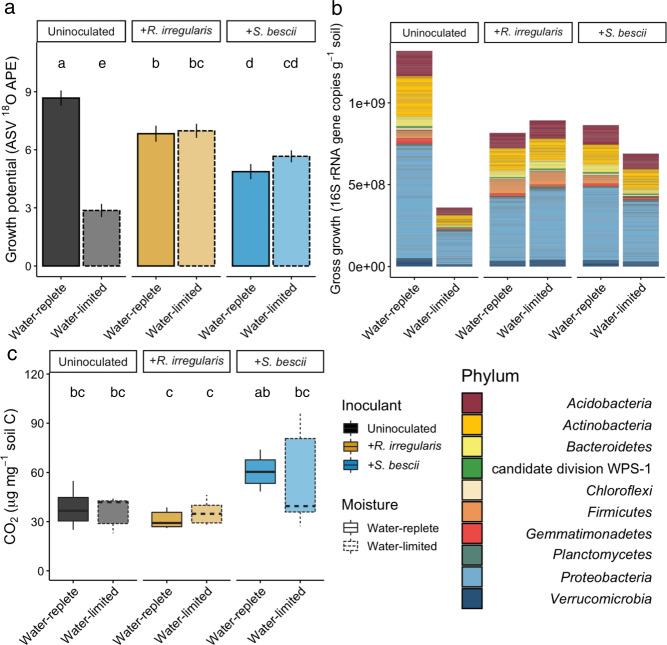
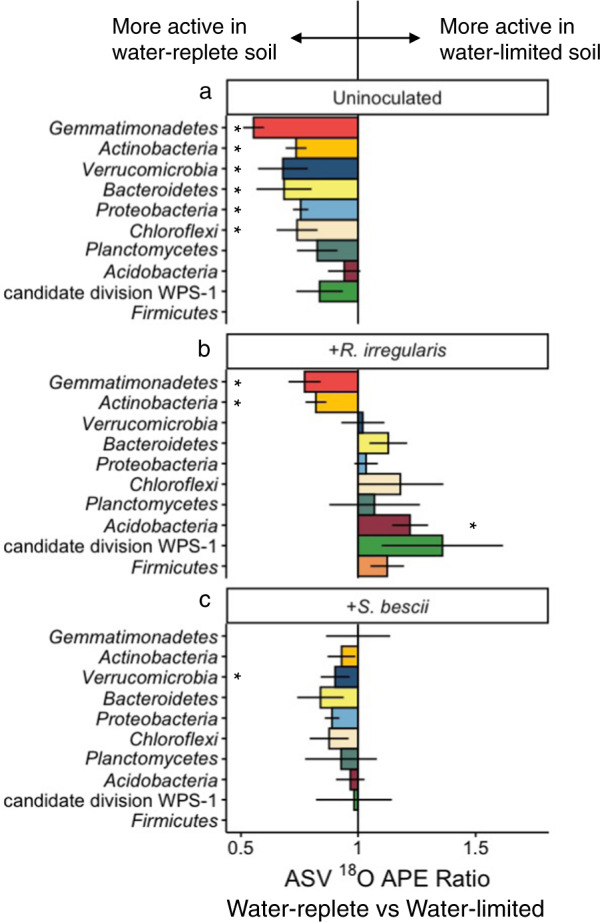
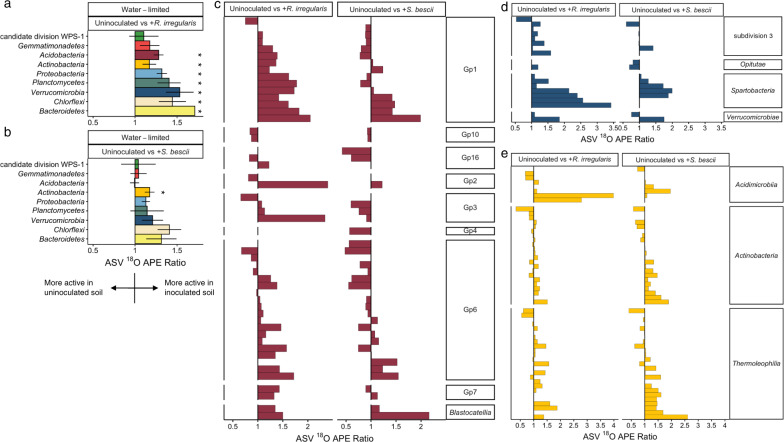
Drought disrupts soil microbial activity and many biogeochemical processes. Although plant-associated fungi can support plant performance and nutrient cycling during drought, their effects on nearby drought-exposed soil microbial communities are not well resolved. We used H218O quantitative stable isotope probing (qSIP) and 16S rRNA gene profiling to investigate bacterial community dynamics following water limitation in the hyphospheres of two distinct fungal lineages (Rhizophagus irregularis and Serendipita bescii) grown with the bioenergy model grass Panicum hallii. In uninoculated soil, a history of water limitation resulted in significantly lower bacterial growth potential and growth efficiency, as well as lower diversity in the actively growing bacterial community. In contrast, both fungal lineages had a protective effect on hyphosphere bacterial communities exposed to water limitation: bacterial growth potential, growth efficiency, and the diversity of the actively growing bacterial community were not suppressed by a history of water limitation in soils inoculated with either fungus. Despite their similar effects at the community level, the two fungal lineages did elicit different taxon-specific responses, and bacterial growth potential was greater in R. irregularis compared to S. bescii-inoculated soils. Several of the bacterial taxa that responded positively to fungal inocula belong to lineages that are considered drought susceptible. Overall, H218O qSIP highlighted treatment effects on bacterial community structure that were less pronounced using traditional 16S rRNA gene profiling. Together, these results indicate that fungal-bacterial synergies may support bacterial resilience to moisture limitation.


Conflict of interest statement

The authors declare no competing interests.

Figures

Fig. 1
Fig. 1. Experimental design, fungal inoculum abundance, and soil moisture.
a Microcosm design for H218O quantitative stable isotope probing (qSIP) assay of root-free hyphal ingrowth core soils. P. hallii plants were inoculated with either R. irregularis, S. bescii, or left uninoculated (indicated in yellow, blue, or black, respectively) and grown under water-replete or water-limited conditions (indicated in dark or light shades and solid or dashed lines, respectively; n = 3 replicates per treatment). After 3 months, hyphal ingrowth core soils were amended with enriched (H218O) or natural abundance (H216O) water and incubated for 7 days. b Abundance of R. irregularis and (c) S. bescii (DNA copies g−1 soil) measured with strain-specific qPCR primers after 3 months. d Soil moisture after 3 months. Bold lines represent median value; whiskers represent upper and lower quartiles (n = 6 replicates per fungal*moisture treatment combination). Asterisks denote the results of a nonparametric Kruskal–Wallis rank sum test performed separately for each qPCR plot (p < 0.001). Letters denote a Tukey’s HSD test for soil moisture comparisons (p < 0.001).
Fig. 2
Fig. 2. Structure and alpha diversity of total and actively growing bacterial communities based on traditional and H218O qSIP-filtered 16S rRNA gene profiling.
Principal coordinates analysis (PCoA) of weighted UniFrac distances between bacterial communities assessed with (a) traditional 16S rRNA gene profiles and (b) H218O qSIP-filtered 16S rRNA gene profiles representing the actively growing communities (i.e., ASVs that did not incorporate a significant quantity of 18O were removed prior to analysis). Moisture history and fungal inoculum explained a total of 30% of the variation in total community structure (p < 0.001; n = 6 replicates) and 86% of variation in actively growing community structure (p < 0.001; n = 6 replicates). Ellipses show treatment groupings in (a, b). Inverse Simpson’s diversity index in (c) total and (d) actively growing communities. Letters denote the results of a Tukey’s HSD test (no significant differences between total communities; p < 0.01 for comparisons between actively growing communities; n = 6 replicates). Bold lines represent median values; whiskers represent upper and lower quartiles. For all plots, uninoculated, R. irregularis-inoculated, and S. bescii-inoculated soils are represented in black, yellow, and blue, respectively. Water-replete and water-limited soils are represented in dark or light color shades, solid or dashed boxplot outlines, and circles or asterisks, respectively.
Fig. 3
Fig. 3. H218O qSIP-based bacterial growth potential, gross growth, and CO2 efflux from hyphal ingrowth core soils following exposure to different moisture regimes and fungal inocula.
a Bacterial ASV growth potential represented by median 18O atom percent excess (APE). Uninoculated, R. irregularis-inoculated, and S. bescii-inoculated soils are represented in black, yellow, and blue, respectively. Water-replete and water-limited soils are represented in dark or light shades and solid or dashed outlines, respectively. Letters denote the results of a Tukey’s HSD test comparing the means of all treatments (p < 0.01; n = 3 replicates). b Taxon-specific gross growth (16S rRNA gene copies g−1 soil) based on ASV 18O incorporation, summed by phylum for each treatment. Only ASVs that belong to the ten most abundant phyla are represented. c CO2 efflux (µg CO2 mg−1 soil C) from hyphal ingrowth core soils during H218O qSIP assay. Bold lines represent median values; whiskers represent upper and lower quartiles (p < 0.05; n = 6 replicates per treatment).
Fig. 4
Fig. 4. Comparison of taxon-specific bacterial growth potential following water-limited versus water-replete conditions in uninoculated or fungal-inoculated hyphal ingrowth core soils.
18O atom percent excess (APE) active growth ratios of ASVs present in both water-limited and water-replete soils that were either (a) uninoculated, (b) inoculated with R. irregularis, or (c) inoculated with S. bescii. Ratios were averaged at the phylum level. Ratios less than 1.0 (bars located to the left of the central vertical line) indicate that water limitation suppressed growth potential. Ratios greater than 1.0 (bars located to the right of the central line) indicate that water limitation facilitated greater growth potential. Error bars represent the standard error. Asterisks denote phylum-level averages that are significantly greater than or less than 1.0 (adjusted p < 0.05 based on Wilcoxon signed rank test and Benjamini–Hochberg correction for multiple comparisons). Only taxa that incorporated a significant quantity of 18O (lower 90% CI > 0) and belong to the ten most abundant phyla are represented.
Fig. 5
Fig. 5. Comparison of taxon-specific bacterial growth potential in fungal-inoculated versus uninoculated hyphal ingrowth core soils following water limitation.
18O atom percent excess (APE) active growth ratios of bacterial ASVs present in water-limited soils that were either uninoculated or inoculated with R. irregularis or S. bescii, averaged at the phylum level (a, b) or displayed by individual ASV grouped within class for the phyla Acidobacteria (c), Verrucomicrobia (d), and Actinobacteria (e). Ratios greater than 1.0 (to the right of the vertical central line) indicate that fungal inocula supported greater bacterial growth potential. For phylum-level averages, asterisks represent 18O APE ratios that are significantly greater than 1.0 (adjusted p < 0.05 based on Wilcoxon signed rank test and Benjamini–Hochberg correction for multiple comparisons). Error bars represent the standard error within each bacterial phylum. Only taxa that incorporated a significant quantity of 18O (lower 90% CI > 0) and belong to the ten most abundant phyla are represented.

References

    1. Leng G, Hall J. Crop yield sensitivity of global major agricultural countries to droughts and the projected changes in the future. Sci Total Environ. 2019;654:811–21. - PMC - PubMed
    1. Hueso S, García C, Hernández T. Severe drought conditions modify the microbial community structure, size and activity in amended and unamended soils. Soil Biol Biochem. 2012;50:167–73.
    1. Alster CJ, German DP, Lu Y, Allison SD. Microbial enzymatic responses to drought and to nitrogen addition in a southern California grassland. Soil Biol Biochem. 2013;64:68–79.
    1. Bouskill NJ, Lim HC, Borglin S, Salve R, Wood TE, Silver WL, et al. Pre-exposure to drought increases the resistance of tropical forest soil bacterial communities to extended drought. ISME J. 2013;7:384–94. - PMC - PubMed
    1. Acosta-Martinez V, Cotton J, Gardner T, Moore-Kucera J, Zak J, Wester D, et al. Predominant bacterial and fungal assemblages in agricultural soils during a record drought/heat wave and linkages to enzyme activities of biogeochemical cycling. Appl Soil Ecol. 2014;84:69–82.

Publication types