. 2022 Dec;13(6):2724-2739.
doi: 10.1002/jcsm.13079. Epub 2022 Sep 9.

Atractylenolide I ameliorates cancer cachexia through inhibiting biogenesis of IL-6 and tumour-derived extracellular vesicles

Affiliations

Atractylenolide I ameliorates cancer cachexia through inhibiting biogenesis of IL-6 and tumour-derived extracellular vesicles

Meng Fan et al. J Cachexia Sarcopenia Muscle. 2022 Dec.

Abstract

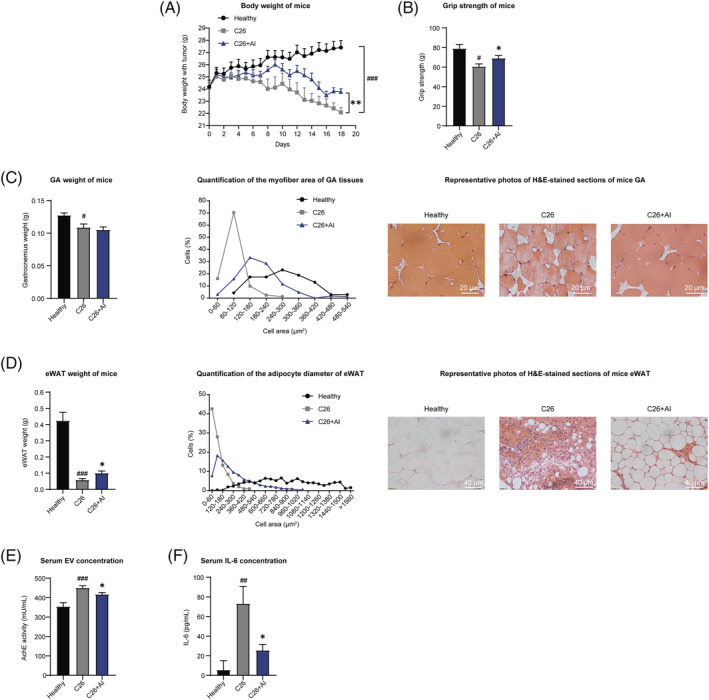
Background: Atractylenolide I (AI) is a natural sesquiterpene lactone isolated from Atractylodes macrocephala Koidz, known as Baizhu in traditional Chinese medicine. AI has been found to ameliorate cancer cachexia in clinic cancer patients and in tumour-bearing mice. Here, we checked the influence of AI on biogenesis of IL-6 and extracellular vesicles (EVs) in cancer cachexia mice and then focused on studying mechanisms of AI in inhibiting the production of tumour-derived EVs, which contribute to the ameliorating effects of AI on cancer cachexia.

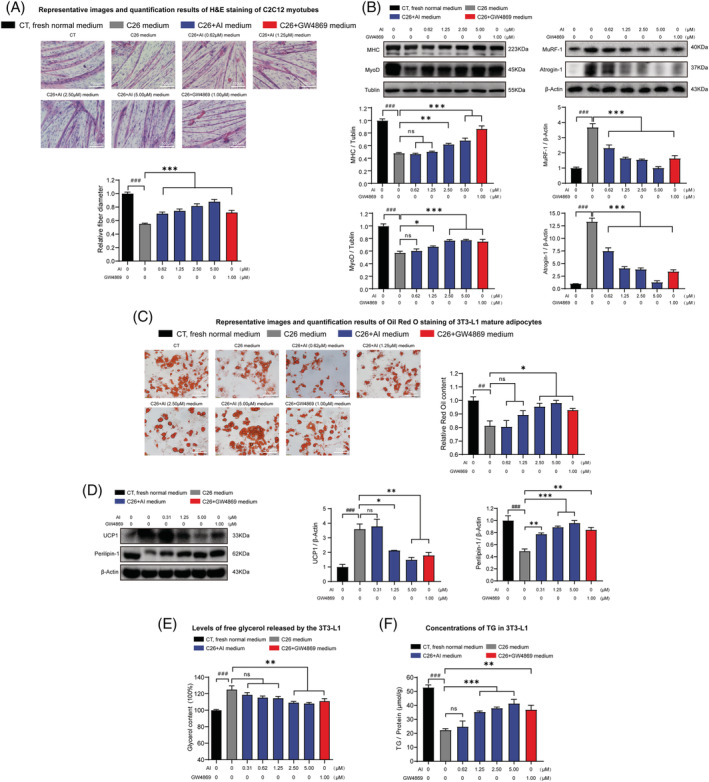
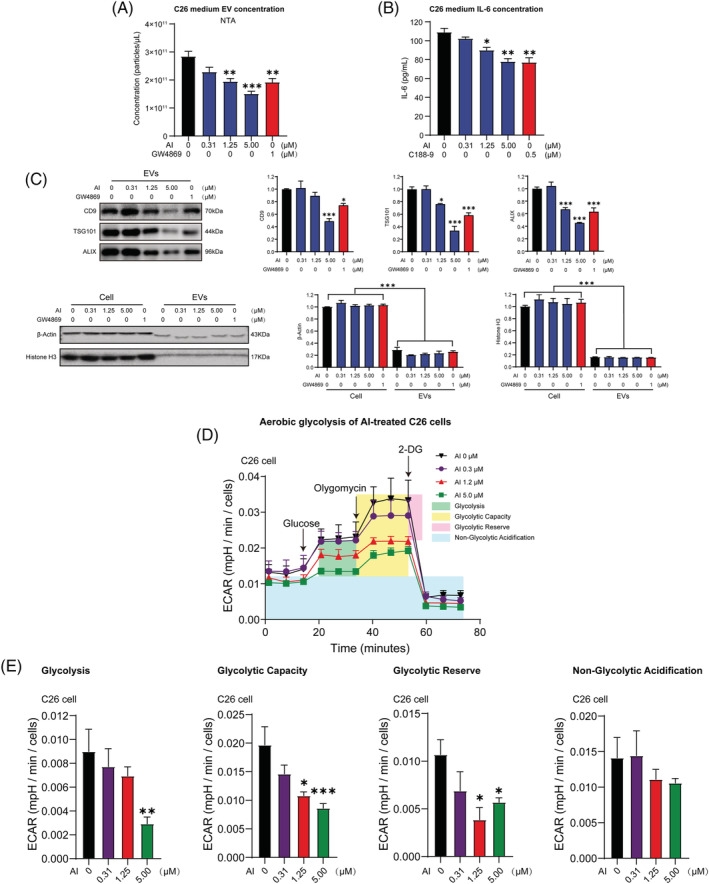
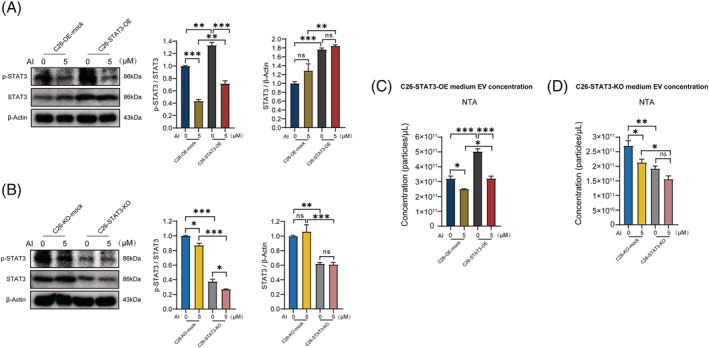
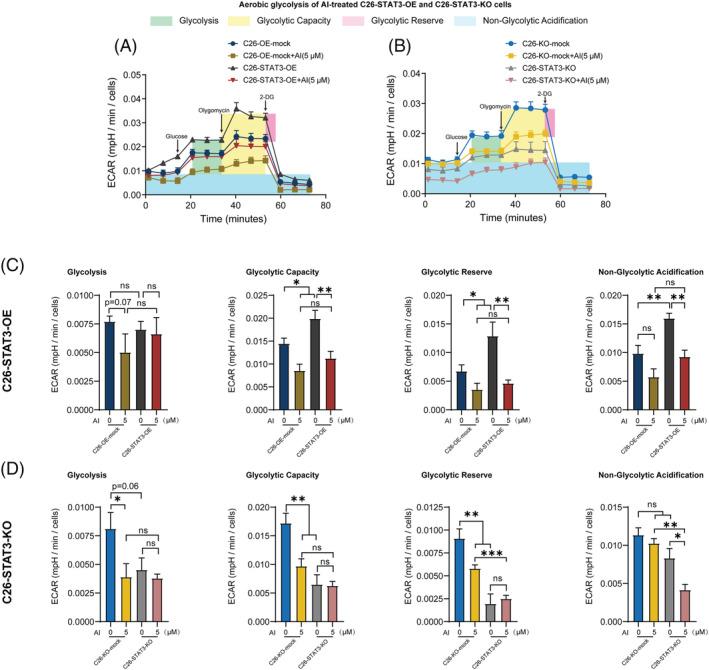
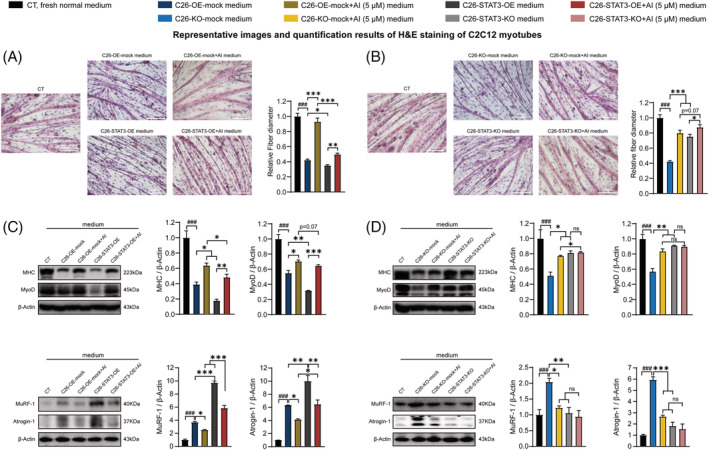
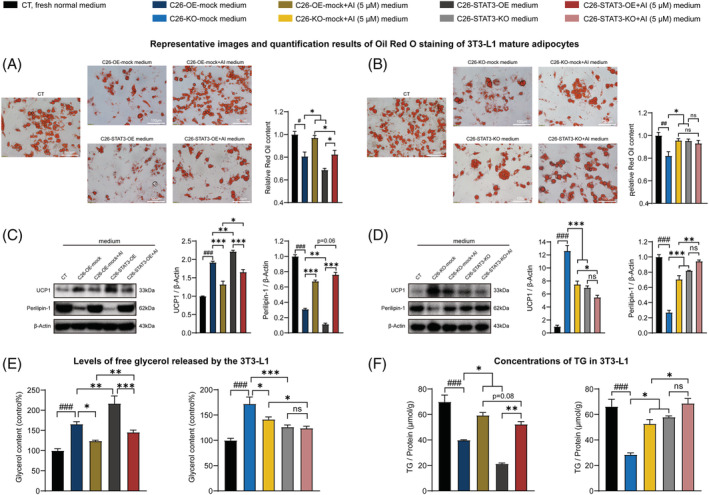
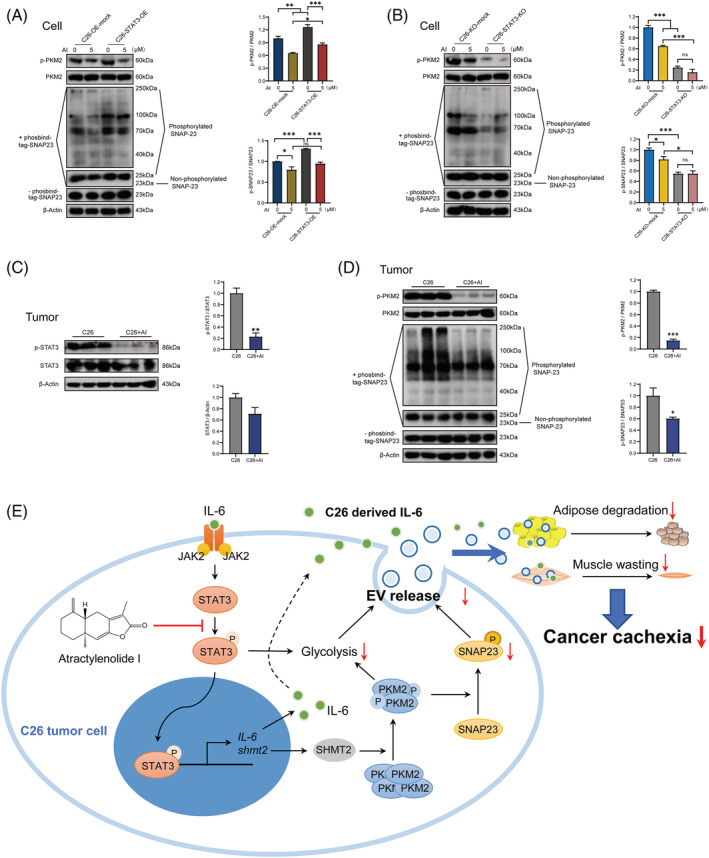
Methods: C26 tumour-bearing BALB/c mice were applied as animal model to examine the effects of AI (25 mg/kg) in attenuating cachexia symptoms, serum IL-6 and EVs levels. IL-6 and EVs secretion of C26 tumour cells treated with AI (0.31-5 μM) was further observed in vitro. The in vitro cultured C2C12 myotubes and 3T3-L1 mature adipocytes were used to check the potency of conditioned medium of C26 cells treated with AI (0.625-5 μM) in inducing muscle atrophy and lipolysis. The glycolysis potency of C26 cells under AI (0.31-5 μM) treatment was evaluated by measuring the extracellular acidification rate using Seahorse XFe96 Analyser. Levels of related signal proteins in both in vitro and in vivo experiments were examined using western blotting to study the possible mechanisms. STAT3 overexpression or knockout C26 cells were also used to confirm the effects of AI (5 μM).

Results: AI ameliorated cancer cachexia symptoms (P < 0.05), improved grip strength (P < 0.05) and decreased serum EVs (P < 0.05) and IL-6 (P < 0.05) levels of C26 tumour-bearing mice. AI directly inhibited EVs biogenesis (P < 0.001) and IL-6 secretion (P < 0.01) of cultured C26 cells. The potency of C26 medium in inducing C2C12 myotube atrophy (+59.54%, P < 0.001) and 3T3-L1 adipocyte lipolysis (+20.73%, P < 0.05) was significantly attenuated when C26 cells were treated with AI. AI treatment inhibited aerobic glycolysis and the pathway of STAT3/PKM2/SNAP23 in C26 cells. Furthermore, overexpression of STAT3 partly antagonized the effects of AI in suppressing STAT3/PKM2/SNAP23 pathway, EVs secretion, glycolysis and the potency of C26 medium in inducing muscle atrophy and lipolysis, whereas knockout of STAT3 enhanced the inhibitory effect of AI on these values. The inhibition of AI on STAT3/PKM2/SNAP23 pathway was also observed in C26 tumour tissues.

Conclusions: AI ameliorates cancer cachexia by decreasing the production of IL-6 and EVs of tumour cells. The decreasing effects of AI on EVs biogenesis are based on its inhibition on STAT3/PKM2/SNAP23 pathway.

Keywords: STAT3; atractylenolide I; cancer cachexia; extracellular vesicle; lipolysis; muscle atrophy.


Conflict of interest statement

All authors declare that they have no conflict of interest.

Figures

Figure 1
Figure 1
Atractylenolide I (AI) attenuated cachexia symptoms of C26 tumour‐bearing mice. C26 tumour‐bearing mice were administrated with AI (25 mg/kg) by intraperitoneal injection every day for 18 days, and healthy BALB/c mice and C26 model group mice received equal volume solvent. Body weight, food intake and tumour volume were recorded every day. The GA (gastrocnemius muscle), TAL (tibialis anterior muscle) muscle and eWAT (epididymal adipose tissue) tissues were dissected, weighed and then fixed in 4% paraformaldehyde (PFA) at the end of the experiment. (A) Body weight of mice. (B) Grip strength of mice. (C) GA weight of mice. Results of quantification of the myofibre area of GA tissues and representative photos of haematoxylin–eosin (H&E)‐stained sections of mice GA. Scale bar, 20 μm. (D) eWAT weight of mice. Results of quantification of the adipocyte diameter of eWAT and representative photos of H&E‐stained sections of mice eWAT. Scale bar, 40 μm. (E) Results of acetylcholinesterase (AChE) activity assay showed the amounts of extracellular vesicles (EVs) in equal volume of serum of each group of mice. (F) Serum concentrations of IL‐6 in each group of mice. Values were expressed as mean ± SEM (Healthy group: n = 8, C26 model group: n = 7, C26 + AI group: n = 7). # versus healthy group mice; * versus C26 model group mice. # P < 0.05, ## P < 0.01, ### P < 0.001; *P < 0.05, **P < 0.01. Statistical tests one‐way ANOVA/Bonferroni's post hoc test was performed.
Figure 2
Figure 2
Effects of the media derived from atractylenolide I (AI)‐treated C26 cells in inducing atrophy of C2C12 myotubes and lipolysis of 3T3‐L1 adipocytes. C2C12 myoblasts and 3T3‐L1 pre‐adipocytes cells were differentiated into myotubes and 3T3‐L1 mature adipocyte. The C2C12 myotubes and 3T3‐L1 mature adipocytes were cultured with media derived from non‐tumour cells (CT, black, 1:1 dilution with fresh normal medium), C26 cells (C26 medium, grey, 1:1 dilution with fresh normal medium), AI‐treated C26 cells (C26 + AI medium, blue, 1:1 dilution with fresh normal medium) and GW4869‐treated C26 cells (C26 + GW4869 medium, red, 1:1 dilution with fresh normal medium) for 48 h for the following experiments. (A) Representative images and quantification results of haematoxylin–eosin (H&E) staining of C2C12 myotubes. Scale bar, 100 μm. (B) Western blotting analysis of MHC (myosin heavy chain), MyoD, Atrogin‐1 and MuRF‐1 expression levels in different groups. (C) Representative images and quantification results of Oil Red O staining of 3T3‐L1 mature adipocytes. Scale bar, 100 μm. (D) Western blotting analysis of UCP1 and Perilipin‐1 protein expression levels in the 3T3‐L1 mature adipocytes of different groups. (E) Levels of free glycerol released by the 3T3‐L1 mature adipocytes. (F) Concentrations of triglyceride (TG) in the 3T3‐L1 mature adipocytes. Data presented were the mean ± SEM of three independent experiments. # versus CT group, * versus C26 medium group. ## P < 0.01, ### P < 0.001; ns P > 0.05, *P < 0.05, **P < 0.01, ***P < 0.001. Statistical tests one‐way ANOVA/Bonferroni's post hoc test was performed.
Figure 3
Figure 3
Effects of atractylenolide I (AI) in inhibiting extracellular vesicle (EV) and IL‐6 production of C26 cells as well as ameliorating aerobic glycolysis of C26 cells. (A) C26 cells were treated with varying concentrations of AI for 48 h; then EVs were derived from the media and quantified by NTA (Nanoparticle Tracking Analysis). (B) C26 cells were treated with varying concentrations of AI for 48 h; then the media were derived for IL‐6 detection; results of ELISA assay showed the influence of AI on IL‐6 secretion of C26 cells. (C) Western blotting of EV molecular markers in 20 μg of total cell lysate (TCL) of C26 cells, and 20 μg of EVs derived from C26 cells. Positive EV markers include CD9, TSG101 and Alix, whereas negative EV markers are β‐actin and histone H3. (D) Aerobic glycolysis of C26 cells treated with increasing concentrations of AI for 48 h was evaluated by monitoring extracellular acidification rate (ECAR) using Seahorse XFe96 Analyser. Glucose (10 mM) was first added to boost the glycolysis level, and the addition of ATP synthase inhibitor Oligomycin (2 μM) shut down oxidative phosphorylation, allowing the measurement of glycolytic capacity. The following addition of glycolysis inhibitor 2‐DG (50 mM) inhibited glycolysis and allowed us to evaluate the glycolytic reserve. (E) Results of quantification analysis of glycolysis, glycolytic capacity, glycolytic reserve and non‐glycolytic acidification. Data presented were the mean ± SEM of three independent experiments (A–C). Values were expressed as mean ± SEM (D, E). *P < 0.05, **P < 0.01, ***P < 0.001. Statistical tests one‐way ANOVA/Bonferroni's post hoc test was performed.
Figure 4
Figure 4
Effects of atractylenolide I (AI) on p‐STAT3 expression in STAT3 overexpression (OE) and knockout (KO) C26 cells. (A, B) Western blotting analysis of p‐STAT3 and STAT3 proteins in AI‐treated C26‐STAT3‐OE and C26‐STAT3‐KO cells. (C, D) Results of NTA (Nanoparticle Tracking Analysis) showed the concentrations of extracellular vesicles (EVs) in conditioned medium of AI‐treated C26‐STAT3‐OE and C26‐STAT3‐KO cells. Data presented are the mean ± SEM of three independent experiments. ns P > 0.05, *P < 0.05, **P < 0.01, ***P < 0.001. Statistical tests one‐way ANOVA/Bonferroni's post hoc test was performed.
Figure 5
Figure 5
Effects of atractylenolide I (AI) in ameliorating aerobic glycolysis of STAT3 overexpression (OE) and knockout (KO) C26 cells. (A, B) Aerobic glycolysis of AI‐treated C26‐STAT3‐OE and C26‐STAT3‐KO cells was evaluated by monitoring extracellular acidification rate (ECAR) using Seahorse XFe96 Analyser. Glucose (10 mM) was first added to boost the glycolysis level, and the addition of ATP synthase inhibitor Oligomycin (2 μM) shut down oxidative phosphorylation, allowing the measurement of glycolytic capacity. The following addition of glycolysis inhibitor 2‐DG (50 mM) inhibited glycolysis and allowed us to evaluate the glycolytic reserve. (C, D) Results of quantification analysis of glycolysis, glycolytic capacity, glycolytic reserve and non‐glycolytic acidification. Values were expressed as mean ± SEM. ns P > 0.05, *P < 0.05, **P < 0.01, ***P < 0.001. Statistical tests one‐way ANOVA/Bonferroni's post hoc test was performed.
Figure 6
Figure 6
Effects of the media derived from atractylenolide I (AI)‐treated C26‐STAT3‐overexpression (OE) and AI‐treated C26‐STAT3‐knockout (KO) cells in inducing atrophy of C2C12 myotubes. C2C12 myoblasts were differentiated into C2C12 myotubes. The C2C12 myotubes were cultured with media derived from non‐tumour cells (CT, black, 1:1 dilution with fresh normal medium), C26‐OE‐mock cells or C26‐KO‐mock cells (C26‐OE‐mock medium, C26‐KO‐mock medium, blue, 1:1 dilution with fresh normal medium), AI‐treated C26‐OE‐mock cells or AI‐treated C26‐KO‐mock cells (C26‐OE‐mock + AI medium, C26‐KO‐mock + AI medium, yellow, 1:1 dilution with fresh normal medium), C26‐STAT3‐OE cells or C26‐STAT3‐KO cells (C26‐STAT3‐OE medium, C26‐STAT3‐KO medium, grey, 1:1 dilution with fresh normal medium) and AI‐treated C26‐STAT3‐OE cells or AI‐treated C26‐STAT3‐KO cells (C26‐STAT3‐OE + AI medium, C26‐STAT3‐KO + AI medium, red, 1:1 dilution with fresh normal medium) for 48 h for the following experiments. (A, B) Representative images and quantification results of haematoxylin–eosin (H&E) staining of C2C12 myotubes. Scale bar, 100 μm. (C, D) Western blotting analysis of MHC (myosin heavy chain), MyoD, Atrogin‐1 and MuRF‐1 expression levels in different groups. Data presented were the mean ± SEM of three independent experiments. # P < 0.05, ## P < 0.01, ### P < 0.001; ns P > 0.05, *P < 0.05, **P < 0.01, ***P < 0.001. Statistical tests one‐way ANOVA/Bonferroni's post hoc test was performed.
Figure 7
Figure 7
Effects of the media derived from atractylenolide I (AI)‐treated C26‐STAT3‐overexpression (OE) and AI‐treated C26‐STAT3‐knockout (KO) cells in inducing lipolysis of 3T3‐L1 adipocytes. 3T3‐L1 pre‐adipocytes cells were differentiated into 3T3‐L1 mature adipocytes. The 3T3‐L1 mature adipocytes were cultured with media derived from non‐tumour cells (CT, black, 1:1 dilution with fresh normal medium), C26‐OE‐mock cells or C26‐KO‐mock cells (C26‐OE‐mock medium, C26‐KO‐mock medium, blue, 1:1 dilution with fresh normal medium), AI‐treated C26‐OE‐mock cells or AI‐treated C26‐KO‐mock cells (C26‐OE‐mock + AI medium, C26‐KO‐mock + AI medium, yellow, 1:1 dilution with fresh normal medium), C26‐STAT3‐OE cells or C26‐STAT3‐KO cells (C26‐STAT3‐OE medium, C26‐STAT3‐KO medium, grey, 1:1 dilution with fresh normal medium) and AI‐treated C26‐STAT3‐OE cells or AI‐treated C26‐STAT3‐KO cells (C26‐STAT3‐OE + AI medium, C26‐STAT3‐KO + AI medium, red, 1:1 dilution with fresh normal medium) for 48 h for the following experiments. (A, B) Representative images and quantification results of Oil Red O staining of 3T3‐L1 mature adipocytes. Scale bar, 100 μm. (C, D) Western blotting analysis of UCP1 and Perilipin‐1 protein expression levels in the 3T3‐L1 mature adipocytes of different groups. (E) Levels of free glycerol released by the 3T3‐L1 mature adipocytes. (F) Concentrations of triglyceride (TG) in the 3T3‐L1 mature adipocytes. Data presented were the mean ± SEM of three independent experiments. # P < 0.05, ## P < 0.01, ### P < 0.001; ns P > 0.05, *P < 0.05, **P < 0.01, ***P < 0.001. Statistical tests one‐way ANOVA/Bonferroni's post hoc test was performed.
Figure 8
Figure 8
Effects of atractylenolide I (AI) on STAT3/PKM2/SNAP23 pathway. (A) Western blotting analysis of p‐PKM2, PKM2, p‐SNAP23 and SNAP23 proteins in AI‐treated C26‐overexpression (OE)‐mock and AI‐treated C26‐STAT3‐OE cells. (B) Western blotting analysis of p‐PKM2, PKM2, p‐SNAP23 and SNAP23 proteins in AI‐treated C26‐knockout (KO)‐mock and AI‐treated C26‐STAT3‐KO cells. (C) Western blotting analysis of p‐STAT3 and STAT3 proteins in AI‐treated (25 mg/kg) C26 tumours. (D) Western blotting analysis of p‐PKM2, PKM2, p‐SNAP23 and SNAP23 proteins in AI‐treated (25 mg/kg) C26 tumours. (E) Schematic illustration of the mechanism. A diagram of the proposed mechanism shows that AI attenuated cachexia symptoms by targeting STAT3. AI inhibited the phosphorylation of STAT3 and PKM2, leading to downregulation of glycolysis effect and p‐SNAP23 expression, reduced release of extracellular vesicle (EV), thus attenuating muscle wasting and adipose degradation. The inhibition of IL‐6 secretion also played a role. (A, B) Data presented were the mean ± SEM of three independent experiments. (C, D) Values were expressed as mean ± SEM. ns P > 0.05, *P < 0.05, **P < 0.01, ***P < 0.001. Statistical tests were performed as follows: (A, B) one‐way ANOVA/Bonferroni's post hoc test, (C, D) Student's t‐test.

Similar articles

Cited by

References

    1. Argilés JM, Busquets S, Stemmler B, López‐Soriano FJ. Cancer cachexia: understanding the molecular basis. Nat Rev Cancer 2014;14:754–762. - PubMed
    1. Wakabayashi H, Arai H, Inui A. The regulatory approval of anamorelin for treatment of cachexia in patients with non‐small cell lung cancer, gastric cancer, pancreatic cancer, and colorectal cancer in Japan: facts and numbers. J Cachexia Sarcopenia Muscle 2021;12:14–16. - PMC - PubMed
    1. Santos JMO, Costa AC, Dias TR, Satari S, Costa e Silva MP, da Costa RMG, et al. Towards drug repurposing in cancer cachexia: potential targets and candidates. Pharmaceuticals (Basel) 2021;14:1084. - PMC - PubMed
    1. Bailly C. Atractylenolides, essential components of Atractylodes‐based traditional herbal medicines: antioxidant, anti‐inflammatory and anticancer properties. Eur J Pharmacol 2021;891:173735. - PubMed
    1. Xiaomei R, Wenwen Q, Bao X. Effects of modified Sijunzi decoction and nutrition preparation on nutritional state of cancer patients. West J Trad Chin Med 2021;34:81–83.

Publication types