. 2022 Jul:2022:3093-3099.
doi: 10.1109/EMBC48229.2022.9871812.

Difference in Network Effects of Pulsatile and Galvanic Stimulation

Difference in Network Effects of Pulsatile and Galvanic Stimulation

Paul Adkisson et al. Annu Int Conf IEEE Eng Med Biol Soc. 2022 Jul.

Abstract

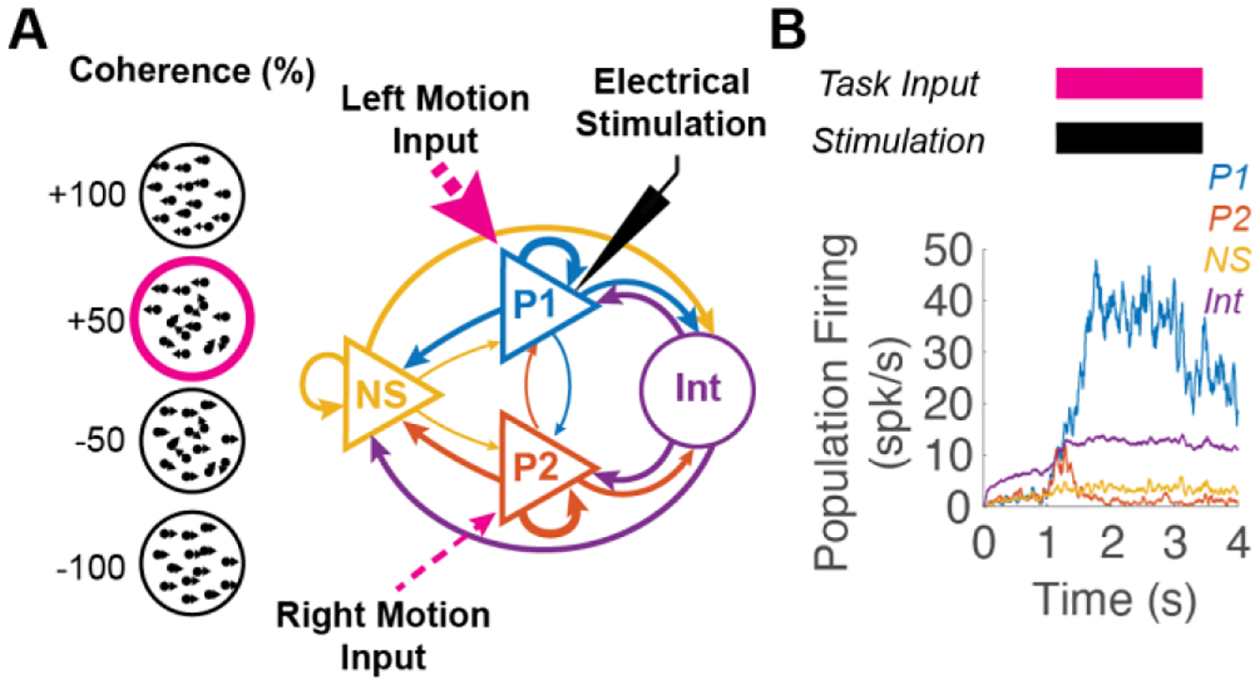
Biphasic pulsatile stimulation is the present standard for neural prosthetic use, and it is used to understand connectivity and functionality of the brain in brain mapping studies. While pulses have been shown to drive behavioral changes, such as biasing decision making, they have deficits. For example, cochlear implants restore hearing but lack the ability to restore pitch perception. Recent work shows that pulses produce artificial synchrony in networks of neurons and non-linear changes in firing rate with pulse amplitude. Studies also show galvanic stimulation, delivery of current for extended periods of time, produces more naturalistic behavioral responses than pulses. In this paper, we use a winner-take-all decision-making network model to investigate differences between pulsatile and galvanic stimulation at the single neuron and network level while accurately modeling the effects of pulses on neurons for the first time. Results show pulses bias spike timing and make neurons more resistive to natural network inputs than galvanic stimulation at an equivalent current amplitude. Clinical Relevance- This establishes that pulsatile stimulation may disrupt natural spike timing and network-level interactions while certain parameterizations of galvanic stimulation avoid these effects and can drive network firing more naturally.


Figures

Figure 1.
Figure 1.
Experimental Design. (A) Model consists of two subpopulations (P1 and P2) responsive to leftward and rightward motion, non-selective pyramidal neurons (NS) and inhibitory interneurons (Int). Neurons are connected with strong, medium, and weak connections (thickness proportional to strength). During a trial, all neurons receive background input. From 1–3s, P1 receives input proportional to coherence of left versus rightward motion. Stronger input to P1 shown for +50% leftward coherence in magenta. P1 also receives electrical stimulation from 1–3s (black) to bias the network. (B) Mean population firing rates of P1 (blue), P2 (red), NS (yellow) and Int (purple) in a representative pulsatile stimulation trial. Stimulation and take input timing shown above.
Figure 2:
Figure 2:
Effects on decision making and decision time. The decision metrics across subjects at the same coherence levels for pulsatile (red), galvanic (green) and control (black) conditions. (A) The percentage of trials in which the stimulated population (P1) wins the decision-making process. (B) The time it takes for the winning population to clear the decision threshold (15 spk/s). Bold error bars depict mean and standard error at each coherence level.
Figure 3.
Figure 3.
Effects of pulsatile (red), galvanic (green) and control (black) stimulation on individual P1 neural firing rates. Subjects with disconnected (A-C) and connected (D-F) neurons are investigated. Each neuron’s start-of-task firing rate (t=1.0–1.1s) is shown as a function of its distance to the stimulation electrode (A: full P1, B: closest 20% of P1). Bar graphs (C and F) depict each brain’s population-averaged change in firing rate relative to control. For all trials, task-related input was equal for P1 and P2 (coherence = 0%). The effect of pulses on change in start-of-task firing rate was significantly stronger than galvanic (p<0.00001,****).
Figure 4.
Figure 4.
Spike timing differences in P1 neurons among stimulation conditions (Pulsatile, red; Galvanic, green; and Control, black). (A) Rasters are plotted for the three P1 neurons with highest firing rates in the pulsatile condition, along with the times of each pulse (grey). Corresponding neurons receiving identical natural inputs are plotted for galvanic and control conditions. (B) The percent of each neuron’s action potentials that occur during a pulse presentation for the end-of-task (t=2.5–3s) period is shown as a function of its distance to the stimulation electrode for connected (triangles) and disconnected (circles) cases. (C) Each neuron’s end-of-task coefficient of variation (CV) is shown as a function of its distance to the stimulation electrode for connected (triangles) and disconnected (circles) cases. (D) Heat map of the percent of action potentials from a neuron that are synchronized to another neuron as a function of distance from the stimulation electrode for connected (top) and disconnected (bottom) cases. Self-synchrony was undefined (N/A, blue). For all trials, task-related input was equal for P1 and P2 (coherence = 0%). For connected simulations, only trials in which P1 won were included.
Figure 5.
Figure 5.
Effects of stimulation on P1 firing rates for different network-level outcomes. Trials in which (A-C) P1 wins (coherence=+25.6%) and (D-F) P1 loses (coherence=−100%). Average P1 firing rates for all 3 stimulation conditions (Pulsatile, red; Galvanic, green; and Control, black) are shown for the full trial (A and D) and during the end of task period (B and E, t=2.9–3s highlighted yellow in A and D). Bar graphs (C and F) depict each brain’s population-averaged change in end-of-task firing rate relative to control in all trials in which P1 wins (C) and P1 loses (F). Significance of effect (p<0.00001) is indicated by ****.

References

    1. Keller CJ, Honey CJ, Mégevand P, Entz L, Ulbert I, and Mehta AD, “Mapping human brain networks with cortico-cortical evoked potentials,” Philos. Trans. R. Soc. B Biol. Sci, vol. 369, no. 1653, p. 20130528, Oct. 2014, doi: 10.1098/rstb.2013.0528. - DOI - PMC - PubMed
    1. “Intraoperative dorsal language network mapping by using single-pulse electrical stimulation”, doi: 10.1002/hbm.22479. - DOI - PMC - PubMed
    1. Matsumoto R et al. , “Parieto-frontal network in humans studied by cortico-cortical evoked potential,” Hum. Brain Mapp, vol. 33, no. 12, pp. 2856–2872, 2012, doi: 10.1002/hbm.21407. - DOI - PMC - PubMed
    1. Loeb GE, “Neural Prosthetics:A Review of Empirical vs. Systems Engineering Strategies,” Appl. Bionics Biomech, vol. 2018, p. e1435030, Nov. 2018, doi: 10.1155/2018/1435030. - DOI - PMC - PubMed
    1. Zangiabadi N, Ladino LD, Sina F, Orozco-Hernández JP, Carter A, and Téllez-Zenteno JF, “Deep Brain Stimulation and Drug-Resistant Epilepsy: A Review of the Literature,” Front. Neurol, vol. 10, 2019, Accessed: Jan. 16, 2022. [Online]. Available: https://www.frontiersin.org/article/10.3389/fneur.2019.00601 - DOI - PMC - PubMed

Publication types

LinkOut - more resources