. 2022 Sep 9;101(36):e30280.
doi: 10.1097/MD.0000000000030280.

Identification of an endoplasmic reticulum stress-associated gene signature to predict the immune status and prognosis of cutaneous melanoma

Affiliations

Identification of an endoplasmic reticulum stress-associated gene signature to predict the immune status and prognosis of cutaneous melanoma

Rong Chen et al. Medicine (Baltimore). .

Abstract

Besides protecting normal cells from various internal and external perturbations, endoplasmic reticulum (ER) stress is also directly related to the pathogenesis of cutaneous melanoma (CM). However, due to the lack of specific molecular biomarkers, ER stress has not been considered a novel treatment target for CM. Here, we identified ER stress-related genes involved in the prognosis of CM patients and constructed an effective model for the prognostic prediction of these patients. First, gene expression data of CM and normal skin tissues from the Genotype-Tissue Expression (GTEx) and The Cancer Genome Atlas (TCGA) databases were retrieved to identify differentially expressed ER stress-related genes in CM. Meanwhile, an independent cohort obtained from the Gene Expression Omnibus (GEO) database was used for validation. The ER stress genes (ZBP1, DIABLO, GNLY, FASLG, AURKA, TNFRSF21, and CD40LG) that were associated with CM prognosis were incorporated into our prognostic model. The functional analyses indicated that the prognostic model was correlated with patient survival, gender, and cancer growth. Multivariate and univariate Cox regressions revealed that the constructed model could serve as an independent prognostic factor for CM patients. The pathway enrichment analysis showed that the risk model was enriched in different immunity and cancer progression-associated pathways. Moreover, the signature model was significantly connected with the immune subtypes, infiltration of immune cells, immune microenvironment, as well as tumor stem cells. The gene function analysis revealed that 7 ER stress genes were differentially expressed in CM patients and were significantly associated with prognosis and several antitumor drugs. Overall, our current model presented predictive value for the prognosis of CM patients and can be further used in the development of novel therapeutic strategies for CM.


Conflict of interest statement

The authors declare that they have no competing interests.

Figures
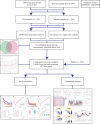
Figure 1.
Figure 1.
Schema of the study.
Figure 2.
Figure 2.
Identification of candidate prognostic DEGs in TCGA-CM cohort. (A) Venn diagram of ER-related genes determined by differential expression and univariate Cox analyses. (B) Heatmap of candidate prognostic DEGs in TCGA-CM cohort. (C) Forest plots of correlations between candidate prognostic DEGs and overall survival of patients in TCGA-CM cohort. (D) Correlation network of candidate prognostic DEGs.
Figure 3.
Figure 3.
Prognostic analysis of risk signature. Risk score distribution (A, C) and survival status (B, D) of TCGA-CM and GEO cohorts, respectively. PCA plot (E) and t-SNE (F) analysis of TCGA-CM cohort. PCA plot (G) and t-SNE (H) analysis of validation cohort. (I) Survival curve of the TCGA cohort. (J) TimeROC curves to forecast overall survival of patients from TCGA-CM cohort. (K) Survival curve of validation cohort. (L) TimeROC curves to forecast overall survival of patients in validation cohort.
Figure 4.
Figure 4.
Associations between risk signature and clinicopathological factors. Univariate (A) and multivariate Cox (B) regression of clinicopathological features in TCGA-CM cohort. Correlations between risk scores and gender (C) and T stage (D) in TCGA-CM cohort.
Figure 5.
Figure 5.
Potential role of risk signature in CM immune status, tumor stemness, and m6A-related genes. Boxplots of scores of immune cells (A) and immune-associated functions (B) in risk subgroups of TCGA-CM cohort. Boxplots of scores for immune cells (C) and immune-associated functions (D) in risk subgroups of validation cohort. (E) Heatmap for immune responses based on EPIC, XCELL, MCP counter, QUANTISEQ, CIBERSORT, and TIMER among 2 risk subgroups. Associations between risk signature and immune checkpoints (F), immune infiltration subtypes (G), stromal scores (H), immune scores (I), RNAss (J), DNAss (K), and m6A-related genes (L).
Figure 6.
Figure 6.
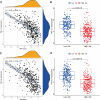
Associations between risk signature and immune checkpoints. Expression levels of genes PD-L1 (A) and PD-L2 (C) in risk subgroups. Correlation analysis between risk score, PD-L1 (B), and PD-L2 (D).
Figure 7.
Figure 7.
Functional enrichment analysis. (A, B) GO enrichment terms of hub ER genes in CC, BP, and MF. (C, D) KEGG enrichment terms of hub ER genes. (E) Gene Set Enrichment Analysis of top 10 enriched pathways in risk signature.
Figure 8.
Figure 8.
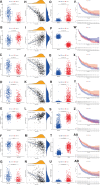
Roles of ER stress genes in risk signature and CM prognosis. Expression of ZBP1 (A), DIABLO (B), GNLY (C), FASLG (D), AURKA (E), TNFRSF21 (F), and CD40LG (G) genes in risk subgroups. Correlations between risk signature and ZBP1 (H), DIABLO (I), GNLY (J), FASLG (K), AURKA (L), TNFRSF21 (M), and CD40LG (N) genes. Expression of ZBP1 (O), DIABLO (P), GNLY (Q), FASLG (R), AURKA (S), TNFRSF21 (T), and CD40LG (U) genes in CM. Kaplan–Meier curves of TCGA-CM cohort verify prognostic value of ZBP1 (V), DIABLO (W), GNLY (X), FASLG (Y), AURKA (Z), TNFRSF21 (AA), and CD40LG (AB).
Figure 9.
Figure 9.
Scatter plots of top 16 classes of associations between ER stress genes and drug sensitivity.

References

    1. Ekwueme DU, Guy GP, Jr., Li C, et al. . The health burden and economic costs of cutaneous melanoma mortality by race/ethnicity-United States, 2000 to 2006. J Am Acad Dermatol. 2011;65(5 Suppl 1):S133–43. - PubMed
    1. Kanavy HE, Gerstenblith MR. Ultraviolet radiation and melanoma. Semin Cutan Med Surg. 2011;30:222–8. - PubMed
    1. Pawlikowska M, Piotrowski J, Jędrzejewski T, et al. . Coriolus versicolor-derived protein-bound polysaccharides trigger the caspase-independent cell death pathway in amelanotic but not melanotic melanoma cells. Phytother Res. 2020;34:173–83. - PubMed
    1. Slominski A, Kim TK, Brożyna AA, et al. . The role of melanogenesis in regulation of melanoma behavior: melanogenesis leads to stimulation of HIF-1α expression and HIF-dependent attendant pathways. Arch Biochem Biophys. 2014;563:79–93. - PMC - PubMed
    1. Brożyna AA, Jóźwicki W, Carlson JA, et al. . Melanogenesis affects overall and disease-free survival in patients with stage III and IV melanoma. Hum Pathol. 2013;44:2071–4. - PMC - PubMed