. 2022 Oct;21(10):e13707.
doi: 10.1111/acel.13707. Epub 2022 Sep 10.

The lysosomal proteome of senescent cells contributes to the senescence secretome

Affiliations

The lysosomal proteome of senescent cells contributes to the senescence secretome

Miguel Rovira et al. Aging Cell. 2022 Oct.

Abstract

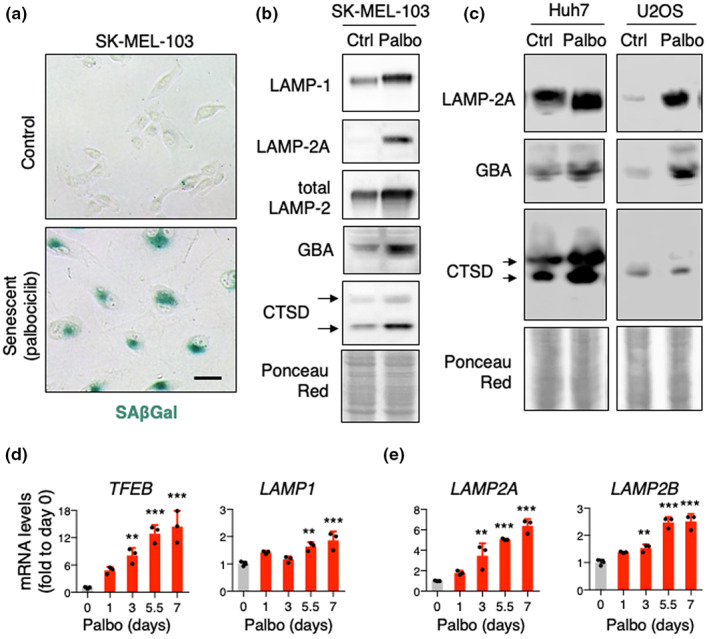
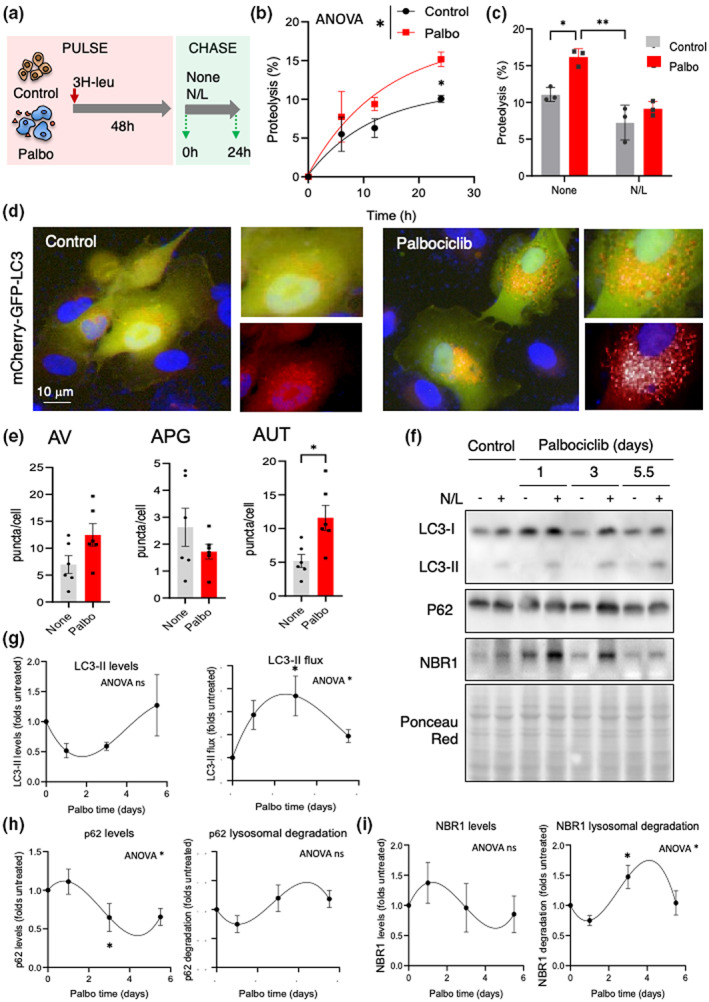
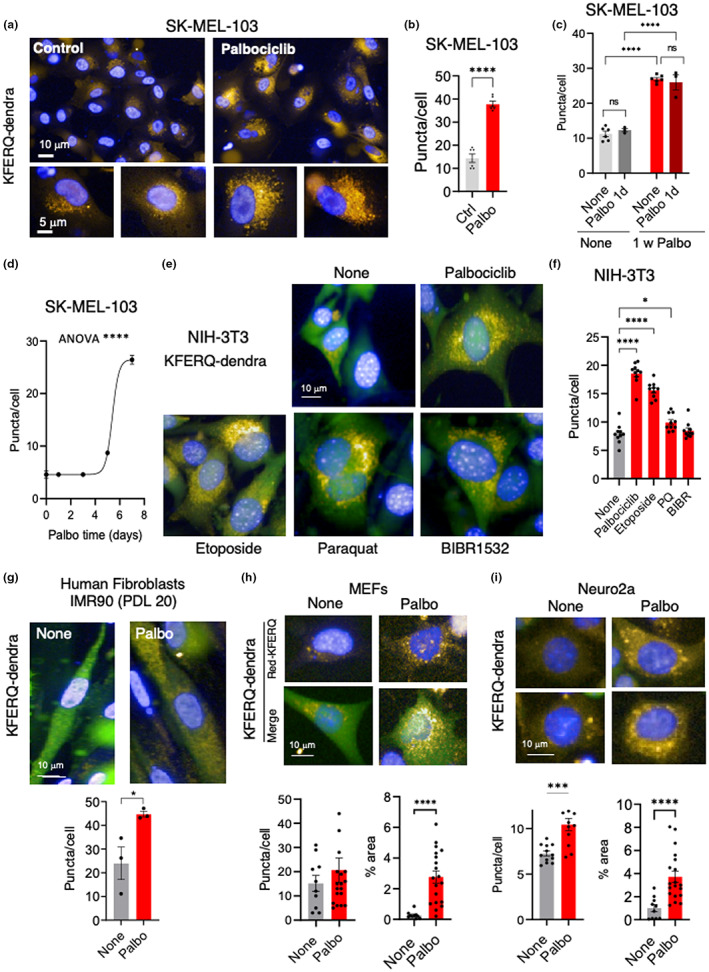
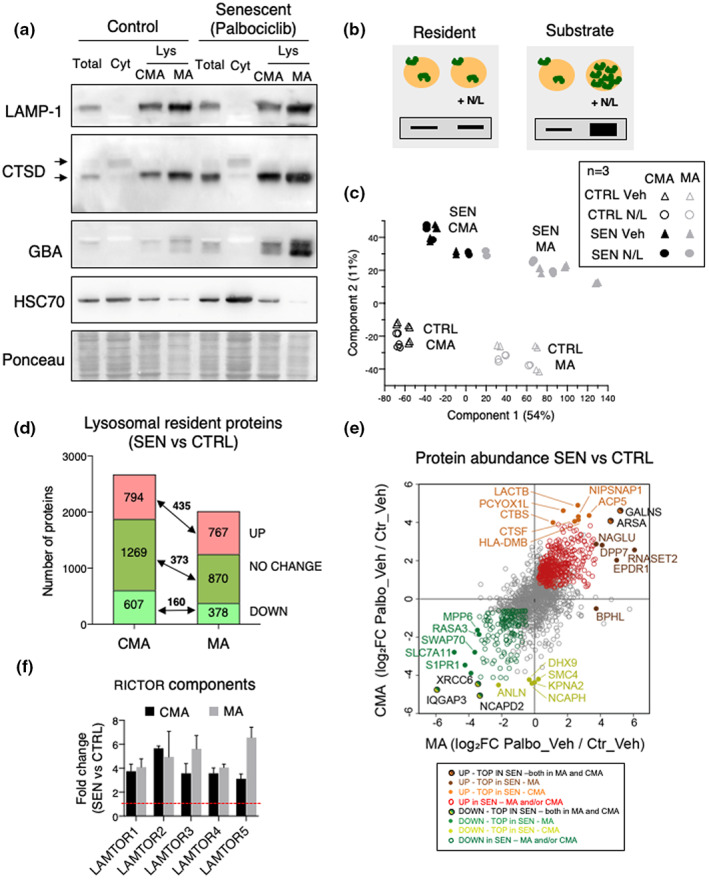
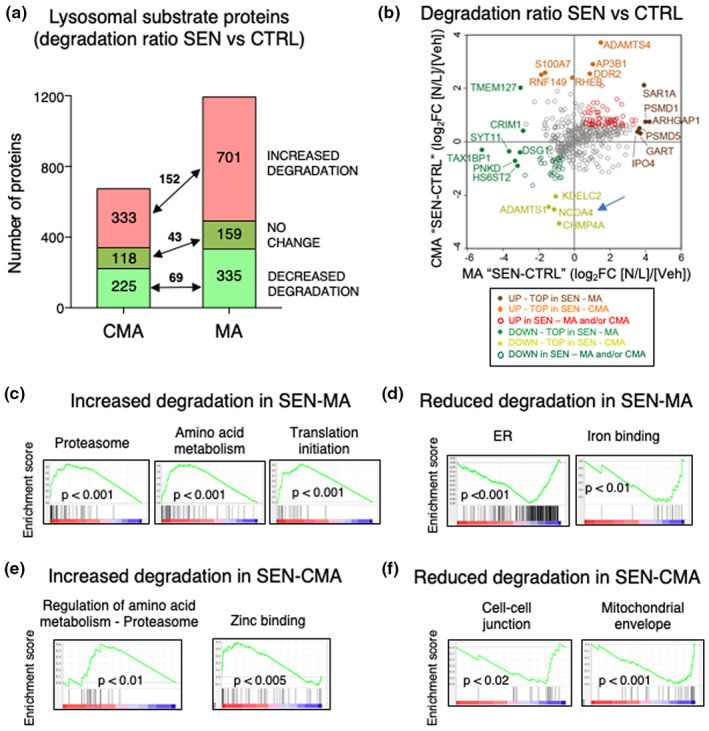
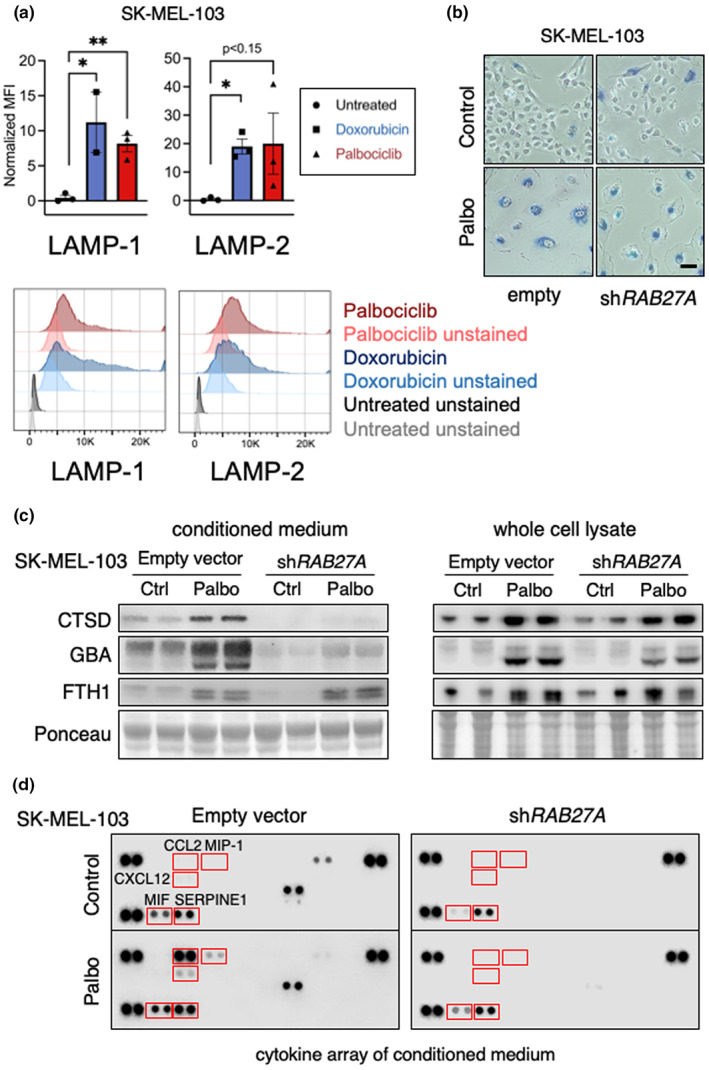
Senescent cells accumulate in tissues over time, favoring the onset and progression of multiple age-related diseases. Senescent cells present a remarkable increase in lysosomal mass and elevated autophagic activity. Here, we report that two main autophagic pathways macroautophagy (MA) and chaperone-mediated autophagy (CMA) are constitutively upregulated in senescent cells. Proteomic analyses of the subpopulations of lysosomes preferentially engaged in each of these types of autophagy revealed profound quantitative and qualitative changes in senescent cells, affecting both lysosomal resident proteins and cargo proteins delivered to lysosomes for degradation. These studies have led us to identify resident lysosomal proteins that are highly augmented in senescent cells and can be used as novel markers of senescence, such as arylsulfatase ARSA. The abundant secretome of senescent cells, known as SASP, is considered their main pathological mediator; however, little is known about the mechanisms of SASP secretion. Some secretory cells, including melanocytes, use the small GTPase RAB27A to perform lysosomal secretion. We found that this process is exacerbated in the case of senescent melanoma cells, as revealed by the exposure of lysosomal membrane integral proteins LAMP1 and LAMP2 in their plasma membrane. Interestingly, a subset of SASP components, including cytokines CCL2, CCL3, CXCL12, cathepsin CTSD, or the protease inhibitor SERPINE1, are secreted in a RAB27A-dependent manner in senescent melanoma cells. Finally, proteins previously identified as plasma biomarkers of aging are highly enriched in the lysosomes of senescent cells, including CTSD. We conclude that the lysosomal proteome of senescent cells is profoundly reconfigured, and that some senescent cells can be highly active in lysosomal exocytosis.

Keywords: SASP; aging; autophagy; cellular senescence; exocytosis; lysosome.


Conflict of interest statement

A.M.C. is co‐founder of Selphagy Therapeutics (now under LifeBiosciences, Boston, MA, USA) and consults for Generian Therapeutics and Cognition. M.S. is shareholder and advisor of Senolytic Therapeutics, Inc., Rejuveron Senescence Therapeutics, AG, and Altos Labs, Inc; and is shareholder of Life Biosciences, Inc. The funders had no role in study design, data collection and analysis, decision to publish, or preparation of the manuscript.

Figures

FIGURE 1
FIGURE 1
Characterization of the lysosomal system in senescence. (a) Representative SAβGal staining pictures of SK‐MEL‐103 cells treated with 2 μM palbociclib for 1 week. Scale bar 50 μM. (b) Western blot analysis for LAMP1, LAMP2A, LAMP2, GBA, and CTSD in SK‐MEL‐103 cells. Arrows indicate precursor and mature CTSD. Ponceau staining is shown as loading control. (c) Western blot analysis for LAMP2A, GBA, and CTSD in Huh7 and U2OS cells treated with 2 μM palbociclib for 1 week. Ponceau staining is shown as loading control. (d, e) mRNA levels of TFEB, LAMP1 (d) and LAMP2A, LAMP2B (e) in SK‐MEL‐103 cells treated with 2 μM palbociclib at the indicated timepoints. ACTB, 18S rRNA, and B2M were used for input normalization (mean of the three housekeepers). Values are relative to control cells and are expressed as mean ± SD, and statistical significance was assessed by one‐way ANOVA and Dunnett's multiple comparisons test (versus control group). *p < 0.05
FIGURE 2
FIGURE 2
Upregulation of MA in senescent cells. (a) Scheme of the assay to determine proteolytic rates of long‐lived proteins in control and palbociclib‐treated cells and analysis of lysosomal contribution to degradation. (b) Protein degradation rates of long‐lived proteins in control and 7 days palbociclib‐treated SK‐MEL‐103 cells. Values are mean ± SEM and are expressed as percentage proteolysis. n = 3 in two different experiments. Statistical significance was assessed by two‐way ANOVA and Sidak's multiple comparisons test. Differences among time points were significant for p < 0.0001 and between control and palbociclib‐treated cells (shown in the legend) for p < 0.05. (c) Percentage of proteolysis of long‐lived proteins in the cells in (b) after 24 h of culture without additions (None) or in presence of ammonium chloride and leupeptine (N/L). Statistical significance was assessed by two‐way ANOVA and Tukey's multiple comparisons test (versus control group). Differences between control and palbociclib‐treated cells and between None and N/L are shown in the figure. (d) Representative images of control and 7 days palbociclib‐treated SK‐MEL‐103 cells stably transduced with a lentivirus expressing the tandem reporter mCherry‐GFP‐LC3 to monitor autophagic flux. Insets: higher magnification of merged channels or red channel. Nuclei are highlighted with DAPI. (e) Quantification of autophagic vacuoles (AV, combination of autophagosomes (APG) and autolysosomes (AUT)) (left), APG (mCherry+ GFP+ vesicles) (middle) and AUT (mCherry+ GFP vesicles) (right) in cells as in (d. Values are expressed as puncta per cell section and are individual values and mean ± SEM. n = 6 experiments with >1200 cells/condition. Statistical significance was assessed by the two‐tailed Student's t‐test (versus control group). (f–i) Representative immunoblot for the indicated proteins (f) and densitometric quantification of steady‐state values (left) or lysosomal degradation for LC3‐II (g), p62 (h), and NBR1 (i) in SK‐MEL‐103 cells at the indicated days after addition of palbociclib (2 μM) to the media. Cells were supplemented with ammonium chloride and leupeptin (N/L) for 4 h where indicated (+). Ponceau red staining is shown as loading control. Quantifications are shown as folds of the cells no supplemented with palbociclib (Control) and values are mean ± SEM (n = 3 experiments). Statistical significance was assessed by the one‐way ANOVA and Tukey's multiple comparisons test (versus control untreated). Significant differences by ANOVA are indicated in the graph and differences with time 0 at specific time points in the graph.
FIGURE 3
FIGURE 3
Upregulation of CMA in senescent cells. (a) Representative images of control and 7 days palbociclib‐treated SK‐MEL‐103 cells stably transduced with a lentivirus expressing a KFERQ‐dendra reporter to monitor CMA activity. Cells were photoswitched, and fluorescence in the red channel (pseudocolored in yellow, in consideration for color‐blind readers) was monitored using high‐content miscroscopy. Insets: higher magnification of red channel images. Nuclei are highlighted with DAPI. (b) Quantification of changes in the mean number of puncta per cell section quantified with high‐content microscopy. All values are individual values and mean ± SEM of six separate wells for each condition, and quantifications were done in at least 2500 cells per condition. Statistical significance was assessed by the two‐tailed Student's t‐test. (c) Quantification of changes in the mean number of puncta per cell section of control and 7 days palbociclib‐treated SK‐MEL‐103 cells 1 day after the addition of a single doses of palbociclib. All values are individual values and mean ± SEM of six separate wells for each condition, and quantifications were done in at least 2500 cells per condition. Statistical significance was assessed by the two‐way ANOVA and Sidak's multiple comparisons test (versus control group). (d) Time course of CMA activity calculated in SK‐MEL‐103 cells expressing the KFERQ‐dendra reporter at the indicated times after addition of pablobiclib. Values are expressed as puncta per cell section and are mean ± SEM of three separate wells for each condition, and quantifications were done in >2500 cells per condition. Statistical significance was assessed by the one‐way ANOVA and Dunnett's multiple comparisons test. (e) Representative images of NIH 3T3 cells stably transduced with a lentivirus expressing a KFERQ‐dendra reporter to monitor CMA activity 7 days after the indicated treatments. Cells were photoswitched and imaged with high‐content microscopy as in (a). Merged images of fluorescence in the green and red (pseudocolored in yellow) channels are shown. Nuclei are highlighted with DAPI. (f) Quantification of changes in the mean number of puncta per cell section in cells in (e). All values are individual values and mean ± SEM. Quantifications were done in >600 cells/condition in 3 independent experiments. Statistical significance was assessed by the one‐way ANOVA and Dunnett's multiple comparisons test. (g) Representative images of primary human fibroblasts (IMR90 cells at population doubling level (PDL) 20) transduced with a lentivirus expressing a KFERQ‐dendra reporter to monitor CMA activity 7 days after exposure to palbociclib. Cells were photoswitched and imaged by high‐content microscopy. Bottom: Quantification of changes in the mean number of fluorescent puncta per cell. All values are mean ± SEM and individual values of >50 cells/condition in 3 independent experiments. Statistical significance was assessed by the unpaired t‐test. (h) Similar studies as in (g) but using primary mouse embryonic fibroblasts (MEFs) and high‐content microscopy. Red channel (top) and merged green and red channels (bottom) are shown. Bottom: Quantification of changes in the mean number of fluorescent puncta per cell (left) or in the percentage of cellular area occupied by fluorescent puncta (right). All values are mean ± SEM and individual values. Quantifications were done in >100 cells/condition in 10 independent wells. Statistical significance was assessed by the unpaired t‐test. (i) Similar studies as in (g) but using a neuroblastoma cell line. Examples of two cells for each condition in the red channel (pseudocolored in yellow) are shown. Bottom: Quantification as in (h) was done in >1000 cells/condition in 10 independent wells. Statistical significance was assessed by the unpaired t‐test. ****p < 0.0001, ***p < 0.001, **p < 0.01, *p < 0.05.
FIGURE 4
FIGURE 4
Lysosomal isolation and mass spectrometry analysis of constitutive resident proteins. (a) Western blot analysis for LAMP1, LAMP2A, CTSD, GBA, and HSC70 in homogenate (Total), cytosol (Cyt), and lysosomes (Lys) with high CMA activity (CMA) or high MA activity (MA) isolated from control or palbociclib‐treated SK‐MEL‐103 cells. Arrows indicate precursor and mature form. Ponceau staining is shown as loading control. (b) Scheme of the hypothetical changes in levels of proteins in lysosomes treated or not with ammonium chloride and leupeptin (N/L) 16 h before isolation. Proteins are classified depending on these changes as degraded (lysosomal substrates) if they accumulate upon N/L treatment, or constitutive (resident proteins) if they do not accumulate upon N/L treatment. (c) Principal component analysis (PCA) of the CMA and MA lysosome samples, n = 3 with two technical replicates each. (d) Changes in abundance of the lysosomal constitutive proteins in CMA and MA lysosomes. Constitutive proteins were defined as those that do not change significantly p > 0.05 in N/L versus vehicle or that have a negative log2 fold change N/L versus vehicle. (e) Top lysosomal resident proteins found at higher or lower levels in CMA and MA lysosomes. (f) Fold change (over control) in protein levels of TOR protein components found in both CMA and MA lysosomes.
FIGURE 5
FIGURE 5
Validation of elevated levels of resident lysosomal proteins in whole‐cell extracts. (a) Immunoblot of ARSA (arylsulfatase A) in total cell homogenates from control or palbociclib‐treated (palbo) SK‐MEL‐103, treated or not with ammonium chloride and leupeptin (N/L) 16 h before cell lysis, as indicated. Quantification of three biological independent replicates (n = 3) (top) and representative immunoblot (bottom). ***p < 0.001, **p < 0.01, *p < 0.05, 2‐way ANOVA test. (b) Immunoblot of NAGLU (N‐acetyl‐alpha‐glucosaminidase), same as in panel (a). (c) Immunoblot of EPDR1 (ependymin related 1), same as in panel (a). (d) Immunoblot of CTSF (cathepsin F), same as in panel (a). (e) Immunoblot of HLA‐DMB (beta subunit of MHC‐II DM), same as in panel (a). (f) Immunoblot of IMR90‐ER:RAS from control and senescent cells. Senescence was induced by irradiation (20 Gy, 2 weeks) or by addition of tamoxifen (1 μM, 3 weeks).
FIGURE 6
FIGURE 6
Mass spectrometry analysis of lysosomal substrate proteins. (a) Proteins degraded at higher or lower rates in CMA and MA lysosomes from senescent cells. Substrate proteins were defined as those that accumulate significantly upon N/L treatment, that is, log2 fold change N/L versus vehicle >0.21 (fold >1.1) and p value <0.05. Red, substrate proteins that display increase degradation rates in senescence were defined as those either exclusively degraded in senescent cells, or degraded in both, but with a degradation fold change ≥0.6. Dark green, substrate proteins degraded with a similar rate in both conditions (degradation fold change <0.6 and >−0.6). Light green, substrate proteins that display lower degradation in senescence were defined as those exclusively degraded in control, or with a degradation fold change ≤−0.6. (b) Top lysosomal substrate proteins displaying higher or lower rates of lysosomal degradation in CMA and MA lysosomes. (c) GSEA plots of the top c5 GO terms gene sets that were significantly enriched in the proteins displaying increased degradation by MA lysosomes in senescence. (d) Same as in (c) but showing gene sets that were significantly enriched in the proteins displaying lower degradation by MA lysosomes in senescent cells. (e) Same as in (c) but showing gene sets that were significantly enriched in the proteins displaying increased degradation by CMA lysosomes in senescence. (f) Same as in (c) but showing gene sets that were significantly enriched in the proteins displaying decreased degradation in CMA lysosomes in senescent cells.
FIGURE 7
FIGURE 7
Analysis of lysosomal secretion in senescence. (a) Flow cytometry analysis of LAMP1 and LAMP2 in the surface of alive, non‐permeabilized SK‐MEL‐103 cells, treated or not with 100 nM doxorubicin or 5 μM palbociclib for 1 week. Top, values for three independent biological replicates (n = 3), mean ± SD. Due to sample limitation, n = 2 in cells treated with doxorubicin and stained for LAMP1. Statistical significance was determined using the unpaired t‐test. *p < 0.05, Bottom, example of one flow cytometry assay. (b) SA‐βGal staining pictures of SK‐MEL‐103 cells carrying empty vector or shRAB27A, treated or not with 2 μM palbociclib for 1 week. Scale bar 50 μM. (c) Western blot analysis for CTSD, GBA, and FTH1 in the CM (left) and whole‐cell lysates (right) of SK‐MEL‐103 cells, proliferative or senescent (palbociclib) carrying empty vector or shRAB27A. (d) Cytokine profile of the CM from SK‐MEL‐103 cells carrying empty vector or shRAB27A, treated or not with palbociclib.

References

    1. Auteri, J. S. , Okada, A. , Bochaki, V. , & Fred Dice, J. (1983). Regulation of intracellular protein degradation in IMR90 human diploid fibroblasts. Journal of Cellular Physiology, 115, 167–174. - PubMed
    1. Bahadoran, P. , Aberdam, E. , Mantoux, F. , Buscà, R. , Bille, K. , Yalman, N. , de Saint‐Basile, G. , Casaroli‐Marano, R. , Ortonne, J.‐P. , & Ballotti, R. (2001). Rab27a: A key to melanosome transport in human melanocytes. The Journal of Cell Biology, 152, 843–850. - PMC - PubMed
    1. Basisty, N. , Kale, A. , Jeon, O. H. , Kuehnemann, C. , Payne, T. , Rao, C. , Holtz, A. , Shah, S. , Sharma, V. , Ferrucci, L. , Campisi, J. , & Schilling, B. (2020). A proteomic atlas of senescence‐associated secretomes for aging biomarker development. PLoS Biology, 18, e3000599. - PMC - PubMed
    1. Blott, E. J. , & Griffiths, G. M. (2002). Secretory lysosomes. Nature Reviews. Molecular Cell Biology, 3, 122–131. - PubMed
    1. Bourdenx, M. , Martín‐Segura, A. , Scrivo, A. , Rodriguez‐Navarro, J. A. , Kaushik, S. , Tasset, I. , Diaz, A. , Storm, N. J. , Xin, Q. , Juste, Y. R. , Stevenson, E. , Luengo, E. , Clement, C. C. , Choi, S. J. , Krogan, N. J. , Mosharov, E. V. , Santambrogio, L. , Grueninger, F. , Collin, L. , … Cuervo, A. M. (2021). Chaperone‐mediated autophagy prevents collapse of the neuronal metastable proteome. Cell, 184, 2696–2714.e25. - PMC - PubMed

Publication types