Head-to-head comparison of 10 plasma phospho-tau assays in prodromal Alzheimer's disease
- PMID: 36087307
- PMCID: PMC10115176
- DOI: 10.1093/brain/awac333
Head-to-head comparison of 10 plasma phospho-tau assays in prodromal Alzheimer's disease
Abstract
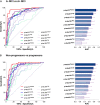
Plasma phospho-tau (p-tau) species have emerged as the most promising blood-based biomarkers of Alzheimer's disease. Here, we performed a head-to-head comparison of p-tau181, p-tau217 and p-tau231 measured using 10 assays to detect abnormal brain amyloid-β (Aβ) status and predict future progression to Alzheimer's dementia. The study included 135 patients with baseline diagnosis of mild cognitive impairment (mean age 72.4 years; 60.7% women) who were followed for an average of 4.9 years. Seventy-one participants had abnormal Aβ-status (i.e. abnormal CSF Aβ42/40) at baseline; and 45 of these Aβ-positive participants progressed to Alzheimer's dementia during follow-up. P-tau concentrations were determined in baseline plasma and CSF. P-tau217 and p-tau181 were both measured using immunoassays developed by Lilly Research Laboratories (Lilly) and mass spectrometry assays developed at Washington University (WashU). P-tau217 was also analysed using Simoa immunoassay developed by Janssen Research and Development (Janss). P-tau181 was measured using Simoa immunoassay from ADxNeurosciences (ADx), Lumipulse immunoassay from Fujirebio (Fuji) and Splex immunoassay from Mesoscale Discovery (Splex). Both p-tau181 and p-tau231 were quantified using Simoa immunoassay developed at the University of Gothenburg (UGOT). We found that the mass spectrometry-based p-tau217 (p-tau217WashU) exhibited significantly better performance than all other plasma p-tau biomarkers when detecting abnormal Aβ status [area under curve (AUC) = 0.947; Pdiff < 0.015] or progression to Alzheimer's dementia (AUC = 0.932; Pdiff < 0.027). Among immunoassays, p-tau217Lilly had the highest AUCs (0.886-0.889), which was not significantly different from the AUCs of p-tau217Janss, p-tau181ADx and p-tau181WashU (AUCrange 0.835-0.872; Pdiff > 0.09), but higher compared with AUC of p-tau231UGOT, p-tau181Lilly, p-tau181UGOT, p-tau181Fuji and p-tau181Splex (AUCrange 0.642-0.813; Pdiff ≤ 0.029). Correlations between plasma and CSF values were strongest for p-tau217WashU (R = 0.891) followed by p-tau217Lilly (R = 0.755; Pdiff = 0.003 versus p-tau217WashU) and weak to moderate for the rest of the p-tau biomarkers (Rrange 0.320-0.669). In conclusion, our findings suggest that among all tested plasma p-tau assays, mass spectrometry-based measures of p-tau217 perform best when identifying mild cognitive impairment patients with abnormal brain Aβ or those who will subsequently progress to Alzheimer's dementia. Several other assays (p-tau217Lilly, p-tau217Janss, p-tau181ADx and p-tau181WashU) showed relatively high and consistent accuracy across both outcomes. The results further indicate that the highest performing assays have performance metrics that rival the gold standards of Aβ-PET and CSF. If further validated, our findings will have significant impacts in diagnosis, screening and treatment for Alzheimer's dementia in the future.
Keywords: Alzheimer’s disease; amyloid-β; blood p-tau; dementia.
© The Author(s) 2022. Published by Oxford University Press on behalf of the Guarantors of Brain.
Conflict of interest statement
H.Z. has served at scientific advisory boards and/or as a consultant for Abbvie, Alector, ALZPath, Annexon, Apellis, Artery Therapeutics, AZTherapies, CogRx, Denali, Eisai, Nervgen, Novo Nordisk, Pinteon Therapeutics, Red Abbey Labs, reMYND, Passage Bio, Roche, Samumed, Siemens Healthineers, Triplet Therapeutics and Wave, has given lectures in symposia sponsored by Cellectricon, Fujirebio, Alzecure, Biogen and Roche, and is a co-founder of Brain Biomarker Solutions in Gothenburg AB (BBS), which is a part of the GU Ventures Incubator Program (outside submitted work). K.B. has served as a consultant, at advisory boards, or at data monitoring committees for Abcam, Axon, BioArctic, Biogen, JOMDD/Shimadzu. Julius Clinical, Lilly, MagQu, Novartis, Ono Pharma, Pharmatrophix, Prothena, Roche Diagnostics and Siemens Healthineers, and is a co-founder of Brain Biomarker Solutions in Gothenburg AB (BBS), which is a part of the GU Ventures Incubator Program (outside submitted work). R.J.B. has received research funding from Avid Radiopharmaceuticals, Janssen, Roche/Genentech, Eli Lilly, Eisai, Biogen, AbbVie, Bristol Myers Squibb and Novartis. Washington University and R.J.B. have equity ownership interest in C2N Diagnostics. R.J.B. and N.R.B. receive income based on technology (blood plasma assay, and methods of diagnosing Alzheimer’s disease with phosphorylation changes) licensed by Washington University to C2N Diagnostics. R.J.B. receives income from C2N Diagnostics for serving on the scientific advisory board. R.J.B. serves on the Roche Gantenerumab Steering Committee as an unpaid member. M.J.P. is an employee of Avid radiopharmaceuticals, a wholly owned subsidiary of Eli Lilly and Company, and is a minor stockholder in Eli Lilly. O.H. has acquired research support (for the institution) from ADx, AVID Radiopharmaceuticals, Biogen, Eli Lilly, Eisai, Fujirebio, GE Healthcare, Pfizer and Roche. In the past 2 years, he has received consultancy/speaker fees from AC Immune, Amylyx, Alzpath, BioArctic, Biogen, Cerveau, Fujirebio, Genentech, Novartis, Roche and Siemens. The rest of authors do not report any disclosures. G.T.B. and H.K. are employees of Janssen Research and Development. J.V. and E.S. are employees of ADx NeuroSciences. E.V.M. is a co-founder of ADx NeuroSciences. M.V. is an employee of Fujirebio Europe N.V.
Figures


References
-
- Scheltens P, Blennow K, Breteler MM, et al. Alzheimer's disease. Lancet. 2016;388:505–517. - PubMed
-
- Blennow K, Mattsson N, Scholl M, Hansson O, Zetterberg H. Amyloid biomarkers in Alzheimer's disease. Trends Pharmacol Sci. 2015;36:297–309. - PubMed
-
- Hansson O. Biomarkers for neurodegenerative diseases. Nat Med. 2021;27:954–963. - PubMed
-
- Ossenkoppele R, van der Kant R, Hansson O. Tau biomarkers in Alzheimer’s disease: towards implementation in clinical practice and trials. Rapid Review. Lancet Neurol. 2022;21:726–734. - PubMed
-
- Blennow K. Phenotyping Alzheimer's disease with blood tests. Science. 2021;373:626–628. - PubMed
Publication types
MeSH terms
Substances
Grants and funding
LinkOut - more resources
Full Text Sources
Other Literature Sources
Medical

