

Brain-age is associated with progression to dementia in memory clinic patients
- PMID: 36087560
- PMCID: PMC9467894
- DOI: 10.1016/j.nicl.2022.103175
Brain-age is associated with progression to dementia in memory clinic patients
Abstract
Background: Biomarkers for the early detection of dementia risk hold promise for better disease monitoring and targeted interventions. However, most biomarker studies, particularly in neuroimaging, have analysed artificially 'clean' research groups, free from comorbidities, erroneous referrals, contraindications and from a narrow sociodemographic pool. Such biases mean that neuroimaging samples are often unrepresentative of the target population for dementia risk (e.g., people referred to a memory clinic), limiting the generalisation of these studies to real-world clinical settings. To facilitate better translation from research to the clinic, datasets that are more representative of dementia patient groups are warranted.
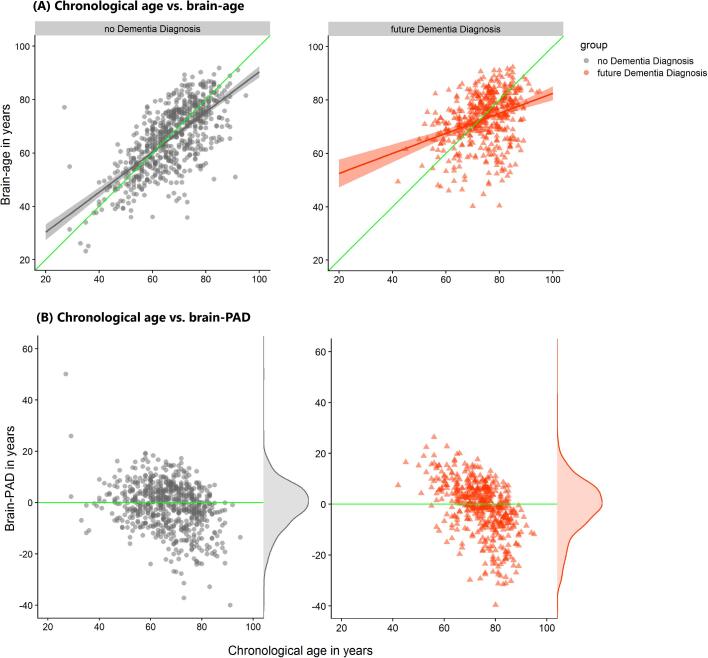
Methods: We analysed T1-weighted MRI scans from a real-world setting of patients referred to UK memory clinic services (n = 1140; 60.2 % female and mean [SD] age of 70.0[10.8] years) to derive 'brain-age'. Brain-age is an index of age-related brain health based on quantitative analysis of structural neuroimaging, largely reflecting brain atrophy. Brain-predicted age difference (brain-PAD) was calculated as brain-age minus chronological age. We determined which patients went on to develop dementia between three months and 7.8 years after neuroimaging assessment (n = 476) using linkage to electronic health records.
Results: Survival analysis, using Cox regression, indicated a 3 % increased risk of dementia per brain-PAD year (hazard ratio [95 % CI] = 1.03 [1.02,1.04], p < 0.0001), adjusted for baseline age, age2, sex, Mini Mental State Examination (MMSE) score and normalised brain volume. In sensitivity analyses, brain-PAD remained significant when time-to-dementia was at least 3 years (hazard ratio [95 % CI] = 1.06 [1.02, 1.09], p = 0.0006), or when baseline MMSE score ≥ 27 (hazard ratio [95 % CI] = 1.03 [1.01, 1.05], p = 0.0006).
Conclusions: Memory clinic patients with older-appearing brains are more likely to receive a subsequent dementia diagnosis. Potentially, brain-age could aid decision-making during initial memory clinic assessment to improve early detection of dementia. Even when neuroimaging assessment was more than 3 years prior to diagnosis and when cognitive functioning was not clearly impaired, brain-age still proved informative. These real-world results support the use of quantitative neuroimaging biomarkers like brain-age in memory clinics.
Keywords: Ageing; Brain-age; Dementia; Ecological validity; Electronic health records; Machine learning.
Copyright © 2022 The Authors. Published by Elsevier Inc. All rights reserved.
Conflict of interest statement
Declaration of Competing Interest JHC is a scientific advisor to and shareholder in Brain Key and Claritas HealthTech, both medical image analysis companies. The other authors declare that they have no known competing financial interests or personal relationships that could have appeared to influence the work reported in this paper.
Figures


References
-
- Academy of Medical Royal Colleges. Hospital_Episode_Statistics_quality_value_data_0511. 2011.
-
- Belleville S., Fouquet C., Hudon C., Zomahoun H.T.V., Croteau J. Consortium for the Early Identification of Alzheimer’s d-Q. Neuropsychological Measures that Predict Progression from Mild Cognitive Impairment to Alzheimer's type dementia in Older Adults: a Systematic Review and Meta-Analysis. Neuropsychol. Rev. 2017;27(4):328–353. - PMC - PubMed
-
- Broe G.A., Henderson A.S., Creasey H., McCusker E., Korten A.E., Jorm A.F., et al. A case-control study of Alzheimer’s disease in Australia. Neurology. 1990;40(11):1698–1707. - PubMed
MeSH terms
Substances
Grants and funding
LinkOut - more resources
Full Text Sources
Medical
