Randomized Controlled Trial
. 2022 Oct 4;34(10):1472-1485.e6.
doi: 10.1016/j.cmet.2022.08.001. Epub 2022 Sep 9.

Timing of daily calorie loading affects appetite and hunger responses without changes in energy metabolism in healthy subjects with obesity

Affiliations
Randomized Controlled Trial

Timing of daily calorie loading affects appetite and hunger responses without changes in energy metabolism in healthy subjects with obesity

Leonie C Ruddick-Collins et al. Cell Metab. .

Abstract

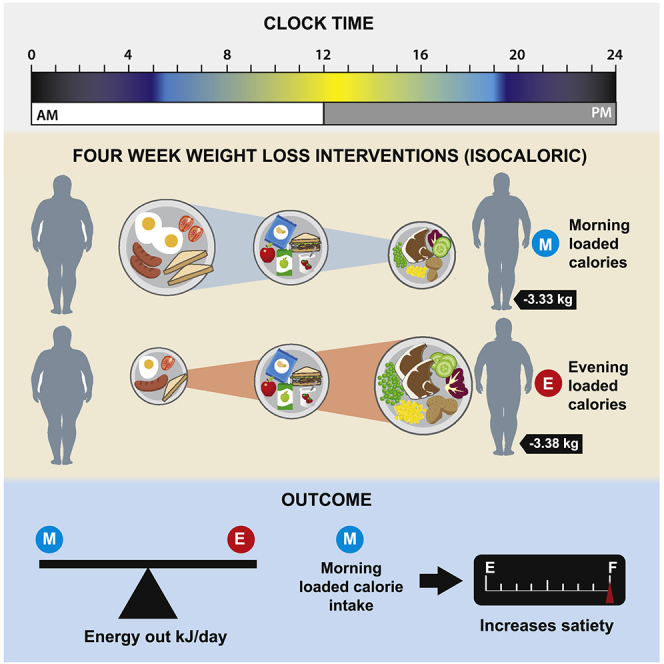
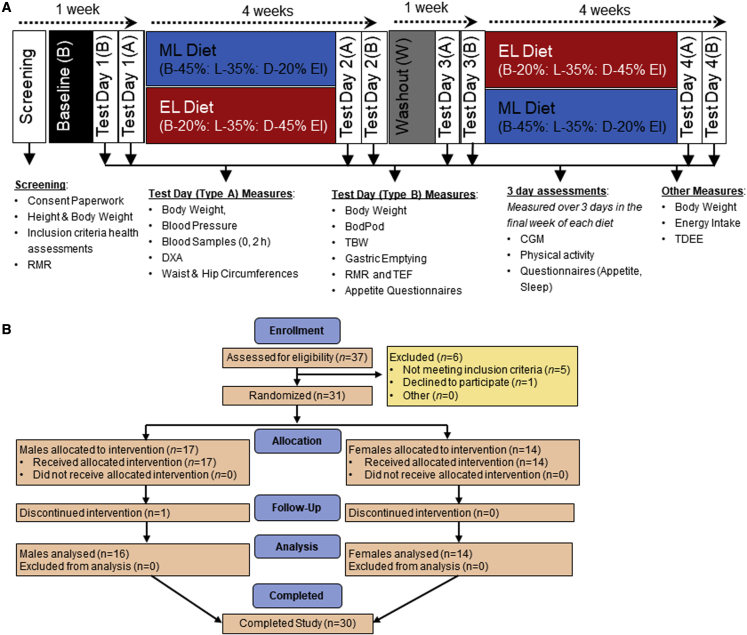
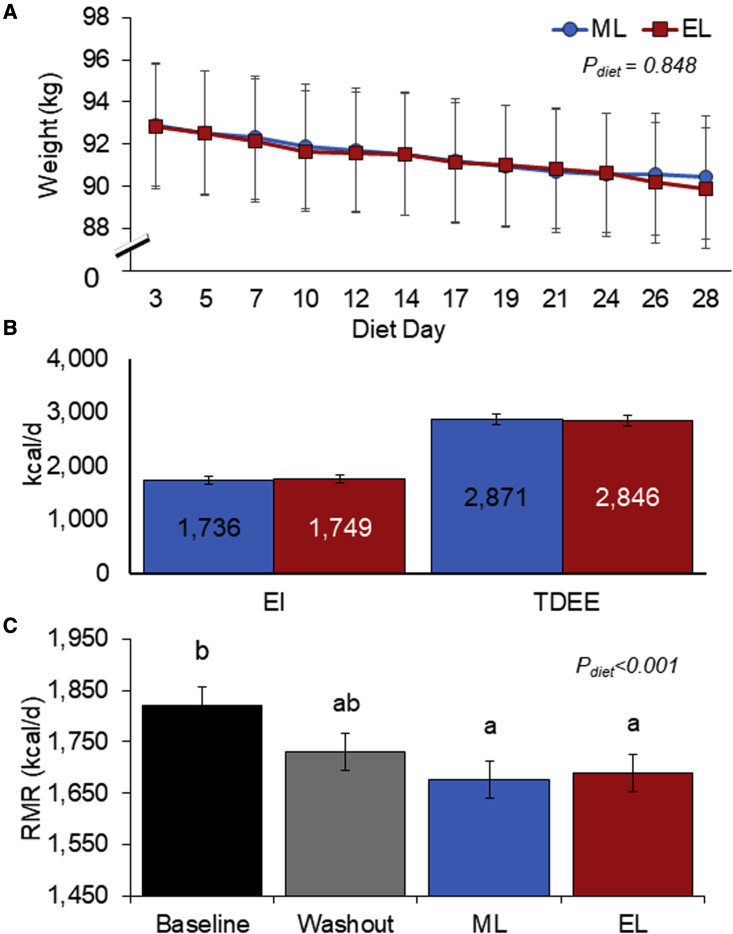
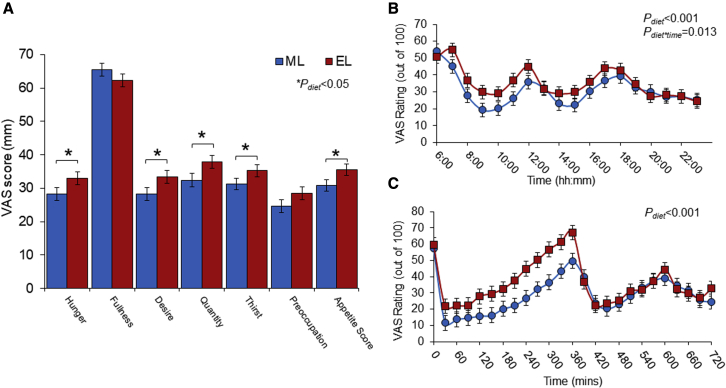
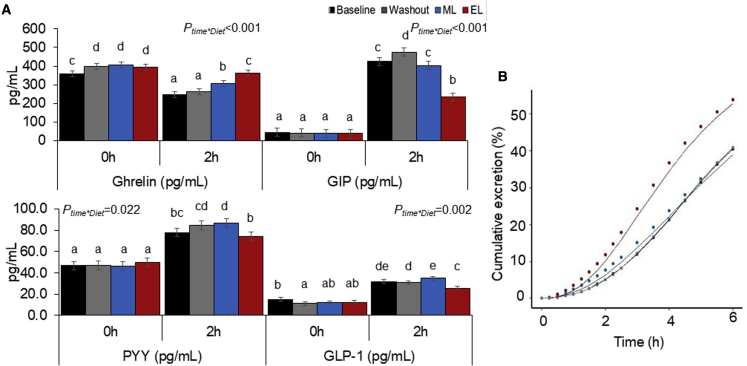
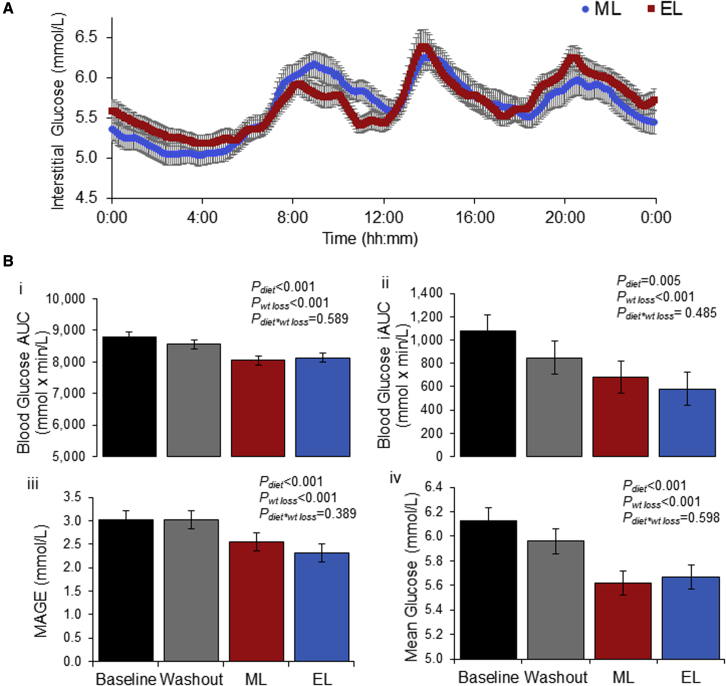
Morning loaded calorie intake in humans has been advocated as a dietary strategy to improve weight loss. This is also supported by animal studies suggesting time of eating can prevent weight gain. However, the underlying mechanisms through which timing of eating could promote weight loss in humans are unclear. In a randomized crossover trial (NCT03305237), 30 subjects with obesity/overweight underwent two 4-week calorie-restricted but isoenergetic weight loss diets, with morning loaded or evening loaded calories (45%:35%:20% versus 20%:35%:45% calories at breakfast, lunch, and dinner, respectively). We demonstrate no differences in total daily energy expenditure or resting metabolic rate related to the timing of calorie distribution, and no difference in weight loss. Participants consuming the morning loaded diet reported significantly lower hunger. Thus, morning loaded intake (big breakfast) may assist with compliance to weight loss regime through a greater suppression of appetite.

Keywords: appetite control; body weight; calorie distribution; chrono-nutrition; energy expenditure; energy intake; obesity; time of eating.


Conflict of interest statement

Declaration of interests J.D.J. has collaborated with Nestlé and has previously undertaken consultancy work for Kellogg’s.

Figures

None
Graphical abstract
Figure 1
Figure 1
Study design and CONSORT flow diagram (A) Study design. Prior to baseline, participants completed comprehensive in-lab screening to determine their eligibility. Eligible participants were randomly assigned to the order in which they received the morning loaded (ML) and evening loaded (EL) weight-loss diets. The baseline (B) and washout (W) diets were provided as energy intake (EI) equally distributed between breakfast, lunch, and dinner (33% of EI at all meals). All meals were provided from the start of baseline to the end of the study. EI during B and W was 1.5× measured RMR. EI during ML and EL weight-loss diets was 1.0× RMR. EI was measured over the entire study duration based on food provided and daily food records. Body weight was assessed 3 times per week when participants attended the institute to collect their meals. Total daily energy expenditure (TDEE) was measured for the entire 4-week duration of each weight-loss diet using doubly labeled water (DLW). All other measures were assessed in the final week of each dietary phase. (B) Consort diagram describing the number of patients throughout the process of enrollment through to completion. RMR, resting metabolic rate; DXA, dual-energy X-ray absorptiometry; TBW, total body water; TDEE, total daily energy expenditure; TEF, thermic effect of food; DLW, doubly labeled water.
Figure 2
Figure 2
ML and EL weight-loss diets resulted in similar weight loss and comparable EE when EI was controlled (A) Weight loss over the duration of the 4-week weight-loss diets. (B) EI and TDEE averaged over the 4 weeks of the ML and EL diets. (C) RMR measured at the end of each dietary phase. Means were estimated using hierarchical ANOVA (linear mixed models). Values expressed as mean ± SEM. Bars with different letters are significantly different (p < 0.05). EI, energy intake; EL, evening loaded; ML, morning loaded; RMR, resting metabolic rate; TDEE, total daily energy expenditure.
Figure 3
Figure 3
ML weight-loss diet resulted in significantly lower hunger and appetite compared to EL weight-loss diet (A) Average appetite scores from hourly free-living appetite assessment over 3 consecutive days at the end of the ML and EL diets. (B) Temporal appetite scores based on hourly VAS (0–100 mm) assessments across 3 consecutive days at the end of the free-living ML and EL diets. First VAS completed upon waking and then hourly until bedtime. (C) Temporal appetite scores during the in-lab test day. VAS completed immediately prior to breakfast and then every 30 min for the remainder of the day. First 6 h post-breakfast was spent in the human nutrition unit facility; thereafter, participants returned to their own free-living context and resumed meals at their own predetermined times. Appetite score calculated as (hunger + [100 – fullness] + prospective consumption + desire to eat)/4. Values displayed as mean ± SEM, p < 0.05 between ML and EL diets. EL, evening loaded; ML, morning loaded; VAS, visual analog scale.
Figure 4
Figure 4
The large morning meal on the ML diet resulted in greater changes in appetite hormones (suppression of hunger hormone ghrelin and increase in satiety hormones) and slower gastric emptying compared to the smaller morning meal on the EL diet (A) Appetite hormones measured at the end of each diet phase. Samples collected before, 0 h, and 2 h after the breakfast meal. Values expressed as mean ± SEM. Bars with different letters are significantly different (p < 0.05). (B) Gastric emptying measured using 13C octanoic acid breath test shown as cumulative excretion of contents from the stomach over time. EL, evening loaded; ML, morning loaded.
Figure 5
Figure 5
Interstitial glucose measured using CGMs for 3 days at the end of each diet phase (A) 24 h temporal profile of interstitial glucose during the ML and EL diets. Interstitial glucose was measured every 10 s and average glucose values stored for each 5 min period after midnight. Data shown as the average for each 5 min period over 3 consecutive days of measurements. (B) The data from the 3 consecutive days was used to calculate 24 h glucose metrics: (1) AUC, (2) iAUC, (3) MAGE, and (4) mean. Values displayed as mean ± SEM. AUC, area under the curve; EL, evening loaded; iAUC, incremental area under the curve; MAGE, mean amplitude of glycemic excursions; ML, morning loaded.

Comment in

  • Breakfast keeps hunger in check.
    Brandhorst S, Longo VD. Brandhorst S, et al. Cell Metab. 2022 Oct 4;34(10):1420-1421. doi: 10.1016/j.cmet.2022.09.015. Cell Metab. 2022. PMID: 36198286

References

    1. Almoosawi S., Winter J., Prynne C.J., Hardy R., Stephen A.M. Daily profiles of energy and nutrient intakes: are eating profiles changing over time? Eur. J. Clin. Nutr. 2012;66:678–686. - PMC - PubMed
    1. Anderson G.H., Catherine N.L.A., Woodend D.M., Wolever T.M.S. Inverse association between the effect of carbohydrates on blood glucose and subsequent short-term food intake in young men. Am. J. Clin. Nutr. 2002;76:1023–1030. - PubMed
    1. Anderson J.W., Kendall C.W.C., Jenkins D.J.A. Importance of weight management in type 2 diabetes: review with meta-analysis of clinical studies. J. Am. Coll. Nutr. 2003;22:331–339. - PubMed
    1. Arble D.M., Bass J., Laposky A.D., Vitaterna M.H., Turek F.W. Circadian timing of food intake contributes to weight gain. Obesity. 2009;17:2100–2102. - PMC - PubMed
    1. Baecke J.A., Burema J., Frijters J.E. A short questionnaire for the measurement of habitual physical activity in epidemiological studies. Am. J. Clin. Nutr. 1982;36:936–942. - PubMed

Publication types

Associated data