. 2022 Nov 16;110(22):3760-3773.e5.
doi: 10.1016/j.neuron.2022.08.019. Epub 2022 Sep 9.

Cell-type-specific integration of feedforward and feedback synaptic inputs in the posterior parietal cortex

Affiliations

Cell-type-specific integration of feedforward and feedback synaptic inputs in the posterior parietal cortex

Daniel J Rindner et al. Neuron. .

Abstract

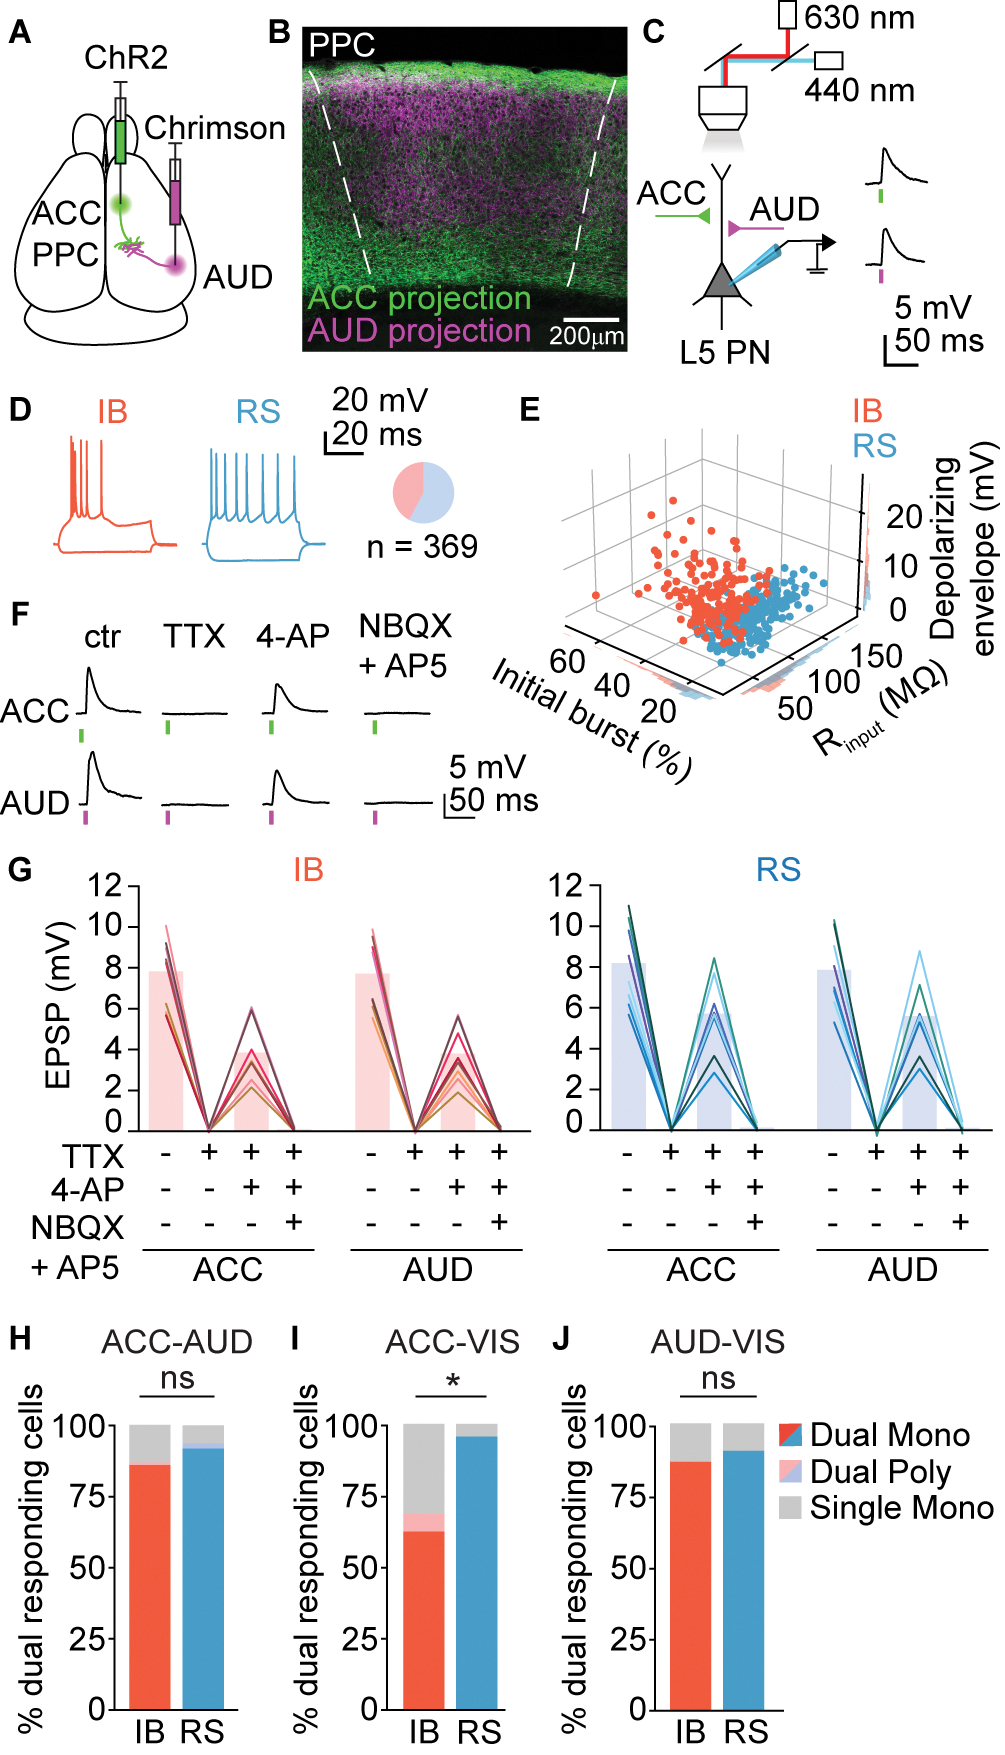
The integration of feedforward (sensory) and feedback (top-down) neuronal signals is a principal function of the neocortex. Yet, we have limited insight into how these information streams are combined by individual neurons. Using a two-color optogenetic strategy, we found that layer 5 pyramidal neurons in the posterior parietal cortex receive monosynaptic dual innervation, combining sensory inputs with top-down signals. Subclasses of layer 5 pyramidal neurons integrated these synapses with distinct temporal dynamics. Specifically, regular spiking cells exhibited supralinear enhancement of delayed-but not coincident-inputs, while intrinsic burst-firing neurons selectively boosted coincident synaptic events. These subthreshold integration characteristics translated to a nonlinear summation of action potential firing. Complementing electrophysiology with computational modeling, we found that distinct integration profiles arose from a cell-type-specific interaction of ionic mechanisms and feedforward inhibition. These data provide insight into the cellular properties that guide the nonlinear interaction of distinct long-range afferents in the neocortex.

Keywords: cell-type-specific; computational modeling; cortical layer 5; dual-color optogenetics; feedforward-feedback interaction; multimodal enhancement; posterior parietal cortex; synaptic integration.


Conflict of interest statement

Declaration of interests The authors declare no competing interests.

Figures

Figure 1.
Figure 1.. Dual monosynaptic innervation of layer 5 PPC neurons by feedforward and feedback afferents.
(A) Schematic of dual opsin transduction. (B) ACC and AUD afferents in the PPC. Scale bar, 200 μm. (C) Schematic of dual optogenetic excitation and example EPSPs. (D) Representative firing patterns of IB and RS neurons. Pie chart displays the proportion of IB and RS cells in PPC layer 5. (E) Intrinsic properties used to classify layer 5 pyramidal cells. (F) Determining monosynaptic connectivity using the TTX (1 μM) / 4-AP approach. Response recovery from both afferents indicates converging monosynaptic innervation. Blocking glutamatergic transmission abolishes all responses. (G) Response amplitudes of IB (red, n = 8) and RS (blue, n = 8) neurons in the TTX/4-AP experiment. Individual cells are represented by distinct shades of color. (H) Bars represent the proportion of IB and RS neurons receiving converging ACC and AUD inputs. (I) Proportion of neurons receiving converging ACC and VIS inputs. (J) Proportion of neurons receiving converging AUD and VIS inputs. *: p < 0.05, two-sided Fisher’s exact test. See also Figures S1 and S2.
Figure 2.
Figure 2.. Cell type-specific nonlinear integration of feedforward and feedback synaptic inputs.
(A) Stimulation protocol in dual-innervated cells. (B) IB cell response to unimodal stimulation of ACC or AUD afferents. (C) RS cell response to unimodal stimulation of ACC or AUD afferents. (D) Representative IB cell responses to combined stimulation of ACC and AUD afferents. Recorded traces (red) are overlaid on the calculated linear response (grey). (E) Representative RS cell responses to combined stimulation of ACC and AUD afferents (blue) and the predicted linear response (grey). (F) Temporal dynamics of ACC-AUD integration in IB neurons (light red lines). Dark red line represents population mean; shaded area represents 95% CI. (G) Temporal dynamics of ACC-AUD integration in RS cells (light blue lines). Dark blue line represents population mean; shaded area represents 95% CI. Dashed black line in (F) and (G) indicates linear integration. *: p < 0.05, t-test. See also Figure S3.
Figure 3.
Figure 3.. Temporal dynamics of nonlinear synaptic integration are determined by cell-type specific ionic conductances and feedforward inhibition.
(A) Simulation of coincident integration MEI values with varying Na+ and Ca2+ channel conductance and NMDA receptor decay. Missing points represent values where coincident inputs drove the model past action potential threshold. (B) MEI values for delayed (50 ms) synaptic integration across the same parameter space as in (A). (C) Relationship of coincident and delayed MEI values in all models without inhibition (black dots) or with the inclusion of feedforward inhibition (orange dots). Crosshairs represent ranges of all in vitro recorded IB (red) and RS (blue) neurons. Error bars show 99% CI and cross at the data median. (D) ACC stimulation evoked EPSPs in IB (top) and RS (bottom) cells before (black) and after (orange) GABAA receptor block (PTX). (E) Comparison of GABAA-mediated inhibition in IB (red) and RS (blue) cells. *: p < 0.05, unpaired t-test. (F) GABAA block (PTX) has no effect on ACC-AUD integration in IB cells. (G) GABAA block (PTX) unmasks supralinear integration of coincident inputs in RS neurons. *: p < 0.05, paired t-test. (H) MEI values measured in RS neurons with internal GABAA block (iPTX). *: p < 0.05, one sample t-test. (I) Schematic model incorporating feedforward inhibition. See also Figures S4–6.
Figure 4.
Figure 4.. Pharmacological testing of model predictions.
(A) Simulating the effect of blocking Na+, Ca2+, or NMDA conductance on coincident integration in a model IB neuron. (B) Simulating the effect of blockers on delayed (50 ms) integration in a model IB neuron. Inset: schematic of model IB neurons. (C) In vitro effect of Na+ (TTX – 100 nM), T-type Ca2+ (Mib) and NMDA (AP5) blockers on coincident integration in IB neurons. (D) The effect of pharmacological manipulations on delayed (50 ms) integration in IB neurons in vitro. (E) Simulating the effect of Na+, Ca2+ or NMDA block on coincident integration in a model RS neuron with (orange) or without (blue) feedforward inhibition. (F) Simulating the effect of Na+, Ca2+ or NMDA block on delayed (50 ms) integration in model RS neurons. Inset: schematic of model RS neurons. (G) In vitro effect of Na+ (TTX – 100 nM), T-type Ca2+ (Mib) and NMDA (AP5) blockers on coincident integration in RS neurons. (H) The effect of pharmacological manipulations on delayed (50 ms) integration in RS neurons in vitro. *: p < 0.05, paired t-test. See also Figure S7.
Figure 5.
Figure 5.. Temporal dynamics of action potential output mimic subthreshold feedforward-feedback integration dynamics.
(A) Action potential firing of an IB cell (red) in response to unimodal stimulation. (B) Unimodal firing responses in an RS cell (blue). (C) Action potential firing in response to combined ACC-AUD stimulation at different delays, same IB cell as in (A). (D) RS cell action potential firing in response to combined stimulation, same cell as in (B). (E) Temporal dynamics of suprathreshold ACC-AUD integration in IB neurons (light red lines). (F) Temporal dynamics of suprathreshold ACC-AUD integration in RS cells (light blue lines). Dark lines in (E) and (F) represent population means; shaded areas represent 95% CI. Dashed black lines indicate linear integration. *: p < 0.05, t-test.
Figure 6.
Figure 6.. Input specificity of nonlinear synaptic interactions differs between IB and RS cells.
(A) Schematic of ACC and VIS dual opsin transduction. (B) Temporal dynamics of ACC-VIS integration in IB neurons (light red lines). (C) Temporal dynamics of ACC-VIS integration in RS neurons (light blue lines). (D) Schematic of AUD and VIS dual opsin transduction. (E) Temporal dynamics of AUD-VIS integration in IB neurons (light red lines). (F) Temporal dynamics of AUD-VIS integration in RS neurons (light blue lines). Dark lines in panels (B), (C), (E), and (F) represent population means; shaded areas represent 95% CI. Dashed black lines indicate linear integration. *: p < 0.05, t-test.
Figure 7.
Figure 7.. Synapse location plays a key role in nonlinear interactions.
(A) Confocal images of ACC (green), AUD (magenta) and VIS (cyan) projections to the PPC. Blue: DAPI staining, scale bars are 200 μm. (B) Histograms showing the distribution (mean ± SEM) of ACC (n = 9), AUD (n = 16) and VIS (n = 7) fibers. (C) Relative density of ACC, AUD, and VIS fibers in superficial (0–150 μm from the pial surface), intermediate (150–400 μm) and deep (400–800 μm) sections of the PPC cortical column. (D) Simulated synaptic integration performance of IB neuron models (red) across various anatomical configurations. (E) Simulated synaptic integration in RS neuron models without inhibition (−GABA, blue dots), with inhibition arriving at the same dendritic segment as excitation (+dGABA, orange squares), or with somatic inhibition (+sGABA, brown triangles) across anatomical configurations. In panels (D) and (E), multimodal enhancement index (MEI) was measured for coincident (top) and delayed (50 ms, bottom) activation of excitatory inputs. Solid red and blue lines indicate experimentally measured MEIs. Unimodal EPSP magnitudes were matched across model configurations. See also Figures S8 and S9.

Comment in

References

    1. Agmon A, and Connors BW (1991). Thalamocortical responses of mouse somatosensory (barrel) cortex in vitro. Neuroscience 41, 365–379. 10.1016/0306-4522(91)90333-j. - DOI - PubMed
    1. Almog M, Barkai T, Lampert A, and Korngreen A (2018). Voltage-Gated Sodium Channels in Neocortical Pyramidal Neurons Display Cole-Moore Activation Kinetics. Front Cell Neurosci 12, 187. 10.3389/fncel.2018.00187. - DOI - PMC - PubMed
    1. Anastasiades PG, Marlin JJ, and Carter AG (2018). Cell-Type Specificity of Callosally Evoked Excitation and Feedforward Inhibition in the Prefrontal Cortex. Cell Rep 22, 679–692. 10.1016/j.celrep.2017.12.073. - DOI - PMC - PubMed
    1. Anderson CT, Sheets PL, Kiritani T, and Shepherd GM (2010). Sublayer-specific microcircuits of corticospinal and corticostriatal neurons in motor cortex. Nat Neurosci 13, 739–744. 10.1038/nn.2538. - DOI - PMC - PubMed
    1. Ariav G, Polsky A, and Schiller J (2003). Submillisecond precision of the input-output transformation function mediated by fast sodium dendritic spikes in basal dendrites of CA1 pyramidal neurons. J Neurosci 23, 7750–7758. - PMC - PubMed

Publication types