. 2022 Nov 16;110(22):3743-3759.e6.
doi: 10.1016/j.neuron.2022.08.016. Epub 2022 Sep 9.

Activation and expansion of presynaptic signaling foci drives presynaptic homeostatic plasticity

Affiliations

Activation and expansion of presynaptic signaling foci drives presynaptic homeostatic plasticity

Brian O Orr et al. Neuron. .

Abstract

Presynaptic homeostatic plasticity (PHP) adaptively regulates synaptic transmission in health and disease. Despite identification of numerous genes that are essential for PHP, we lack a dynamic framework to explain how PHP is initiated, potentiated, and limited to achieve precise control of vesicle fusion. Here, utilizing both mice and Drosophila, we demonstrate that PHP progresses through the assembly and physical expansion of presynaptic signaling foci where activated integrins biochemically converge with trans-synaptic Semaphorin2b/PlexinB signaling. Each component of the identified signaling complexes, including alpha/beta-integrin, Semaphorin2b, PlexinB, talin, and focal adhesion kinase (FAK), and their biochemical interactions, are essential for PHP. Complex integrity requires the Sema2b ligand and complex expansion includes a ∼2.5-fold expansion of active-zone associated puncta composed of the actin-binding protein talin. Finally, complex pre-expansion is sufficient to accelerate the rate and extent of PHP. A working model is proposed incorporating signal convergence with dynamic molecular assemblies that instruct PHP.

Keywords: ALS; FAK; Plexin; homeostatic plasticity; integrin; neuromuscular junction; neuroprotection; semaphorin; synaptic plasticity; talin.


Conflict of interest statement

Declaration of interests G.W.D. is a member of the Advisory Board of the journal Neuron.

Figures

Figure 1.
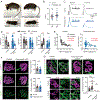
Figure 1.. Acute ITGB1 antagonism blocks PHP
A) Diagram of recording configuration at the diaphragm NMJ. B) alpha/beta-Integrin dimers at the NMJ. C) Anti-ITGβ1 (Ab AIIB2, green) at the NMJ co-localizes with postsynaptic (AChR, left magenta) and presynaptic Neurofilament (middle magenta). Scale 10 μm. Inset at right. D) alpha/beta-Integrin dimer activation. Asterisks indicate the approximate binding of function blocking reagents. E) Representative traces (EPP and mEPP) for indicated treatments. F) All recording are in the presence of beta-Integrin inhibitors. Data displayed as percent change for mEPP amplitude (mEPP, filled bars) and quantal content (QC, open bars) in the presence versus absence of Curarine. G) Representative two-electrode voltage clamp traces for indicated pharmacological treatments. Bottom graph presents back extrapolation to Y axis for RRP estimation. H) Average data for voltage clamp recordings. Data represent mean ± SEM. One-way Anova with Tukey correction for multiple comparisons; *p < 0.05, **p < 0.01, ***p < 0.001. n.s., not significant. Recordings 2 mM [Ca2+]e. Supplemental Figure 1 for non-normalized values.
Figure 2
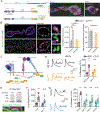
Figure 2. Presynaptic ITGB1 is essential for PHP and redistributes during PHP
A) Images of control (HB9+/+; Itgb1 loxP/loxP) and ITGB1 conditional knockout in motoneurons (cKO) (HB9Cre/+; Itgb1 loxP/loxP) animals. B) Weights at p60 and p90 are not different. C) Representative traces for indicated genotypes and treatments. D) Average data for NMJ recordings as in (C) (animal number: 4 cKO and 2 controls). E) NMJ recordings for indicated genotypes in the absence (baseline, open circle) and presence of curarine (+Curarine; filled circle). Control NMJs demonstrate a strong negative correlation. ITGB1 presynaptic cKO disrupts the negative correlation. F) Representative images of NMJs for indicated genotypes labeled as indicated. Scale bar 10μm. Graphs at right report averaged Bassoon puncta number or AChR area per NMJ. G) Representative images of NMJs labeled for activated ITGB1 (Ab 9EG7, green) for indicated genotypes, treatments and staining. Scale bar, 10μm. Quantification at right. Postsynaptic AChR staining was used as a mask to identify and quantify ITGB1 present at the endplate. Inset scale bar is 5μm. Data represent mean ± SEM. Significance determined by One-way Anova with Tukey correction for multiple comparisons. Student’s t-test used in graphs containing only two bars; *p < 0.05, **p < 0.01, ***p < 0.001. n.s., not significant. Recordings at 2 mM [Ca2+]e.
Figure 3
Figure 3. Synaptic alpha/beta-Integrin is necessary for PHP in Drosophila
A) Schematic of CRISPR directed GFP Tag insertion after exon six in the mys locus (DNA top, protein bottom). Image below shows SIM image (2D projection) of MysGFP (green) and a presynaptic membrane marker (HRP, magenta). Arrowhead indicates SSR. Inset at right is a single plane with membrane co-localized MysGFP indicated (white arrowheads). Right (top three panels) show MysGFP (Red) co-localizing with anti-Mys (Ab CF.6G11) antibody (green). Bottom panel demonstrates that motoneuron over-expressed MysFLAG protein traffics to the presynaptic terminal. All scale bars are 5 μm. B) Representative traces for (mEPSPs and EPSPs) of indicated genotypes and treatments. C) Normalized data displayed as percent change in the presence versus absence of PhTx. D) Data as in (C). Motor neuron (MN) Gal4 (OK371-Gal4) is used as control. E) Data as in (C). Muscle Gal4 (BG57-Gal4) is the control. F) Representative traces, voltage clamp recordings in 1 mM [Ca2+]e. G) Averaged data (left) and normalized data as in (C). H) Representative current clamp traces. I) Data as in (C). Control is OK371- Gal4. J) Diagram of mys mutations and inhibition of Integrin activation. K) Averaged data for NMJ recordings. L) Normalized data (from K) displayed as in (C). Data presented as mean ± SEM. Significance determined by One-way Anova with Tukey correction for multiple comparisons; *p < 0.05, **p < 0.01, ***p < 0.001. n.s., not significant. Recordings at 0.3 mM [Ca2+]e, unless otherwise indicated in the figure. Refer to Supplemental Figures 2,3, and for non-normalized values.
Figure 4
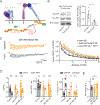
Figure 4. Beta-Integrin is necessary for PHP-dependent potentiation of the RRP
A) Representative voltage clamp traces and back extrapolations (graphs) for individual recordings. Data from control (black) and mys mutant (+/− PhTx) (60 Hz stimulation). B) Averaged data for genotypes in (A). C) Average EPSC amplitudes normalized to the first stimulus of each train, plotted as stimulus number. D) Representative EPSC traces at baseline and following incubation in EGTA-AM (25 mM, 10min) for indicated genotypes. E) Average data for first EPSC amplitudes for data as in (D). F) Average data for EPSC4/EPSC1, ± EGTA-AM. G) Representative electron micrographs of presynaptic active zones for indicated genotypes (scale bar 100nm. H) Average data for active zone length, vesicle number (within 150 nm of the base of the T-bar) and docked vesicles/NMJ. I) Docked vesicle distribution plotted as percent of total vesicles within 400 nm of the T-bar base. Averaged data are mean ± SEM. Significance determined by One-way Anova with Tukey correction for multiple comparisons. Student’s t-test used in graphs containing only two bars; *p < 0.05, **p < 0.01, ***p < 0.001. n.s., not significant. Recordings at 1.5 mM [Ca2+]e.
Figure 5
Figure 5. Biochemical Interaction of beta-Integrin and PlexinB
A) Diagram and images for proximity ligation assay (PLA) between motoneuron over-expressed Mys (flag-mys) and PlexinB (myc-PlexB) (OK371-Gal4 driver) (scale 5μm). No reaction is observed in control (OK371-Gal4, left). B) Quantification of PLA puncta number, area, and perimeter (+/−PhTx). Mann-Whitney U-test, * p=0.05, *** p<0.001; n>20 NMJ per condition. C) Western blot of myc-PlexB and flag-Mys. UAS-myc-PlexB and UAS-flag-mys (OK371-Gal4 driver) in wild type or sema2b null animals. Flag-Mys was immunoprecipitated from both genotypes. D) Averaged EPSP and normalized data (mEPSP and quantal content) for indicated genotypes. Averaged data represent mean ± SEM. Significance (panel D) determined by One-way Anova with Tukey correction for multiple comparisons; *p < 0.05, **p < 0.01, ***p < 0.001. n.s., not significant. Recordings at 0.3 mM [Ca2+]e. Refer to Supplemental Figure 5 for non-normalized data.
Figure 6
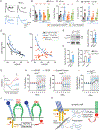
Figure 6. Presynaptic Talin participation and rearrangement during PHP
A) Schematic of CRISPR-tagged TalinBFP,Myc inserted between exons 11 and 12. Images to the right show SIM of TalinBFP (green) and DLG (magenta) or HRP (Magenta) (scale 3 μm). B) SIM images demonstrating BRP (magenta) localization at the presynaptic membrane (HRP, blue) and TalinBFP (green) distribution at BRP labeled active zones. Dotted lines in high magnification images of single active zones delineate presynaptic plasma membrane position and orientation. Averaged data for Talin object volumes that co-localize with BRP in the presence (+PhTx) or absence of PhTx (Baseline). Far right: average of BRP objects that co-localize with Talin (±PhTx). Scale bars are 5 μm, 3 μm and 1 μm (left to right). C) Diagram of mys mutation (L796R) effect. D) Representative current clamp traces (±PhTx). Data displayed as percent change (±PhTx). OK371-Gal4 is the control genotype. E) Western blot of Talin protein (anti-Talin A22A and E16B antibodies) from immunoprecipitation of Ubi:MysYFP or Ubi:MysYFP L796R. Actin serves as loading control. Image of MysYFP L796R (Green) at the synaptic terminal (HRP, magenta). Scale Bar is 5 μm. F) Normalized data for recordings of indicated genotypes. Data displayed as percent change (±PhTx). G) Representative traces. Data displayed as percent change (±PhTx). Averaged data represent mean ± SEM. Significance determined by One-way Anova with Tukey correction for multiple comparisons. Student’s t-test used in graphs containing only two bars; *p < 0.05, **p < 0.01, ***p < 0.001. n.s., not significant. Recordings at 0.3 mM [Ca2+]e. Refer to Supplemental Figure 7 for non-normalized data.
Figure 7.
Figure 7.. Interaction of Beta-Integrin with Talin is necessary for PHP
A) Diagram of talin mutations. B) Western blot of TalinGFP or TalinGFP IBS (Anti-GFP) and Mys (Anti-Mys, Ab CF.6G11) protein from immunoprecipitation of MewFLAG. Beta Tubulin was used as a loading control (anti-beta-Tubulin, Ab AA12.1). Quantification of TalinGFP WT or TalinGFP IBS protein immunoprecipitation. C) Representative traces for indicated genotypes (±PhTx) 60 Hz stimulation. Average EPSC amplitudes normalized to the first pulse are plotted against stimulus number for indicated genotypes and treatments. D) Average mEPSC, cumulative EPSC and normalized data (RRP) (± PhTx). E) Amplitude of the fourth EPSC divided by the first EPSC in a train (paired pulse ratio, PPR) for indicated genotypes. Averaged data represent mean ± SEM. Significance determined by One-way Anova with Tukey correction for multiple comparisons. Student’s t-test used in graphs containing only two bars; *p < 0.05, **p < 0.01, ***p < 0.001. n.s., not significant. Recordings at 1.5 mM [Ca2+]e. Refer to Supplemental Figure 7 for non-normalized RRP data.
Figure 8.
Figure 8.. Activated Beta-Integrin bypasses matrix requirement and accelerates PHP
A) Representative traces (±PhTx). B) Averaged mEPSP and quantal content (±PhTx). Genotypes are as follows: mysWT indicates Ubi:mysWT-YFP (black), mysL211I indicates Ubi:mysL211I-YFP (blue), double mutants harboring Ubi:mysL211I-YFP (indicated as horizontal blue line) combined with either sema2b knockdown (orange) or a dmp mutation (green) (genotypes also indicated with boxes below graph). Genotype naming persist throughout the figure. C) Normalized data (± PhTx) with genotypes as in (B). D) Each data point represents a single NMJ recording for indicated genotypes. Best fit for data is shown. Equation for each line of best fit as follows: mysWT Y= −47.5*X+66.3; mysL211I Y= −90.8*X+104.6; mysL211I, SemaKD Y= 6.9*X+19.3. E) Western blot of PlexinBFLAG endogenous protein trap (Anti-FLAG, 150kD) and MysWT-YFP or MysL211I-YFP (Anti-GFP N86/ 8, 120kD) protein from immunoprecipitation of MysWT-YFP or MysL211I-YFP (Anti-GFP 3E6). Beta Tubulin is loading control. Quantification at right. F) Left graph shows data for proximity ligation assay (PLA) of PlexBMyc with MysWT-YFP or MysL211I-YFP. Right graph shown change in MysWT-YFP or MysL211I-YFP synaptic puncta (±PhTx). G) Summary diagram for expectation (Frank et al., 2006) regarding mEPSP, EPSP, and QC after application of sub-blocking PhTx (GluR Inhibition arrow). The mechanism for limiting a homeostatic change in QC remains unknown (dotted line, question mark). H) Normalized data for continuous recordings of indicated genotypes. 10 NMJs were recorded from 10 animals per genotype. I) Normalized quantal content data for data in (H). Averaged data represent mean ± SEM. Significance determined by One-way Anova with Tukey correction for multiple comparisons: *p < 0.05, **p < 0.01, ***p < 0.001. n.s., not significant. Recordings at 0.3 mM [Ca2+]e. Refer to Supplemental Figure 7 for non-normalized data. J) Model. Oligomerization of presynaptic complex including activated beta-Integrin (blue) and activated PlexB (green) in the presence of Sema2b dimers (red ovals). Opposing actions of Talin and MICAL on actin filaments are indicated. K) Model. Activity of beta-Integrin (blue) and PlexB (green) are separated (left and right respectively) for clarity. Talin extends into presynaptic cytoplasmic volume, acting to promote a filamentous actin pool that facilitates vesicle recruitment to the RRP. MICAL promotes disassembly of a cortical actin pool, facilitating vesicle fusion. The combined activity is proposed to achieve a regulated and sustained homeostatic increase in the RRP. Refer to Supplemental Figure 7 for non-normalized data.

Comment in

References

    1. Babayan AH, Kramár EA, Barrett RM, Jafari M, Häettig J, Chen LY, Rex CS, Lauterborn JC, Wood MA, Gall CM, & Lynch G (2012). Integrin dynamics produce a delayed stage of long-term potentiation and memory consolidation. Journal of Neuroscience, 32, 12854–12861. 10.1523/JNEUROSCI.2024-12.2012. - DOI - PMC - PubMed
    1. Berginski ME, Vitriol EA, Hahn KM, & Gomez SM (2011). High-resolution quantification of focal adhesion spatiotemporal dynamics in living cells. PLoS ONE, 6, e22025. 10.1371/journal.pone.0022025. - DOI - PMC - PubMed
    1. Beumer KJ, Rohrbough J, Prokop A, & Broadie K (1999). A role for PS integrins in morphological growth and synaptic function at the postembryonic neuromuscular junction of Drosophila. Development, 126, 5833–5846. 10.1242/dev.126.24.5833. - DOI - PubMed
    1. Bleckert A, Photowala H, & Alford S (2012). Dual pools of actin at presynaptic terminals. Journal of Neurophysiology, 107, 3479–3492. 10.1152/jn.00789.2011. - DOI - PMC - PubMed
    1. Broadie K, Baumgartner S, & Prokop A (2011). Extracellular matrix and its receptors in drosophila neural development. Developmental Neurobiology, 71, 1102–1130. 10.1002/dneu.20935. - DOI - PMC - PubMed

Publication types