. 2022 Sep 10;23(1):370.
doi: 10.1186/s12859-022-04910-9.

Struct2Graph: a graph attention network for structure based predictions of protein-protein interactions

Affiliations

Struct2Graph: a graph attention network for structure based predictions of protein-protein interactions

Mayank Baranwal et al. BMC Bioinformatics. .

Abstract

Background: Development of new methods for analysis of protein-protein interactions (PPIs) at molecular and nanometer scales gives insights into intracellular signaling pathways and will improve understanding of protein functions, as well as other nanoscale structures of biological and abiological origins. Recent advances in computational tools, particularly the ones involving modern deep learning algorithms, have been shown to complement experimental approaches for describing and rationalizing PPIs. However, most of the existing works on PPI predictions use protein-sequence information, and thus have difficulties in accounting for the three-dimensional organization of the protein chains.

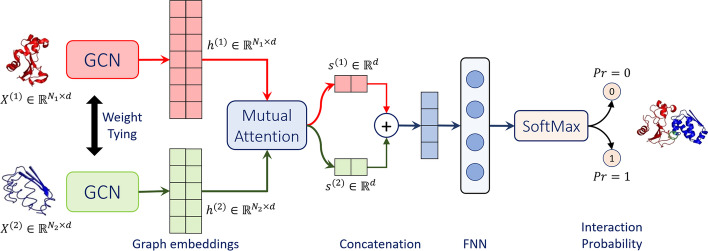
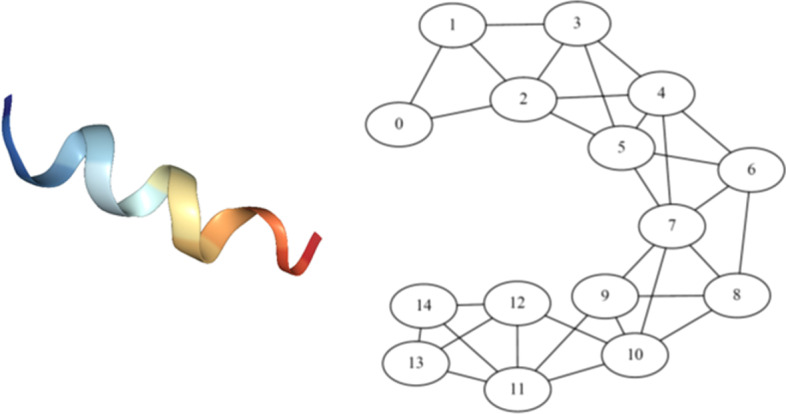
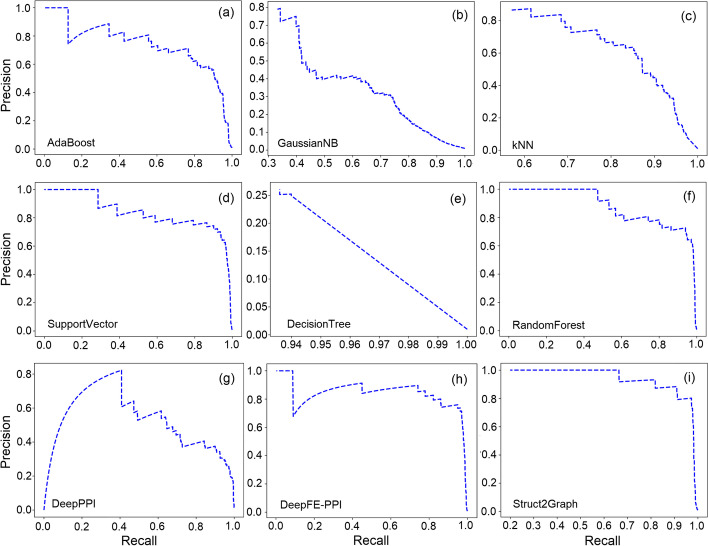
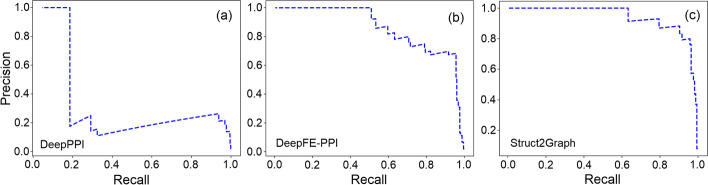
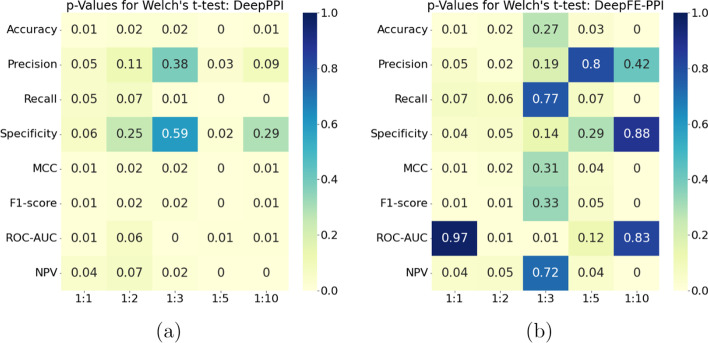
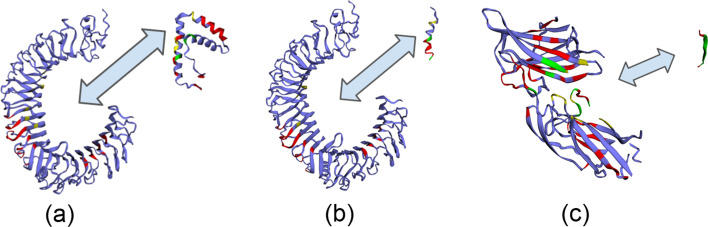
Results: In this study, we address this problem and describe a PPI analysis based on a graph attention network, named Struct2Graph, for identifying PPIs directly from the structural data of folded protein globules. Our method is capable of predicting the PPI with an accuracy of 98.89% on the balanced set consisting of an equal number of positive and negative pairs. On the unbalanced set with the ratio of 1:10 between positive and negative pairs, Struct2Graph achieves a fivefold cross validation average accuracy of 99.42%. Moreover, Struct2Graph can potentially identify residues that likely contribute to the formation of the protein-protein complex. The identification of important residues is tested for two different interaction types: (a) Proteins with multiple ligands competing for the same binding area, (b) Dynamic protein-protein adhesion interaction. Struct2Graph identifies interacting residues with 30% sensitivity, 89% specificity, and 87% accuracy.

Conclusions: In this manuscript, we address the problem of prediction of PPIs using a first of its kind, 3D-structure-based graph attention network (code available at https://github.com/baranwa2/Struct2Graph ). Furthermore, the novel mutual attention mechanism provides insights into likely interaction sites through its unsupervised knowledge selection process. This study demonstrates that a relatively low-dimensional feature embedding learned from graph structures of individual proteins outperforms other modern machine learning classifiers based on global protein features. In addition, through the analysis of single amino acid variations, the attention mechanism shows preference for disease-causing residue variations over benign polymorphisms, demonstrating that it is not limited to interface residues.

Keywords: Deep learning; Graph attention network; Protein–protein interaction; Structure-based prediction.


Conflict of interest statement

The authors declare that they have no competing interests.

Figures

Fig. 1
Fig. 1
Struct2Graph schematic. Struct2Graph graph convolutional network (GCN) for incorporating mutual attention for PPI prediction. The GCN classifies whether or not a protein pair (X(1) and X(2) on far left) interacts and predicts the interaction sites (on far right)
Fig. 2
Fig. 2
Protein and protein graph. Illustration of extracted protein structure graph (right) from the corresponding PDB description of a peptide segment (left) of the S. cerevisiae alpha-factor receptor. The graph is extracted by thresholding the distances between amino acids. The helical structure of the protein (left) gets captured in the corresponding protein graph (right) where, for example, amino acid 4 is linked with amino acid 7
Fig. 3
Fig. 3
Prevalence corrected precision-recall curves for the balanced database. a AdaBoost classifier, b GaussianNB classifier, c kNN classifier, d SVC, e Decision tree classifier, f Random forest classifier, g DeepPPI classifier, h DeepFE-PPI classifier, i Struct2Graph (ours) classifier
Fig. 4
Fig. 4
Prevalence corrected precision-recall curves for the unbalanced database. a DeepPPI classifier, b DeepFE-PPI classifier, c Struct2Graph (ours) classifier
Fig. 5
Fig. 5
p-value statistical significance when Struct2Graph is compared with a DeepPPI, b DeepFE-PPI, using the Welch’s t-test. The columns depict scenarios in which the model was trained beginning from the balanced (1:1), to unbalanced (1:2, 1:3, 1:5, 1:10) datasets
Fig. 6
Fig. 6
Histogram of proteins with only positive interactions. Of the 3677 unique PDBs, 3453 PDBs are involved in only positive interactions, i.e., among all the protein–protein pair instances in our database, these 3453 proteins do not feature in any non-complex forming instance. Moreover, of the 3453 PDBs with only positive interactions, nearly 82% unique PDBs are involved in fewer than 4 PPI examples. Consequently, for a classifier to memorize data and not “learn” to predict interactions would be extremely difficult without each PDB appearing in a relatively large number of PPI instances
Fig. 7
Fig. 7
Histogram of proteins with only negative interactions. Of the 3677 unique PDBs, only 104 PDBs are involved in just the negative interactions, i.e., among all the protein–protein pair instances in our database, these 104 proteins do not feature in any complex forming instance. Moreover, of the 104 PDBs, 23 PDBs appear in less than 5 PPI examples. The total number of proteins that are involved in more than 5 PPI examples is a very small number (81), i.e., only 2.2% of the entire PDB database considered in our work
Fig. 8
Fig. 8
Important residue prediction by Struct2Graph for three example scenarios. a TLR4 with HMGB1, b TLR4 with PSMα1, c SdrG and Fibrinogen adhesion. The different colored residues encode different information: (i) Red: Top-20% residues identified important by Struct2Graph, (ii) Yellow: Actual binding site not identified to be important by Struct2Graph, (iii) Green: True binding site overlapping with a residue identified important by Struct2Graph, (iV) Purple: neither important, nor actual interaction site. Recall that both HMGB1 and PSMα1 are known to compete for the same binding sites on TLR4, and this is reflected in the Struct2Graph predictive analysis as well

References

    1. Berggård T, Linse S, James P. Methods for the detection and analysis of protein–protein interactions. Proteomics. 2007;7(16):2833–2842. doi: 10.1002/pmic.200700131. - DOI - PubMed
    1. Braun P, Gingras A-C. History of protein–protein interactions: from egg-white to complex networks. Proteomics. 2012;12(10):1478–1498. doi: 10.1002/pmic.201100563. - DOI - PubMed
    1. Phizicky EM, Fields S. Protein–protein interactions: methods for detection and analysis. Microbiol Rev. 1995;59(1):94–123. doi: 10.1128/MMBR.59.1.94-123.1995. - DOI - PMC - PubMed
    1. Ito T, Chiba T, Ozawa R, Yoshida M, Hattori M, Sakaki Y. A comprehensive two-hybrid analysis to explore the yeast protein interactome. Proc Natl Acad Sci. 2001;98(8):4569–4574. doi: 10.1073/pnas.061034498. - DOI - PMC - PubMed
    1. Fry DC. Protein–protein interactions as targets for small molecule drug discovery. Biopolymers. 2006;84(6):535–552. doi: 10.1002/bip.20608. - DOI - PubMed

LinkOut - more resources