

Prognostic value of soluble ST2, high-sensitivity cardiac troponin, and NT-proBNP in type 2 diabetes: a 15-year retrospective study
- PMID: 36088327
- PMCID: PMC9463761
- DOI: 10.1186/s12933-022-01616-3
Prognostic value of soluble ST2, high-sensitivity cardiac troponin, and NT-proBNP in type 2 diabetes: a 15-year retrospective study
Abstract
Background: Patients with type 2 diabetes (T2DM) present an increased risk of cardiovascular (CV) disease and excess CV-related mortality. Beyond the established role of brain natriuretic peptide (BNP) and cardiac troponins (cTn), other non-cardiac-specific biomarkers are emerging as predictors of CV outcomes in T2DM.
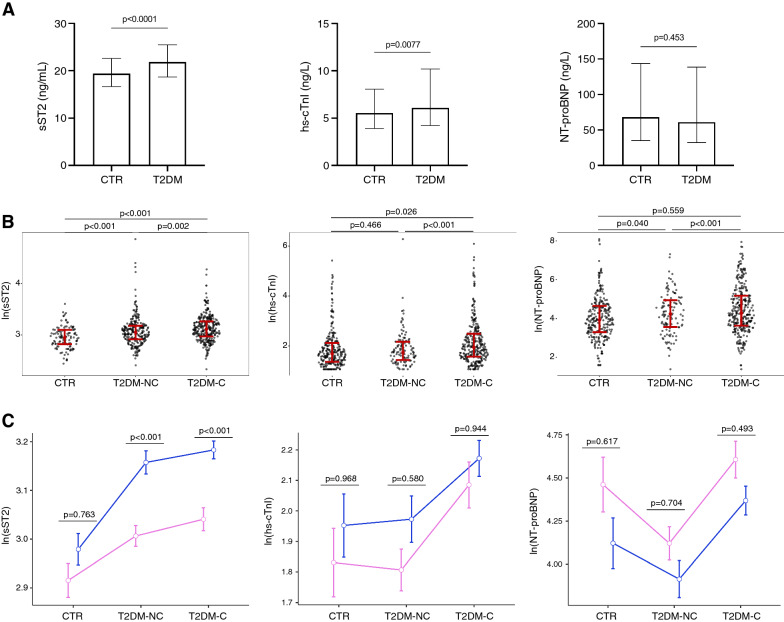
Methods: Serum levels of soluble suppression of tumorigenesis 2 (sST2), high-sensitivity (hs)-cTnI, and N-terminal (NT)-proBNP were assessed in 568 patients with T2DM and 115 healthy controls (CTR). Their association with all-cause mortality and the development of diabetic complications was tested in T2DM patients over a median follow-up of 16.8 years using Cox models and logistic regressions.
Results: sST2 followed an increasing trend from CTR to uncomplicated T2DM patients (T2DM-NC) to patients with at least one complication (T2DM-C), while hs-cTnI was significantly higher in T2DM-C compared to CTR but not to T2DM-NC. A graded association was found between sST2 (HR 2.76 [95% CI 1.20-6.33] for ≥ 32.0 ng/mL and 2.00 [1.02-3.94] for 16.5-32.0 ng/mL compared to < 16.5 ng/mL, C-statistic = 0.729), NT-proBNP (HR 2.04 [1.90-4.55] for ≥ 337 ng/L and 1.48 [1.05-2.10] for 89-337 ng/L compared to < 89 ng/L, C-statistic = 0.741), and 15-year mortality in T2DM, whereas increased mortality was observed in patients with hs-cTnI ≥ 7.8 ng/L (HR 1.63 [1.01-2.62]). A 'cardiac score' based on the combination of sST2, hs-cTnI, and NT-proBNP was significantly associated with all-cause mortality (HR 1.35 [1.19-1.53], C-statistic = 0.739) and development of CV events.
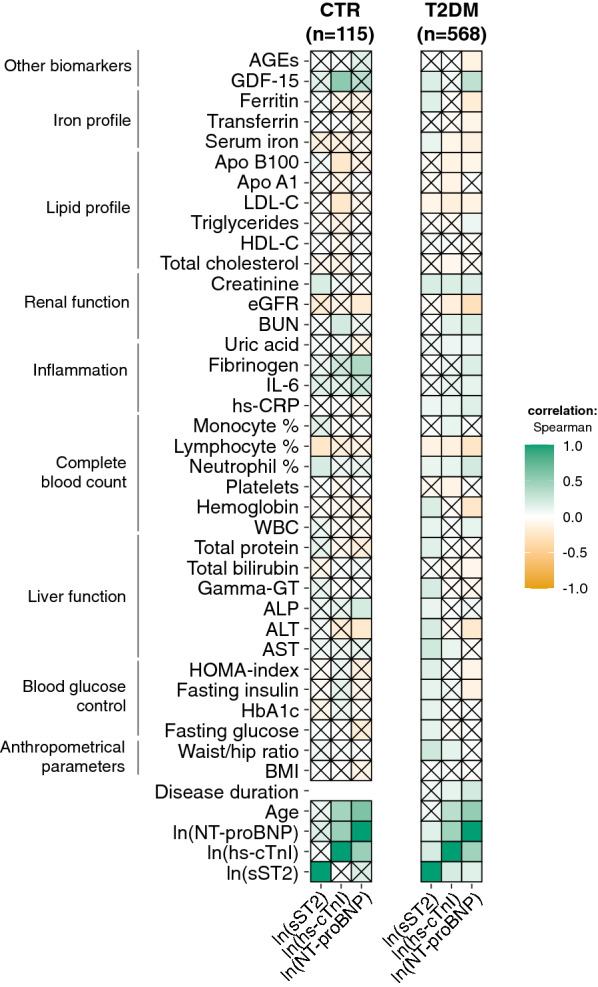
Conclusions: sST2, hs-cTnI, and NT-proBNP are associated with 15-year mortality and onset of CV events in T2DM. The long-term prognostic value of sST2 and its ability to track variables related to insulin resistance and associated metabolic disorders support its implementation into routine clinical practice.
Keywords: Cardiovascular risk; Natriuretic peptides; Soluble ST2; Troponin; Type 2 diabetes.
© 2022. The Author(s).
Conflict of interest statement
All authors declare no competing interests associated with this manuscript. The authors declare that there are no relationships or activities that might bias, or be perceived to bias, their work.
Figures


References
-
- Looker HC, Colombo M, Agakov F, Zeller T, Groop L, Thorand B, et al. Protein biomarkers for the prediction of cardiovascular disease in type 2 diabetes. Diabetologia. 2015;58(6):1363–1371. - PubMed
-
- Gerstein HC, Pare G, McQueen MJ, Haenel H, Lee SF, Pogue J, et al. Identifying novel biomarkers for cardiovascular events or death in people with dysglycemia. Circulation. 2015;132(24):2297–2304. - PubMed
Publication types
MeSH terms
Substances
LinkOut - more resources
Full Text Sources
Medical
Research Materials
Miscellaneous
