. 2022 Sep 10;13(1):5333.
doi: 10.1038/s41467-022-32811-1.

Therapeutic high affinity T cell receptor targeting a KRASG12D cancer neoantigen

Affiliations

Therapeutic high affinity T cell receptor targeting a KRASG12D cancer neoantigen

Andrew Poole et al. Nat Commun. .

Abstract

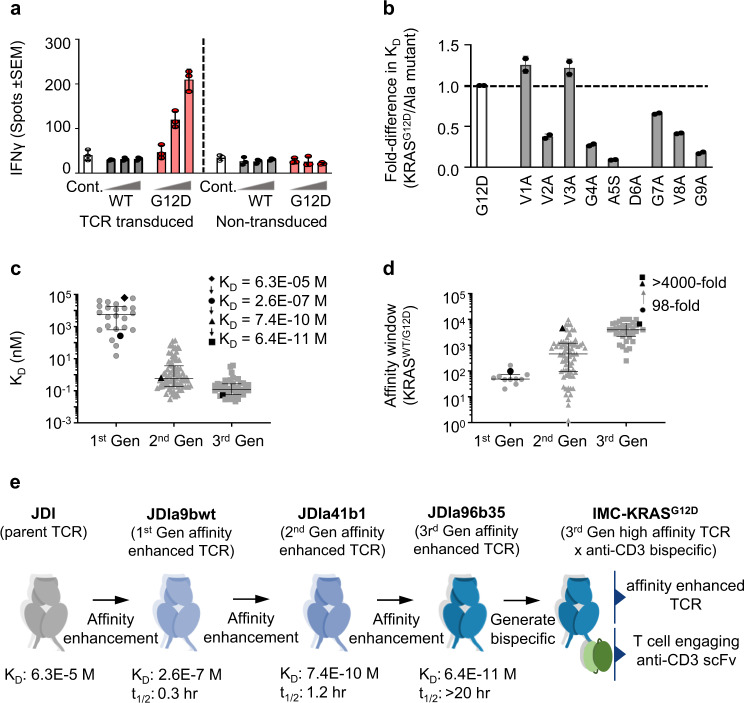
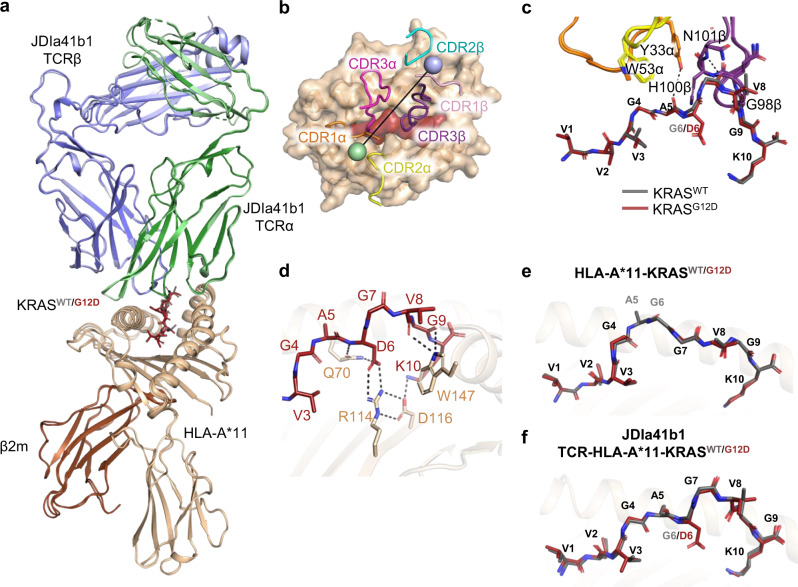
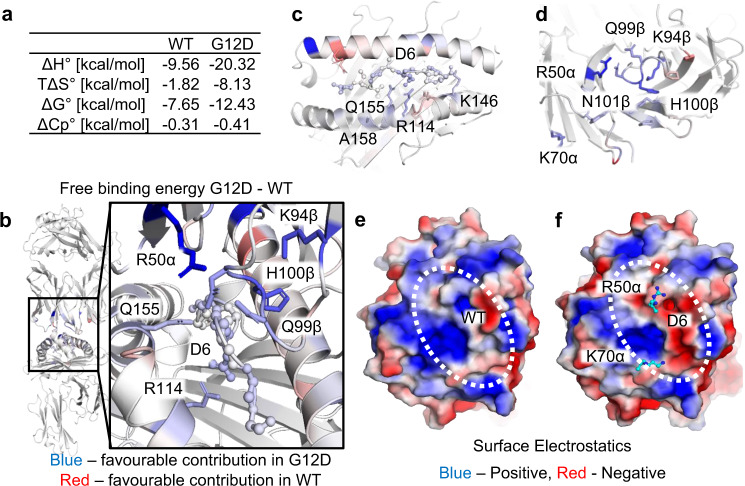
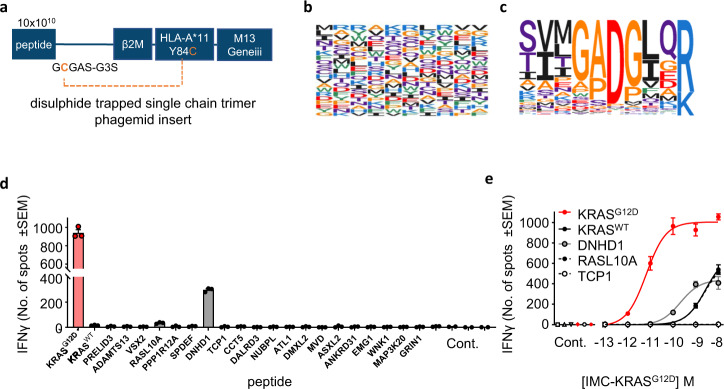
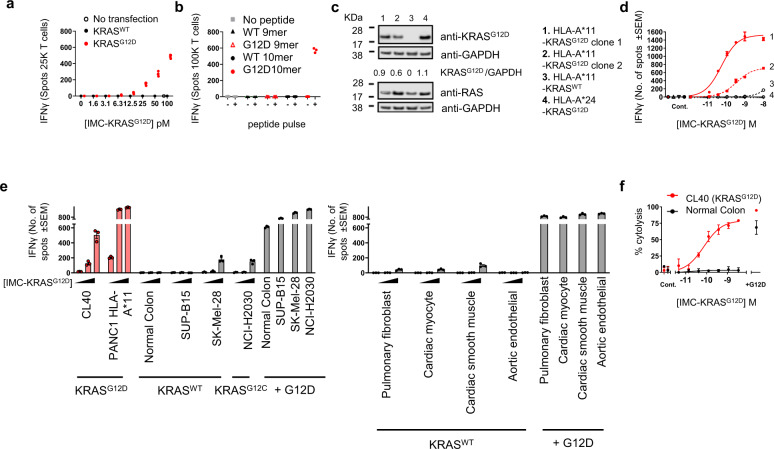
Neoantigens derived from somatic mutations are specific to cancer cells and are ideal targets for cancer immunotherapy. KRAS is the most frequently mutated oncogene and drives the pathogenesis of several cancers. Here we show the identification and development of an affinity-enhanced T cell receptor (TCR) that recognizes a peptide derived from the most common KRAS mutant, KRASG12D, presented in the context of HLA-A*11:01. The affinity of the engineered TCR is increased by over one million-fold yet fully able to distinguish KRASG12D over KRASWT. While crystal structures reveal few discernible differences in TCR interactions with KRASWT versus KRASG12D, thermodynamic analysis and molecular dynamics simulations reveal that TCR specificity is driven by differences in indirect electrostatic interactions. The affinity enhanced TCR, fused to a humanized anti-CD3 scFv, enables selective killing of cancer cells expressing KRASG12D. Our work thus reveals a molecular mechanism that drives TCR selectivity and describes a soluble bispecific molecule with therapeutic potential against cancers harboring a common shared neoantigen.


Conflict of interest statement

A.P., V.K., S.M., T.D., C.H., C.R., J.D., S.H., K.B., M.H., C.C., M.A., R.R., J.D.D., N.L., A.V., D.K.C., A.D.W., and C.C. are current or former employees of, and may hold shares in Immunocore Ltd. J.N.H, W.Y., A.B.L., and G.D.P. are current or former employees of, and may hold shares in Eli Lilly and Co. M.v.d.K and A.H. declare no competing interests.

Figures

Fig. 1
Fig. 1. Affinity-enhanced version of the JDI TCR retains the ability to distinguish KRASG12D from KRASWT.
a T cells transduced with the JDI TCR were co-cultured with SUP-B15 cells (HLA-A*03:01 + /HLA-A*11 + ) incubated with 0.1, 1 or 10 µM KRASWT (WT) or KRASG12D (G12D) peptide. T cell activation was assessed using IFNɣ capture ELISPOT assay. Unpulsed antigen presenting cells (Cont.) and untransduced T cells were used as controls. Mean data of three biological replicates ± SEM from one experiment is shown b binding of the JDI TCR to alanine substituted KRASG12D peptides. Mean KD values (n = 2) plotted as fold-change in KD compared to KRASG12D (G12D). Ratio is calculated as KD of JDI TCR binding to KRASG12D/Alanine mutant. c Affinity (KD) of mutants from three generations of affinity maturation. Error bars represent median with interquartile range in each generation (Gen; 1st Gen n = 24, 2nd Gen n = 78, 3rd Gen n = 41). Data shown in black symbols are for selected mutants shown in Fig. 1e and calculated from at least n = 2 experiments. d Difference in binding affinity of TCR mutants towards KRASWT and KRASG12D plotted as affinity window (KD KRASWT/ KD KRASG12D pHLA). Error bars represent median with interquartile range in each generation (1st Gen n = 11, 2nd Gen n = 78, 3rd Gen n = 35). Data shown in black symbols are calculated from at least n = 2 experiments. e Schematic representation of the evolution of parent JDI TCR into a high affinity TCRxCD3-bispecific IMC-KRASG12D. Source data are provided as a Source Data file.
Fig. 2
Fig. 2. The JDIa41b1 TCR adopts a virtually identical binding mode in complex with HLA-A*11-KRASG12D and HLA-A*11-KRASWT.
a Superposition of JDIa41b1-HLA-A*11-KRASWT (PBD 7OW5) and JDIa41b1-HLA-A*11-KRASG12D (PBD 7OW6) complexes. The HLA, β2m, JDIa41b1 TCRα, and TCRβ are coloured in wheat, brown, green, and blue respectively. The darker shades of green and blue correspond to the JDIa41b1 TCR in the JDIa41b1-HLA-A*11-KRASG12D complex. The KRASWT and KRASG12D peptides are coloured in grey and maroon respectively. b Top view of the JDIa41b1-HLA-A*11-KRASG12D complex (PBD 7OW6). The HLA and KRASG12D peptide are shown in surface representation and the CDRs are shown in cartoon tube representations. The crossing angle vector is drawn connecting the disulphides between the JDIa41b1 TCRα (green sphere) and TCRβ (blue sphere) variable domains. c Close up view of the JDIa41b1 TCR-peptide interactions (as overlayed in a). The dotted lines indicate polar contacts. d The HLA interaction network around the peptide residue D6 in the JDIa41b1-HLA-A*11-KRASG12D complex (PBD 7OW6). e Superposition of the HLA-A*11-KRASWT (PBD 7OW3) and HLA-A*11-KRASG12D (PBD 7OW4) complexes without a bound TCR showing the peptides adopt open conformations. f Superposition of TCR bound JDIa41b1-HLA-A*11-KRASWT (PBD 7OW5) and JDIa41b1-HLA-A*11-KRASG12D (PBD 7OW6) complexes showing the peptides adopt closed conformations.
Fig. 3
Fig. 3. Difference in binding energy is primarily driven by changes in electrostatic potential in pHLA mediated by the D6 mutation.
a Enthalpy, entropy, and Gibb’s free energy values obtained from thermodynamic analysis. bd Color mapping of the differences between JDIa41b1-HLA-A*11-KRASG12D and -HLA-A*11-KRASWT (G12D – WT) in terms of the contribution to the binding energy per residue, showing the residues with higher contribution to the binding energy in G12D (blue) and those with higher contribution in the WT (red). The scale is ±2 kcal.mol-1. The peptide is shown as ball and sticks throughout and any residues with significant differences (P < 0.01) over ±0.25 kcal.mol–1 are shown as sticks. Key residues are labelled. b TCR-pHLA complex with a zoom in on the main changes in the contribution to the binding energy between the WT and G12D peptide bound complexes shown in the box. c pHLA top-down view. d TCR top-down view. e Surface electrostatics of HLA-A*11-KRASWT with the TCR binding zone indicated by dotted white circle. f Surface electrostatics of HLA-A*11-KRASG12D with the TCR binding zone indicated by dotted white circle and key TCR residues in terms of energetic contribution shown as cyan sticks. e, f Surface electrostatics based on static structures prepared for simulation. The scale used is ±2 eV.
Fig. 4
Fig. 4. Peptide library screening shows that high affinity TCR JDIa96b35 has strong preference for D6 residue of HLA-A*11-KRASG12D.
a Schematic representation of the disuphide trapped single chain pHLA trimer construct. b The amino acid composition of the fully randomized peptide library. c Peptide specificity profile generated from the 452 peptides with n > 1 following three cycles of panning with the TCR JDIa96b35. d IFNγ ELISPOT output after SUP-B15 cells were pulsed with 10 µM indicated peptide, treated with 100 pM IMC-KRASG12D and co-cultured with PBMC for 24 h. Targets alone, PBMC alone, no IMC-KRASG12D, and no peptide negative controls (Cont.) were performed. Mean data of three biological replicates ±SEM from one representative experiment from two independent experiments is shown. e IFNγ ELISPOT output after SUP-B15 cells were pulsed with 10 µM KRASG12D, KRASWT, DNHD1, RASL10A, or TCP1-derived peptide, treated with IMC-KRASG12D and co-cultured with PBMC for 24 h. Targets alone, PBMC (alone, with IMC-KRASG12D and no peptide or with IMC-KRASG12D and peptide), no IMC-KRASG12D and no peptide negative controls (Cont.) were performed. Mean data of three biological replicates ±SEM from one representative experiment from two independent experiments is shown. Source data are provided as a Source Data file.
Fig. 5
Fig. 5. IMC-KRASG12D mediated T cell activation and redirected killing of cancer cells expressing KRASG12D, but not KRASWT.
a Immature dendritic cells differentiated from monocytes isolated from healthy donors were transfected with mRNA encoding KRASWT or KRASG12D or b pulsed with indicated exogenous peptide, were treated with IMC-KRASG12D and co-cultured with autologous T cells for 24 h. T cell activation was measured by IFNγ ELISPOT assay. Three biological replicates from one representative experiment from two independent experiments are shown. c Immunoblot and densitometry analysis of isogenic PSN-1 cell lysates. Blot is representative of two independent experiments. Uncropped blots can be viewed in Supplementary Fig. S10. d IFNγ ELISPOT output of cell lines modified to express HLA-A*11 and KRASG12D (clones 1 & 2), HLA-A*11 and KRASWT (clone 3) or only KRASG12D (clone 4) treated with IMC-KRASG12D and co-cultured with PBMC for 24 h. Targets alone, or no IMC-KRASG12D negative controls (Cont.) were performed. Mean data of three biological replicates ±SEM from one representative experiment from three independent experiments is shown. e IFNγ ELISPOT output of an extended panel of HLA-A*11-KRASG12D + and HLA-A*11-KRASG12D- cancer cell lines and healthy cells, treated with IMC-KRASG12D and co-cultured with PBMC for 24 h. HLA-A*11 + /KRASG12D- cell lines were pulsed with 10 µM KRASG12D (‘+G12D’) peptide as a positive control. Mean data of three biological replicates ±SEM from one representative experiment from two independent experiments is shown f. Redirected T cell killing assay of HLA-A*11 + /KRASG12D CL40 cancer or HLA-A*11 + /KRASWT normal human colonic epithelial cells expressing nuclear-restricted mKATE2, treated with IMC-KRASG12D and co-cultured with PBMC for 72 h. Cells were pulsed with 10 µM KRASG12D (‘+G12D’) peptide as a positive control. Targets alone, PBMC alone or no IMC-KRASG12D negative controls (Cont.) were performed. Mean data of three biological replicates ±SD from one representative experiment from two independent experiments is shown. Source data are provided as a Source Data file.

References

    1. Yarchoan M, Johnson BA, Lutz ER, Laheru DA, Jaffee EM. Targeting neoantigens to augment antitumour immunity. Nat. Rev. Cancer. 2017;17:209–222. doi: 10.1038/nrc.2016.154. - DOI - PMC - PubMed
    1. Schumacher TN, Schreiber RD. Neoantigens in cancer immunotherapy. Science. 2015;348:69–74. doi: 10.1126/science.aaa4971. - DOI - PubMed
    1. Douglass J, et al. Bispecific antibodies targeting mutant RAS neoantigens. Sci. Immunol. 2021;6:eabd5515. doi: 10.1126/sciimmunol.abd5515. - DOI - PMC - PubMed
    1. Hsiue EH-C, et al. Targeting a neoantigen derived from a common TP53 mutation. Science. 2021;371:eabc8697. doi: 10.1126/science.abc8697. - DOI - PMC - PubMed
    1. Tran E, et al. Immunogenicity of somatic mutations in human gastrointestinal cancers. Science. 2015;350:1387–1390. doi: 10.1126/science.aad1253. - DOI - PMC - PubMed

Publication types

MeSH terms

Substances